 🏷️ Likely Rental
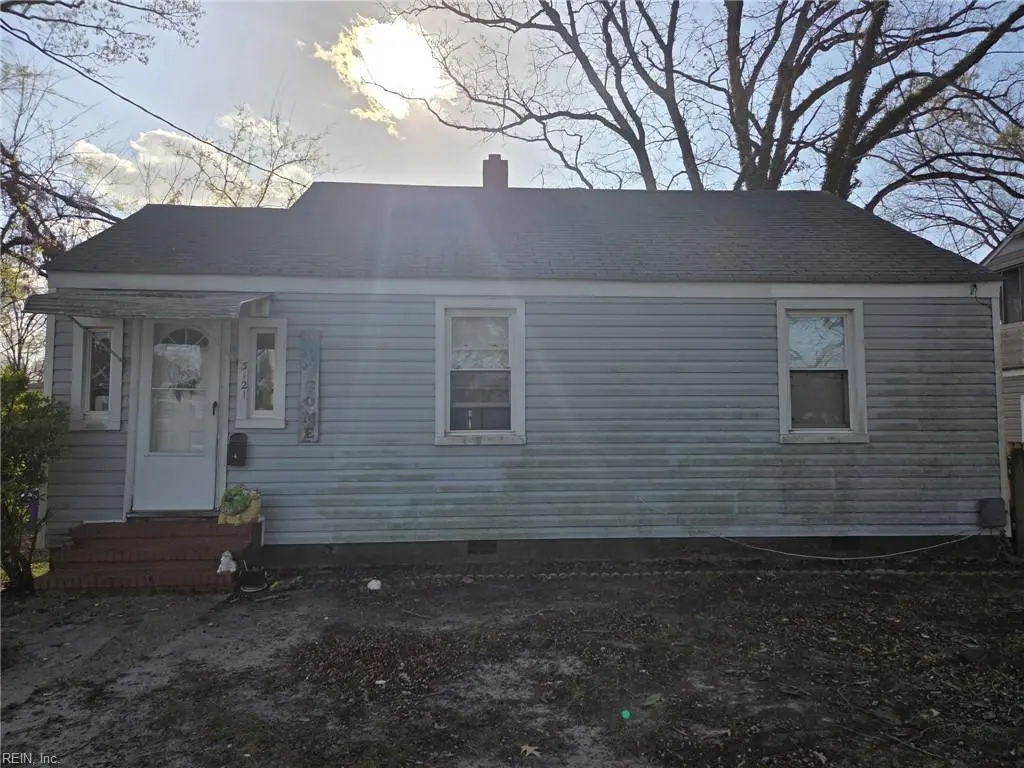
3121 Jersey Ave · Norfolk, VA
Flood risk 3/10 · Minor
- FEMA flood zone
- X (unshaded)
- Chance of flooding over 30 yrs
- 0.12%
- Est. flood insurance / yr
- $507 – $1,088
Fire risk 1/10 · Minimal
- Est. fire insurance / yr
- $666 – $1,236
Heat risk 9/10 · Severe
- Hot days now (above 105°F)
- 7 days/yr
- Hot days in 30 yrs
- 16 days/yr
Wind risk 8/10 · Major
- Chance of severe wind over 30 yrs
- 80.0%
Air-quality risk 3/10 · Minor
- Unhealthy air days now
- 2 days/yr
- Unhealthy air days in 30 yrs
- 3 days/yr
Risk factors via First Street. Map © Google.
Why this score? — see what drove the C grade
The composite is a weighted blend of 9 inputs, each scored 0–100. Each bar is that input's sub-score; the figure is the points it added to the 100-point composite (weight × sub-score).
- Cash flow +17.5/30.0
- ARV discount +15.0/15.0
- DSCR +5.5/10.0
- 1% rule +4.5/10.0
- Livability +4.2/5.0
- Schools +3.5/10.0
- Rent growth +3.4/5.0
- Condition / age +2.5/5.0
- Appreciation +0.0/10.0
$140,000
🖨 Deal sheet (PDF) 📄 Offer letter ✓ Due diligence
Listing remarks MLS
ATTENTION INVESTORS!!! currently Tenant occupied….. Tenant would like to stay but can vacate prior to closing. Property is a fixer upper ARV is approximately 230k. seller desires cash buyers
Key facts
- 5,235 sq ft lot
- Built 1940
- Listed 49 days
Neighborhood map
What this means for you Summary
Snapshot
- This is a 2-bed/1.0-bath single-family listed at $140k.
Deal economics
- At list price, monthly cash flow is $107 ($1k/yr) — positive.
- The deal already cash-flows at list — no discount required.
- To meet the 1% rule (rent ≥ 1% of price), the offer needs to be $133k (5.1% below list).
- Recommended offer: $133k (5.1% below list) — sets the bar for 1% rule.
- Cap rate 7.2% vs local median 4.0% in Norfolk — top-decile yield for the area; either an underpriced asset or a hidden risk that comps aren't pricing in. Stress-test before assuming the spread holds.
Location & tenants
- Location reads 83/100 on livability (#43 in VA, #1,026 nationally) — a professional / high-income tenant draw. Strengths: amenities A+, commute A+, health & safety A+; Watch: employment C-, crime F.
- Norfolk City Public School District (urban): math 27% / reading 56% proficiency, ranked #118 of 131 in VA (top 90%) — families likely to look elsewhere, expect single-tenant / working-renter base with shorter leases.
- Zoned schools: Coleman Place Elementary (math 13% / reading 38%, grade F, #1,046 of 1,108 statewide, top 95%, 617 students, 98% FRL); Norview Middle (math 19% / reading 54%, grade F, #320 of 342 statewide, top 95%, 1,259 students, 89% FRL); Booker T Washington High (math 26% / reading 70%, grade D, #303 of 319 statewide, top 95%, 947 students, 94% FRL) — zoned schools average 94% FRL vs 59% district-wide (35 pts higher); higher-poverty schools than district average — tighter screening recommended.
- Market conditions: Rents rising (+3.4%/yr); 135 active listings in the ZIP; 23 comparable units currently listed for rent nearby; rentals at typical pace (median 25d on market — plan ~3-4 weeks tenant-placement turnaround); 48% of comp listings sitting > 30 days — soft ceiling on asking rent; 438 units permitted in Norfolk city in 2024 (273 in 5+ unit buildings).
Forward outlook
- Local home prices are declining (-3.0%/yr); year-one equity from $968 of loan paydown is wiped out by about $4k of value loss. Plan a longer hold.
Negotiation context
- It's been on market 50 days — a 3% lower offer ($136k) is reasonable based on typical stale-listing flexibility.
- Current owner paid $50k; list at $140k implies a 181% gain — meaningful room to come down on a strong offer.
Risks & watch-outs
- Watch-outs: built in 1940 — expect roof / HVAC / electrical / plumbing capex.
- Climate carrying-cost: severe wind risk, 80% chance of damaging wind over 30y; extreme-heat days projected 7→16/yr by 2055 (HVAC capex compounding) — expect insurance premiums to compound above CPI over the hold.
Questions for the listing agent
- It's been on market 50 days. Have you received any prior offers? Is the seller open to a 5% concession, seller financing, or rate buy-down credit?
- Built in 1940 — when were the roof, HVAC, electrical panel, plumbing, and water heater last replaced?
- Is there a deadline driving the sale (1031 exchange, divorce, estate, relocation)? That informs how much negotiation room exists.
- Schools are A-rated — typically a magnet for longer-tenancy family renters. What's the average tenant stay here, and is there a school-zone premium baked into asking?
- Crime grade is F in this area — have there been break-ins, vandalism, or insurance claims at this property in the last 3 years? What carrier currently insures it and at what premium?
- What's the average days-on-market for RENTAL listings here right now (not sales)? A rising rental-DOM trend means longer vacancies and softer asking-rent achievability than the comps imply.
- What's the recent tenant-quality profile in this submarket — average credit score on applications, eviction rate, late-payment / NSF rate, and stable-employment percentage? A property-management company in the area should have these aggregated.
- How much new for-sale + rental construction is in the pipeline within 1–3 miles? Heavy new supply typically softens prices + rents 12–24 months out; constrained supply supports both.
Investment metrics
- 1% rule
- 0.95% ✗
- Cap rate
- 7.21%
- Cash-on-cash
- 3.27%
- DSCR
- 1.15
- GRM
- 8.8
CMA / ARV
- ARV (median comp)
- $237,396
- List price
- $140,000
- Delta
- -41.03%
- Verdict
- UNDERPRICED
- Comps
- 20 within 1.0 mi
Show comp detail 12 sales within ~0.75 mi
| Address | Dist | Beds/Ba | Sqft | Sold | Price | $/sf | Match |
|---|---|---|---|---|---|---|---|
| 3711 Atterbury St | 0.16mi | 2/1.0 | 760 (+4%) | 7mo | $225,000 | $296 | 80 |
| 3749 Davis St | 0.35mi | 2/1.0 | 797 (+9%) | 2mo | $125,000 | $157 | 68 |
| 3521 Essex Cir | 0.70mi | 2/1.0 | 732 (0%) | 2mo | $215,000 | $294 | 66 |
| 2325 Rush St | 0.68mi | 2/1.0 | 720 (-2%) | 8mo | $192,000 | $267 | 59 |
| 2735 Harrell Ave | 0.65mi | 2/1.0 | 684 (-7%) | 5mo | $180,000 | $263 | 55 |
| 2421 Alder St | 0.68mi | 2/1.0 | 768 (+5%) | 9mo | $200,000 | $260 | 52 |
| 3061 Tree Chop Rd | 0.67mi | 2/1.0 | 800 (+9%) | 3mo | $165,000 | $206 | 51 |
| 3021 Sewells Point Rd | 0.72mi | 2/1.0 | 752 (+3%) | 13mo | $178,450 | $237 | 51 |
| 3125 Saint Mihiel Ave | 0.69mi | 2/1.0 | 800 (+9%) | 5mo | $215,000 | $269 | 48 |
| 3709 Wayne Cres | 0.57mi | 2/1.0 | 804 (+10%) | 11mo | $244,719 | $304 | 48 |
| 2733 Mckann Ave | 0.69mi | 2/1.5 | 810 (+11%) | 3mo | $250,000 | $309 | 46 |
| 4717 Krick St | 0.68mi | 3/2.0 (+1) | 835 (+14%) | 3mo | $255,000 | $305 | 33 |
Match score weights: distance 35% · size 25% · config 20% · recency 20%. Top-matched comps best support the ARV.
Projected returns pro-forma
-3.0% appreciation · 3.42% rent growth · sell at horizon
- IRR
- -10.7%
- Equity multiple
- 0.61×
- Total profit
- $-15,313
- Equity at exit
- $20,874
- IRR
- -0.8%
- Equity multiple
- 0.94×
- Total profit
- $-2,221
- Equity at exit
- $12,105
Cash invested: $39,200 (down + closing). Projections, not guarantees.
Landlord ↔ Tenant lean methodology
- Overall (STATE)
- 55 Moderately Landlord-Leaning
- State Virginia
- 55 Moderately Landlord-Leaning · D+2
- County
- — inherits STATE
- City
- — inherits STATE
ZIP-level market 23513
- Home prices YoY
- -9.3%
- Rents YoY
- 3.4%
- Active inventory
- 135
- Price-to-rent
- 8.8×
Monthly cashflow live
- Estimated rent
- $1,328 high interval (Pro) →
- Mortgage (P&I)
- −$734
- Tax from tax record
- −$150 /mo · $1,797/yr
- Insurance
- −$58
- HOA
- −$0
- Vacancy / Maint / Mgmt
- −$279
- Net cashflow
- $107
Break-even live
Sensitivity live
| Price | -10% $186 | -5% $146 | +0% $107 | +5% $67 | +10% $28 |
|---|---|---|---|---|---|
| Rent | -10% $2 | -5% $54 | +0% $107 | +5% $159 | +10% $212 |
| Rate | -1.0pp $177 | -0.5pp $142 | base $107 | +0.5pp $71 | +1.0pp $34 |
UW: 25.0% down · 7.5% · 30yr · 1.5% tax · 5.0% vac · 8.0% maint · 8.0% mgmt
Financing live
Cash to close
- Down payment
- $35,000
- Closing costs
- $4,200
- Reserves months
- —
- Total cash needed
- —
Loan-product check · same deal, 3 products live
Conventional
25% down · 7.5% · 30yr
- Down + closing
- —
- Monthly P&I
- —
- Monthly cashflow
- —
- DSCR
- —
- Eligible?
- —
Personal DTI + credit; lowest rate.
DSCR
20% down · 8.5% · 30yr
- Down + closing
- —
- Monthly P&I
- —
- Monthly cashflow
- —
- DSCR
- —
- Eligible?
- —
No personal income docs; deal must DSCR.
Hard money
10% down · 12.0% · 12mo
- Down + closing
- —
- Monthly P&I
- —
- Monthly cashflow
- —
- DSCR
- —
- Eligible?
- —
Short-term bridge; refi at stabilization.
Rent comps 23 comps
| Address | Beds | Baths | Sqft | Rent | $/sqft | DOM | Units | Dist |
|---|---|---|---|---|---|---|---|---|
| 2939 Marne Ave Norfolk, VA | 2.0 | 1.0 | 659 | $1,700 | $2.58 | 45d | 1 | 0.56mi |
| 3219 Brest Ave Norfolk, VA | 2.0 | 1.0 | 675 | $1,100 | $1.63 | 45d | 1 | 0.63mi |
| 4505 Cape Henry Ave Norfolk, VA | 2.0 | 1.0 | 720 | $1,000 | $1.39 | 45d | 1 | 0.83mi |
| 3872 Wake Cir Unit A Norfolk, VA | 2.0 | 1.0 | 750 | $1,395 | $1.86 | 4d | 1 | 0.86mi |
| 3872 Wake Cir Unit A Norfolk, VA | 2.0 | 1.0 | 750 | $1,395 | $1.86 | 45d | 1 | 0.86mi |
| 2403 Sewells Point Rd Unit 3 Norfolk, VA | 1.0 | 1.0 | 600 | $950 | $1.58 | 45d | 1 | 0.87mi |
| 2928 Tidewater Dr Norfolk, VA | 2.0 | 1.0 | 740 | $1,350 | $1.82 | 25d | 1 | 0.98mi |
| 1822 Saint Denis Ave Apt 4 Norfolk, VA | 2.0 | 1.0 | 750 | $995 | $1.33 | 45d | 1 | 0.99mi |
| 1801 Saint Denis Ave Unit 1 Norfolk, VA | 1.0 | 1.0 | 750 | $1,595 | $2.13 | 25d | 1 | 1.06mi |
| 2707 Azalea Garden Rd Apt B3 Norfolk, VA | 2.0 | 1.0 | 680 | $1,195 | $1.76 | 25d | 1 | 1.12mi |
| 4852 E Princess Anne Rd Norfolk, VA | 1.0 | 1.0 | 700 | $1,099 | $1.57 | 19d | 1 | 1.19mi |
| 6225 Alexander St Norfolk, VA | 2.0 | 1.0 | 750 | $1,299 | $1.73 | 45d | 1 | 1.21mi |
| 6225 Alexander St Unit F Norfolk, VA | 2.0 | 1.0 | 750 | $1,499 | $2.00 | 22d | 1 | 1.21mi |
| 6241 Alexander St Unit F Norfolk, VA | 2.0 | 1.0 | 704 | $895 | $1.27 | 14d | 1 | 1.22mi |
| 1445 Norcova Ave Apt E Norfolk, VA | 2.0 | 1.0 | 750 | $1,125 | $1.50 | 45d | 1 | 1.24mi |
| 1507 Halstead Ave Apt 102 Norfolk, VA | 1.0 | 1.0 | 500 | $989 | $1.98 | 45d | 1 | 1.26mi |
| 5010 E Princess Anne Rd Norfolk, VA | 1.0 | 1.0 | 500 | $989 | $1.98 | 45d | 1 | 1.26mi |
| 6115 Tidewater Dr Norfolk, VA | 1.0–2.0 | 1.0–2.0 | 956 | $2,274 | $2.38 | 3d | 8 | 1.26mi |
| 6340 Sewells Point Rd Apt communities Norfolk, VA | 2.0 | 1.0 | 750 | $1,099 | $1.47 | 23d | 1 | 1.35mi |
| 6343 Chesapeake Blvd Apt communities Norfolk, VA | 2.0 | 1.0 | 750 | $1,099 | $1.47 | 23d | 1 | 1.36mi |
| 2421 Bolton St Unit F Norfolk, VA | 2.0 | 1.0 | 725 | $1,275 | $1.76 | 45d | 1 | 1.39mi |
| 151 Orleans Cir #3 Norfolk, VA | 1.0 | 1.0 | 510 | $1,075 | $2.11 | 12d | 1 | 1.40mi |
| 151 Orleans Cir Unit 2 Norfolk, VA | 1.0 | 1.0 | 510 | $1,050 | $2.06 | 12d | 1 | 1.40mi |
Listing history 5 events
-
2026-04-06$140,000 Active 197-char remark
Show marketing remark (197 chars)
ATTENTION INVESTORS!!! currently Tenant occupied….. Tenant would like to stay but can vacate prior to closing. Property is a fixer upper ARV is approximately 230k. seller desires cash buyers
-
2014-10-21price $54,900
-
1988-01-07soldstatus $49,900
-
1987-08-03soldstatus $45,100
-
1985-06-14soldstatus $41,500
ⓘ Source: listings_history table (triggers on properties + properties_extension) + one-shot
backfill from property_details.listing_events for pre-trigger history.
Tax reassessment forecast VA · Resets to sale price
- Current annual tax
- $1,797 · $150/mo
- Projected year-2 tax
- $1,797 · $150/mo
- Expected delta
- $0/yr ($0/mo · 0.0%)
ⓘ Screening estimate from a state-policy table — verify with the county assessor before closing.
Climate risk First Street
- Flood 3/10 Moderate FEMA zone X (unshaded) · 12% chance over 30 yrs
- Wildfire 1/10 Low
- Heat 9/10 Extreme 7 d/yr ≥105°F today · 16 d/yr by 30 yrs out
- Wind 8/10 Severe 80% chance of damaging wind over 30 yrs
- Air quality 3/10 Moderate 2 unhealthy d/yr today · 3 by 30 yrs out
Nearby sold comps map
Loading sold comps map…
Walkable amenities ~0.75 mi
Loading nearby amenities…
Taxation est. · year 1
- Rental income
- $15,936
- − Mortgage interest
- −$7,842
- − Property taxes
- −$1,797
- − Insurance
- −$700
- − Repairs & maintenance
- −$1,275
- − Management
- −$1,275
- − Depreciation
- −$4,073
- Taxable loss
- −$1,026
- Est. tax savings @ 24.0%
- +$246
- After-tax cash flow
- $1,528/yr
For passive investors: Depreciation is non-cash, so a rental often shows a tax loss while cash-flowing — sheltering income. Rental losses are passive: they offset passive income freely, and up to $25,000/yr can offset ordinary (W-2) income if you actively participate and your MAGI is under $100k (phasing out to $0 by $150k); unused losses carry forward. On sale, claimed depreciation is recaptured at up to 25%, and gains may owe capital-gains tax (a 1031 exchange can defer both). Figures are a year-1 estimate at your 24.0% rate — not tax advice; consult a CPA.
Schools (NCES district)
- District
- Norfolk City Public School District
- NCES district ID
- 5102670
- Math proficiency
- 27% ▼ -44.00%
- Reading proficiency
- 56% ▼ -10.00%
- Median HH income
- $44,358
- Composite
- 35.08/100
- National rank
- #5026
- State rank
- #118 of 131 in VA
Livability — Norfolk
- Score
- 83/100
- State rank
- #43
- US rank
- #1026
Category grades
Schools grade is shown separately in the Schools card above.
Census & demographics
- Census place
- Norfolk, VA
- County
- Norfolk City · 214,042 people
- City population
- 214,042
- Metro
- Virginia Beach-Norfolk-Newport News, VA-NC
- Population (ZIP)
- 28,628
- Household income
- $68,380
- Rent vs Own
- Severe rent burden
- 1342.0
Population outlook (Norfolk County) Hauer SSP2
- Today (2025)
- 249,032 people
- By 2030
- 252,347 · +1.3%
- By 2040
- 253,644 · +1.9%
- By 2050
- 251,913 · +1.2%
- By 2075
- 245,281 · -1.5%
- By 2100
- 219,548 · -11.8%
Race, ethnicity, and origin ACS 2023
- Neighborhood character
- Diverse neighborhood (Simpson 0.63)
- Race & ethnicity
- Black 55% White 23% Hispanic / Latino 11% Two or more races 7% Asian 5%
- Hispanic origin (detail)
- Mexican 4% Puerto Rican 3%
- Common ancestry
- Romanian 1% Slovak 1% Lithuanian 0%
- Foreign-born
- 10% · Canada
- Languages at home
- 87% English-only · Spanish 6% Tagalog/Filipino 4% French/Haitian/Cajun 1%
Political lean MEDSL · Norfolk
- 2024 margin
- Solid D (+41.5) · D 70.0% · R 28.5% · Other 1.6%
- 2008→2024 swing
- -1.4pp toward R · 2008: 43.0pp · 2024: 41.5pp
- All cycles
- 2024: D+41.5 2020: D+45.6 2016: D+42.0 2012: D+44.0 2008: D+43.0
Not yet ingested
- Civics
- —
Market trends
- HPI YoY
- ▼ -33.67%
- Current HPI
- 329.2241
- Rent YoY
- ▲ 3.42%
- Metro
- Virginia Beach-Norfolk-Newport News, VA-NC
- State GDP YoY
- ▲ 2.40%
- F500 in state
- 50
Industry mix (Fortune 500 HQ in VA)
| Industry | F500 HQs | Revenue |
|---|---|---|
| Aerospace / Defense | 4 | $236B |
|
||
| Technology / Defense | 3 | $32B |
|
||
| Financial Services | 2 | $176B |
|
||
| Utilities | 2 | $27B |
|
||
| Insurance | 2 | $25B |
|
||
| Technology | 2 | $15B |
|
||
Price history
+237.3% since first listed5 events — show timeline
- 2026-04-06 Listed $140,000 REINMLS
- 2014-10-21 Price Changed $54,900 REINMLS
- 1988-01-07 Sold (Public Records) $49,900 Public Records
- 1987-08-03 Sold (Public Records) $45,100 Public Records
- 1985-06-14 Sold (Public Records) $41,500 Public Records
Property tax history
+5.0%/yrLatest (2025): $1,797 · +3.6% YoY. Source: county tax records.
Cash-flow waterfall
monthlySold comps — $/sqft
last 12 mo · ≤1 miLoading sold comps…