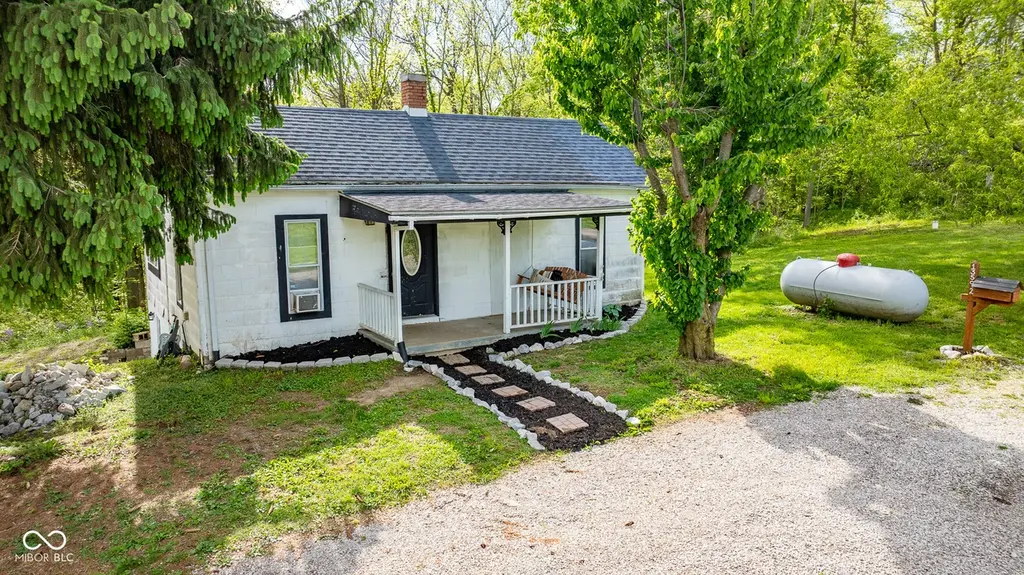
13592 N County Road 275 W · Russellville, IN
Flood risk 1/10 · Minimal
- FEMA flood zone
- X (unshaded)
- Chance of flooding over 30 yrs
- 0.0%
- Est. flood insurance / yr
- $473 – $860
Fire risk 1/10 · Minimal
- Est. fire insurance / yr
- $717 – $1,331
Heat risk 3/10 · Minor
- Hot days now (above 102°F)
- 7 days/yr
- Hot days in 30 yrs
- 18 days/yr
Wind risk 2/10 · Minimal
- Chance of severe wind over 30 yrs
- 1.0%
Air-quality risk 2/10 · Minimal
- Unhealthy air days now
- 1 days/yr
- Unhealthy air days in 30 yrs
- 2 days/yr
Risk factors via First Street. Map © Google.
Why this score? — see what drove the B grade
The composite is a weighted blend of 9 inputs, each scored 0–100. Each bar is that input's sub-score; the figure is the points it added to the 100-point composite (weight × sub-score).
- Cash flow +23.6/30.0
- ARV discount +15.0/15.0
- Appreciation +9.4/10.0
- DSCR +7.6/10.0
- 1% rule +5.4/10.0
- Schools +4.1/10.0
- Livability +2.9/5.0
- Rent growth +2.5/5.0
- Condition / age +2.5/5.0
$105,000
🖨 Deal sheet 📄 Offer letter ✓ Due diligence
Listing remarks MLS
Nice home with great lot and privacy. Walk out basement could be finished for additional room. Lots of potential.
Key facts
- 0.5 acre lot
- 3 garage spots
- Built 1900
Tags
Property features AI
Finance
- Other: Approximately 0.5 acre lot; Has additional parcels
Exterior
- Parking: Detached 3-car garage
- Utilities: Private water; Private sewer; No municipal solid waste service listed
- Home design: Single family residence; One level
- Construction: Cement siding; Block foundation
- Exterior features: Covered patio/porch; Mature trees and small trees; Wooded lot; Not in a subdivision
Interior
- Kitchen: Electric oven; Microwave; Refrigerator
- Bedrooms: 2 bedrooms (both on the main level)
- Bathrooms: 1 full bathroom (on the main level)
- Heating & cooling: Natural gas heating; Window air conditioning units
- Interior features: Supplemental storage; Unfinished basement
- Laundry & utility: Washer; Dryer
Neighborhood map
What this means for you Summary
Snapshot
- This is a 2-bed/1.0-bath single-family listed at $105k.
Deal economics
- At list price, monthly cash flow is $198 ($2k/yr) — positive.
- The deal already cash-flows at list — no discount required.
- Meets the 1% rule at list price ($1k rent vs $105k).
- Recommended offer: $103k (1.5% below list) — sets the bar for market timing.
Location & tenants
- Location reads 58/100 on livability (#576 in IN) — a working-class tenant base; expect higher turnover. Strengths: cost of living A+, housing A+; Watch: crime D, amenities F, commute F.
- North Putnam Community Schools (rural): math 47% / reading 48% proficiency, ranked #73 of 301 in IN (top 24%) — families likely to look elsewhere, expect single-tenant / working-renter base with shorter leases.
- Zoned schools: North Putnam Sr High School (math 52% / reading 67%, grade C+, #49 of 369 statewide, top 16%, 437 students, 43% FRL).
- Zoned-school proficiency averages 60% at this address vs 48% district-wide (+12 pts) — the actual schools serving this property are materially stronger than the North Putnam Community Schools average implies; a family-tenant draw the district grade alone would hide.
- Market conditions: 14 active listings in the ZIP; 166 units permitted in Putnam County in 2024 (0 in 5+ unit buildings).
Forward outlook
- In year one you build about $10k of equity ($726 loan paydown + $9k appreciation (8.8% local appreciation)).
- Putnam County population projected to shrink 8% by 2050 — rents likely to lag national; underwrite the cash flow, not the appreciation.
- At projected returns (8.8% appreciation + 3.0% rent growth), your $29k cash investment doubles in ~3 years — after that, you're playing with house money.
- By year 4, paydown + projected appreciation supports a ~$35k cash-out refi (75% LTV) — recoverable capital for the next deal without selling this one.
Negotiation context
- It's been on market 23 days — a 2% lower offer ($103k) is reasonable based on typical stale-listing flexibility.
- 8 sale attempts since 23y ago with the ask held roughly flat each time — persistent listings suggest the price (not the market) is what's stuck; bring a comps-based counter.
- Current owner paid $18k; list at $105k implies a 483% gain — meaningful room to come down on a strong offer.
Risks & watch-outs
- Watch-outs: built in 1900 — expect roof / HVAC / electrical / plumbing capex.
Questions for the listing agent
- Built in 1900 — when were the roof, HVAC, electrical panel, plumbing, and water heater last replaced?
- Is there a deadline driving the sale (1031 exchange, divorce, estate, relocation)? That informs how much negotiation room exists.
- Schools are F-rated, which usually means shorter tenancies and higher turnover. Who's the typical renter profile here, and what's been the actual vacancy rate?
- Crime grade is D in this area — have there been break-ins, vandalism, or insurance claims at this property in the last 3 years? What carrier currently insures it and at what premium?
- What's the average days-on-market for RENTAL listings here right now (not sales)? A rising rental-DOM trend means longer vacancies and softer asking-rent achievability than the comps imply.
- What's the recent tenant-quality profile in this submarket — average credit score on applications, eviction rate, late-payment / NSF rate, and stable-employment percentage? A property-management company in the area should have these aggregated.
- How much new for-sale + rental construction is in the pipeline within 1–3 miles? Heavy new supply typically softens prices + rents 12–24 months out; constrained supply supports both.
Investment metrics
- 1% rule
- 1.04% ✓
- Cap rate
- 8.55%
- Cash-on-cash
- 8.06%
- DSCR
- 1.36
- GRM
- 8.0
CMA / ARV
- ARV (median comp)
- $175,867
- List price
- $105,000
- Delta
- -40.30%
- Verdict
- UNDERPRICED
- Comps
- 3 within 1.0 mi
Projected returns pro-forma
8.81% appreciation · 3.0% rent growth · sell at horizon
- IRR
- 27.8%
- Equity multiple
- 3.09×
- Total profit
- $61,306
- Equity at exit
- $85,613
- IRR
- 24.6%
- Equity multiple
- 6.75×
- Total profit
- $168,991
- Equity at exit
- $175,838
Cash invested: $29,400 (down + closing). Projections, not guarantees.
Landlord ↔ Tenant lean methodology
- Overall (STATE)
- 90 Strongly Landlord-Friendly
- State Indiana
- 90 Strongly Landlord-Friendly · R+11
- County
- — inherits STATE
- City
- — inherits STATE
ZIP-level market 46172
- Home prices YoY
- 3.5%
- Active inventory
- 14
- Price-to-rent
- 8.0×
Monthly cashflow live
- Estimated rent
- $1,092 medium interval (Pro) →
- Mortgage (P&I)
- −$551
- Tax from tax record
- −$71 /mo · $849/yr
- Insurance
- −$44
- HOA
- −$0
- Vacancy / Maint / Mgmt
- −$229
- Net cashflow
- $198
Break-even live
UW: 25.0% down · 7.5% · 30yr · 1.5% tax · 5.0% vac · 8.0% maint · 8.0% mgmt
Financing live
Cash to close
- Down payment
- $26,250
- Closing costs
- $3,150
- Reserves months
- —
- Total cash needed
- —
Loan-product check · same deal, 3 products live
Conventional
25% down · 7.5% · 30yr
- Down + closing
- —
- Monthly P&I
- —
- Monthly cashflow
- —
- DSCR
- —
- Eligible?
- —
Personal DTI + credit; lowest rate.
DSCR
20% down · 8.5% · 30yr
- Down + closing
- —
- Monthly P&I
- —
- Monthly cashflow
- —
- DSCR
- —
- Eligible?
- —
No personal income docs; deal must DSCR.
Hard money
10% down · 12.0% · 12mo
- Down + closing
- —
- Monthly P&I
- —
- Monthly cashflow
- —
- DSCR
- —
- Eligible?
- —
Short-term bridge; refi at stabilization.
Listing history 26 events
-
2026-06-13status $105,000 Pending 23 DOM
-
2026-06-12days on market $105,000 Active 23 DOM
-
2026-06-09days on market $105,000 Active 20 DOM
-
2026-06-08days on market $105,000 Active 19 DOM
-
2026-06-07pricedays on market $105,000 Active 18 DOM
-
2026-06-05days on market $110,000 Active 16 DOM
-
2026-06-04days on market $110,000 Active 14 DOM
-
2026-06-02days on market $110,000 Active 13 DOM
-
2026-06-01days on market $110,000 Active 12 DOM
-
2026-05-31days on market $110,000 Active 11 DOM
-
2026-05-31days on market $110,000 Active 10 DOM
-
2026-05-04status Pending 443-char remark
-
2026-05-02$110,000 Active 443-char remark
-
2009-10-13soldstatus $18,000 113-char remark
Show marketing remark (113 chars)
Nice home with great lot and privacy. Walk out basement could be finished for additional room. Lots of potential.
-
2009-09-17$20,000 113-char remark
Show marketing remark (113 chars)
Nice home with great lot and privacy. Walk out basement could be finished for additional room. Lots of potential.
-
2009-09-03soldstatus $35,915
-
2008-09-09historical
-
2008-07-01$52,500
-
2006-03-13soldstatus $29,900
-
2006-02-06$29,900
-
2006-02-01historical
-
2005-10-24$35,000
-
2004-12-23historical
-
2004-06-23$59,900
-
2003-07-21historical
-
2003-01-21$65,900
ⓘ Source: listings_history table (triggers on properties + properties_extension) + one-shot
backfill from property_details.listing_events for pre-trigger history.
Tax reassessment forecast IN · Partial reset (capped growth)
- Current annual tax
- $849 · $71/mo
- Projected year-2 tax
- $871 · $73/mo
- Expected delta
- +$22/yr (+$2/mo · 2.6%)
ⓘ Screening estimate from a state-policy table — verify with the county assessor before closing.
Climate risk First Street
- Flood 1/10 Low FEMA zone X (unshaded) · 0% chance over 30 yrs
- Wildfire 1/10 Low
- Heat 3/10 Moderate 7 d/yr ≥102°F today · 18 d/yr by 30 yrs out
- Wind 2/10 Low 100% chance of damaging wind over 30 yrs
- Air quality 2/10 Low 1 unhealthy d/yr today · 2 by 30 yrs out
Nearby sold comps map
Loading sold comps map…
Walkable amenities ~0.75 mi
Loading nearby amenities…
Taxation est. · year 1
- Rental income
- $13,103
- − Mortgage interest
- −$5,882
- − Property taxes
- −$849
- − Insurance
- −$525
- − Repairs & maintenance
- −$1,048
- − Management
- −$1,048
- − Depreciation
- −$3,055
- Taxable income
- $697
- Est. tax owed @ 24.0%
- −$167
- After-tax cash flow
- $2,203/yr
For passive investors: Depreciation is non-cash, so a rental often shows a tax loss while cash-flowing — sheltering income. Rental losses are passive: they offset passive income freely, and up to $25,000/yr can offset ordinary (W-2) income if you actively participate and your MAGI is under $100k (phasing out to $0 by $150k); unused losses carry forward. On sale, claimed depreciation is recaptured at up to 25%, and gains may owe capital-gains tax (a 1031 exchange can defer both). Figures are a year-1 estimate at your 24.0% rate — not tax advice; consult a CPA.
Schools (NCES district)
- District
- North Putnam Community Schools
- NCES district ID
- 1807980
- Math proficiency
- 47% ▼ -12.00%
- Reading proficiency
- 48% ▼ -8.00%
- Median HH income
- $54,825
- Composite
- 41.18/100
- National rank
- #3549
- State rank
- #73 of 301 in IN
Livability — Russellville
- Score
- 58/100
- State rank
- #576
- US rank
- #20650
Category grades
Schools grade is shown separately in the Schools card above.
Census & demographics
- Population (ZIP)
- 2,215
Population outlook (Putnam County) Hauer SSP2
- Today (2025)
- 37,226 people
- By 2030
- 36,723 · -1.4%
- By 2040
- 35,407 · -4.9%
- By 2050
- 34,177 · -8.2%
- By 2075
- 32,038 · -13.9%
- By 2100
- 28,380 · -23.8%
Race, ethnicity, and origin ACS 2023
- Neighborhood character
- Predominantly White (99%)
- Race & ethnicity
- White 99%
- Common ancestry
- Slovak 4% Italian 1% Serbian 1%
- Foreign-born
- 0%
Political lean MEDSL · Putnam
- 2024 margin
- Solid R (+52.0) · D 23.1% · R 75.1% · Other 1.8%
- 2008→2024 swing
- -40.0pp toward R · 2008: -12.0pp · 2024: -52.0pp
- All cycles
- 2024: R+52.0 2020: R+50.2 2016: R+49.6 2012: R+32.6 2008: R+12.0
Not yet ingested
- Civics
- —
Market trends
- HPI YoY
- ▲ 8.81%
- Current HPI
- 263.1969
- Rent YoY
- —
- Metro
- —
- State GDP YoY
- ▲ 2.90%
- F500 in state
- 18
Industry mix (Fortune 500 HQ in IN)
| Industry | F500 HQs | Revenue |
|---|---|---|
| Industrial Machinery | 2 | $37B |
|
||
| Healthcare | 1 | $177B |
|
||
| Pharmaceuticals | 1 | $45B |
|
||
| Metals / Steel | 1 | $18B |
|
||
| Agriculture | 1 | $17B |
|
||
| Packaging | 1 | $12B |
|
||
Price history
+59.3% since first listed18 events — show timeline
- 2026-06-12 Pending — MIBOR as Distributed by MLS Grid
- 2026-06-06 Price Changed $105,000 MIBOR as Distributed by MLS Grid
- 2026-05-22 Relisted — MIBOR as Distributed by MLS Grid
- 2026-05-04 Pending — MIBOR as Distributed by MLS Grid
- 2026-05-02 Listed $110,000 MIBOR as Distributed by MLS Grid
- 2009-10-13 Sold (MLS) $18,000 MIBOR as Distributed by MLS Grid
- 2009-09-17 Listed $20,000 MIBOR as Distributed by MLS Grid
- 2009-09-03 Sold (Public Records) $35,915 Public Records
- 2008-09-09 Listing Removed — MIBOR as Distributed by MLS Grid
- 2008-07-01 Listed $52,500 MIBOR as Distributed by MLS Grid
- 2006-03-13 Sold (MLS) $29,900 MIBOR as Distributed by MLS Grid
- 2006-02-06 Listed $29,900 MIBOR as Distributed by MLS Grid
- 2006-02-01 Listing Removed — MIBOR as Distributed by MLS Grid
- 2005-10-24 Listed $35,000 MIBOR as Distributed by MLS Grid
- 2004-12-23 Listing Removed — MIBOR as Distributed by MLS Grid
- 2004-06-23 Listed $59,900 MIBOR as Distributed by MLS Grid
- 2003-07-21 Listing Removed — MIBOR as Distributed by MLS Grid
- 2003-01-21 Listed $65,900 MIBOR as Distributed by MLS Grid
Property tax history
+6.8%/yrLatest (2024): $849 · +2.7% YoY. Source: county tax records.
Cash-flow waterfall
monthlySold comps — $/sqft
last 12 mo · ≤1 miLoading sold comps…