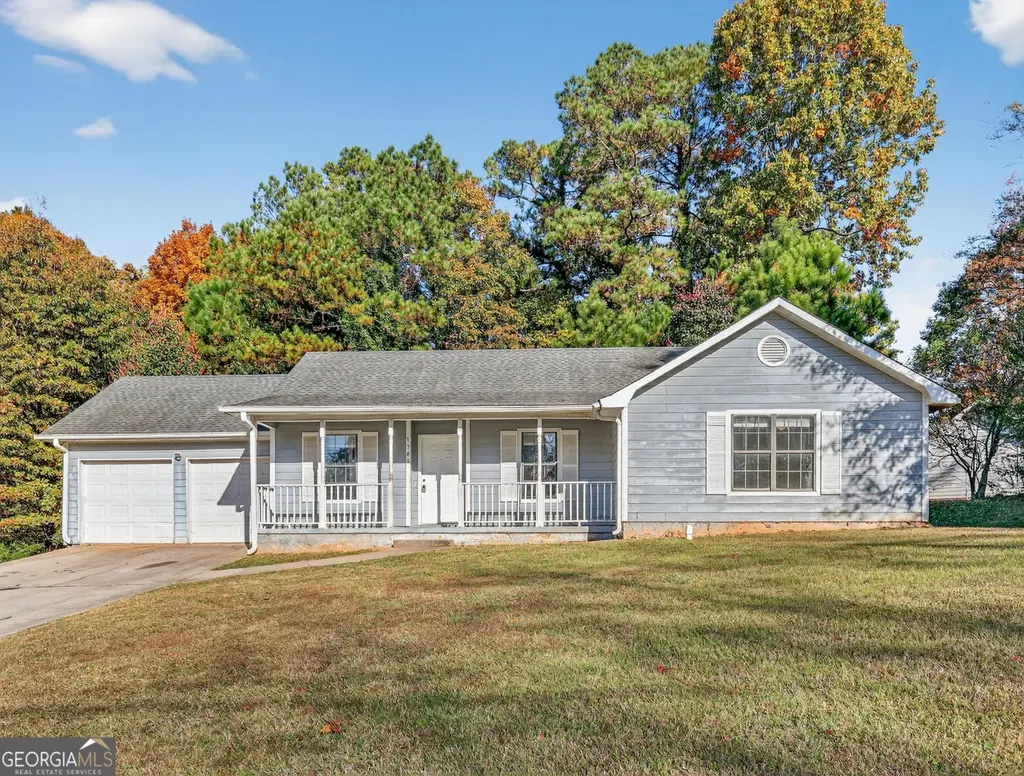
1342 Winslow Dr · Irondale, GA
Flood risk 1/10 · Minimal
- FEMA flood zone
- X (unshaded)
- Chance of flooding over 30 yrs
- 0.0%
- Est. flood insurance / yr
- $507 – $1,088
Fire risk 2/10 · Minimal
- Est. fire insurance / yr
- $963 – $1,789
Heat risk 6/10 · Moderate
- Hot days now (above 105°F)
- 7 days/yr
- Hot days in 30 yrs
- 18 days/yr
Wind risk 6/10 · Moderate
- Chance of severe wind over 30 yrs
- 27.0%
Air-quality risk 4/10 · Minor
- Unhealthy air days now
- 5 days/yr
- Unhealthy air days in 30 yrs
- 6 days/yr
Risk factors via First Street. Map © Google.
Why this score? — see what drove the C- grade
The composite is a weighted blend of 9 inputs, each scored 0–100. Each bar is that input's sub-score; the figure is the points it added to the 100-point composite (weight × sub-score).
- Cash flow +16.3/30.0
- ARV discount +15.0/15.0
- DSCR +5.0/10.0
- 1% rule +4.7/10.0
- Rent growth +3.0/5.0
- Livability +2.9/5.0
- Condition / age +2.5/5.0
- Schools +1.3/10.0
- Appreciation +0.0/10.0
$189,900
🖨 Deal sheet (PDF) 📄 Offer letter ✓ Due diligence
Listing remarks MLS
This cozy 1336 sq ft ranch-style home sits offers a comfortable, single-story layout, featuring 3 bedrooms and 2 bathrooms with an open-concept living area and a well-appointed kitchen. Sit on the front covered porch for outdoor enjoyment.
Key facts
- Front covered porch
- 0.28 acre lot
- Garage
Tags
Neighborhood map
What this means for you Summary
Snapshot
- This is a 3-bed/2.0-bath single-family listed at $190k.
Deal economics
- At list price, monthly cash flow is $104 ($1k/yr) — positive.
- The deal already cash-flows at list — no discount required.
- To meet the 1% rule (rent ≥ 1% of price), the offer needs to be $184k (3.3% below list).
- Recommended offer: $167k (12.0% below list) — sets the bar for market timing.
- Cap rate 6.9% vs local median 5.2% in Irondale — top-decile yield for the area; either an underpriced asset or a hidden risk that comps aren't pricing in. Stress-test before assuming the spread holds.
Location & tenants
- Location reads 57/100 on livability (#466 in GA) — a working-class tenant base; expect higher turnover. Strengths: cost of living A+, housing A+; Watch: crime D+, amenities F, commute F.
- Clayton County (suburban): math 11% / reading 20% proficiency, ranked #155 of 174 in GA (top 89%) — low school quality limits family demand, transient renter base, plan for 1-2y turnover; 78% free/reduced lunch — lower-income household profile, screen leases tightly.
- Zoned schools: Hawthorne Elementary School (math 5% / reading 17%, grade F, #1,071 of 1,228 statewide, top 88%, 821 students, 90% FRL); Mundys Mill Middle School (math 10% / reading 24%, grade F, #381 of 470 statewide, top 82%, 768 students, 90% FRL); Lovejoy High School (math 7% / reading 8%, grade F, #378 of 424 statewide, top 91%, 2,136 students, 90% FRL).
- Market conditions: Rents rising (+2.1%/yr); 259 active listings in the ZIP; 40 comparable units currently listed for rent nearby; rentals at typical pace (median 26d on market — plan ~3-4 weeks tenant-placement turnaround); 42% of comp listings sitting > 30 days — soft ceiling on asking rent; 865 units permitted in Clayton County in 2024 (448 in 5+ unit buildings).
- This rent runs 35% of the median local income ($62k/yr) — at the standard rent-burdened threshold; future hikes will face affordability resistance.
Forward outlook
- Local home prices are declining (-3.0%/yr); year-one equity from $1k of loan paydown is wiped out by about $6k of value loss. Plan a longer hold.
- Clayton County population projected at +29% by 2050 — long-run rental-demand tailwind backs the buy-and-hold thesis.
Negotiation context
- It's been on market 198 days — a 12% lower offer ($167k) is reasonable based on typical stale-listing flexibility.
- 5 sale attempts since 13y ago; this cycle's ask has dropped $30k (14%) from the opening price — seller is motivated, your offer sets the floor, not the list.
Risks & watch-outs
- Climate carrying-cost: major wind risk, 27% chance of damaging wind over 30y; extreme-heat days projected 7→18/yr by 2055 (HVAC capex compounding) — expect insurance premiums to compound above CPI over the hold.
Questions for the listing agent
- It's been on market 198 days. Have you received any prior offers? Is the seller open to a 12% concession, seller financing, or rate buy-down credit?
- Why hasn't it sold? Are there any deal-killer items the seller is aware of (foundation, flood, title, zoning, code violations)?
- Is there a deadline driving the sale (1031 exchange, divorce, estate, relocation)? That informs how much negotiation room exists.
- Schools are F-rated, which usually means shorter tenancies and higher turnover. Who's the typical renter profile here, and what's been the actual vacancy rate?
- Crime grade is D in this area — have there been break-ins, vandalism, or insurance claims at this property in the last 3 years? What carrier currently insures it and at what premium?
- What's the average days-on-market for RENTAL listings here right now (not sales)? A rising rental-DOM trend means longer vacancies and softer asking-rent achievability than the comps imply.
- What's the recent tenant-quality profile in this submarket — average credit score on applications, eviction rate, late-payment / NSF rate, and stable-employment percentage? A property-management company in the area should have these aggregated.
- How much new for-sale + rental construction is in the pipeline within 1–3 miles? Heavy new supply typically softens prices + rents 12–24 months out; constrained supply supports both.
Investment metrics
- 1% rule
- 0.97% ✗
- Cap rate
- 6.95%
- Cash-on-cash
- 2.34%
- DSCR
- 1.10
- GRM
- 8.6
CMA / ARV
- ARV (median comp)
- $240,566
- List price
- $189,900
- Delta
- -21.06%
- Verdict
- UNDERPRICED
- Comps
- 20 within 1.0 mi
Show comp detail 12 sales within ~0.75 mi
| Address | Dist | Beds/Ba | Sqft | Sold | Price | $/sf | Match |
|---|---|---|---|---|---|---|---|
| 1362 Tara Rd | 0.06mi | 3/2.0 | 1,392 (+4%) | 2mo | $239,000 | $172 | 89 |
| 1352 Labelle St | 0.44mi | 3/2.0 | 1,360 (+2%) | 2mo | $195,000 | $143 | 74 |
| 10359 Briarbay Loop | 0.28mi | 3/2.0 | 1,284 (-4%) | 8mo | $150,000 | $117 | 74 |
| 10448 Tara Pointe Dr | 0.52mi | 3/2.0 | 1,341 (+0%) | 4mo | $225,000 | $168 | 72 |
| 1596 Bonanza Church Rd | 0.50mi | 3/2.0 | 1,380 (+3%) | 2mo | $155,000 | $112 | 70 |
| 1159 Bonita Way | 0.35mi | 3/2.0 | 1,260 (-6%) | 6mo | $225,000 | $179 | 69 |
| 1224 Bonita Cir | 0.30mi | 3/2.0 | 1,454 (+9%) | 5mo | $260,000 | $179 | 67 |
| 1101 Walnut Creek Ln | 0.59mi | 3/2.0 | 1,348 (+1%) | 7mo | $237,000 | $176 | 65 |
| 10223 Foxfire Ter | 0.44mi | 3/1.5 | 1,430 (+7%) | 1mo | $153,900 | $108 | 65 |
| 1485 Bola Ct | 0.52mi | 4/2.0 (+1) | 1,300 (-3%) | 6mo | $160,000 | $123 | 61 |
| 10119 Commons Way | 0.62mi | 3/2.0 | 1,468 (+10%) | 3mo | $246,000 | $168 | 52 |
| 1085 Commons Ct | 0.64mi | 3/2.0 | 1,501 (+12%) | 3mo | $250,000 | $167 | 47 |
Match score weights: distance 35% · size 25% · config 20% · recency 20%. Top-matched comps best support the ARV.
Projected returns pro-forma
-3.0% appreciation · 2.06% rent growth · sell at horizon
- IRR
- -13.6%
- Equity multiple
- 0.51×
- Total profit
- $-25,833
- Equity at exit
- $28,315
- IRR
- -6.3%
- Equity multiple
- 0.61×
- Total profit
- $-20,713
- Equity at exit
- $16,419
Cash invested: $53,172 (down + closing). Projections, not guarantees.
Landlord ↔ Tenant lean methodology
- Overall (STATE)
- 90 Strongly Landlord-Friendly
- State Georgia
- 90 Strongly Landlord-Friendly · R+3
- County
- — inherits STATE
- City
- — inherits STATE
ZIP-level market 30238
- Home prices YoY
- -33.3%
- Rents YoY
- 2.1%
- Active inventory
- 259
- Price-to-rent
- 8.6×
Monthly cashflow live
- Estimated rent
- $1,837 high interval (Pro) →
- Mortgage (P&I)
- −$996
- Tax from tax record
- −$272 /mo · $3,267/yr
- Insurance
- −$79
- HOA
- −$0
- Vacancy / Maint / Mgmt
- −$386
- Net cashflow
- $104
Break-even live
Sensitivity live
| Price | -10% $211 | -5% $158 | +0% $104 | +5% $50 | +10% $-4 |
|---|---|---|---|---|---|
| Rent | -10% $-41 | -5% $31 | +0% $104 | +5% $176 | +10% $249 |
| Rate | -1.0pp $199 | -0.5pp $152 | base $104 | +0.5pp $55 | +1.0pp $5 |
UW: 25.0% down · 7.5% · 30yr · 1.5% tax · 5.0% vac · 8.0% maint · 8.0% mgmt
Financing live
Cash to close
- Down payment
- $47,475
- Closing costs
- $5,697
- Reserves months
- —
- Total cash needed
- —
Loan-product check · same deal, 3 products live
Conventional
25% down · 7.5% · 30yr
- Down + closing
- —
- Monthly P&I
- —
- Monthly cashflow
- —
- DSCR
- —
- Eligible?
- —
Personal DTI + credit; lowest rate.
DSCR
20% down · 8.5% · 30yr
- Down + closing
- —
- Monthly P&I
- —
- Monthly cashflow
- —
- DSCR
- —
- Eligible?
- —
No personal income docs; deal must DSCR.
Hard money
10% down · 12.0% · 12mo
- Down + closing
- —
- Monthly P&I
- —
- Monthly cashflow
- —
- DSCR
- —
- Eligible?
- —
Short-term bridge; refi at stabilization.
Rent comps 40 comps
| Address | Beds | Baths | Sqft | Rent | $/sqft | DOM | Units | Dist |
|---|---|---|---|---|---|---|---|---|
| 10375 Larrack Trce Jonesboro, GA | 3.0 | 2.0 | 1340 | $1,800 | $1.34 | 19d | 1 | 0.09mi |
| 10357 Briarbay Dr Jonesboro, GA | 3.0 | 2.0 | 1180 | $1,610 | $1.36 | 3d | 1 | 0.18mi |
| 1277 Iron Gate Blvd Jonesboro, GA | 3.0 | 2.0 | 1120 | $1,499 | $1.34 | 3d | 1 | 0.19mi |
| 1277 Iron Gate Blvd Jonesboro, GA | 3.0 | 2.0 | 1120 | $1,499 | $1.34 | 0d | 1 | 0.19mi |
| 10473 Starling Trl Hampton, GA | 4.0 | 3.0 | 1835 | $2,367 | $1.29 | 26d | 1 | 0.21mi |
| 1260 Iron Gate Blvd Jonesboro, GA | 3.0 | 2.0 | 1460 | $1,740 | $1.19 | 0d | 1 | 0.24mi |
| 10507 Starling Trl Hampton, GA | 4.0 | 2.5 | 1800 | $2,131 | $1.18 | 45d | 1 | 0.24mi |
| 10485 Ace Ct Jonesboro, GA | 3.0 | 2.0 | 1288 | $1,611 | $1.25 | 45d | 1 | 0.24mi |
| 10346 Wisteria Ln Jonesboro, GA | 3.0 | 2.0 | 1042 | $1,595 | $1.53 | 14d | 1 | 0.27mi |
| 10299 Wisteria Ln Jonesboro, GA | 3.0 | 2.0 | 1257 | $1,770 | $1.41 | 45d | 1 | 0.28mi |
| 1442 Starling Ct Hampton, GA | 3.0 | 2.0 | 1668 | $1,885 | $1.13 | 45d | 1 | 0.28mi |
| 1276 Avery Dr Jonesboro, GA | 3.0 | 2.0 | 1811 | $1,755 | $0.97 | 7d | 1 | 0.34mi |
| 10564 Village Lndg Jonesboro, GA | 3.0 | 2.5 | 1617 | $1,800 | $1.11 | 26d | 1 | 0.38mi |
| 1834 Old Dogwood Jonesboro, GA | 3.0 | 2.5 | 1454 | $1,730 | $1.19 | 45d | 1 | 0.42mi |
| 1830 Old Dogwood Jonesboro, GA | 3.0 | 2.5 | 1454 | $1,730 | $1.19 | 45d | 1 | 0.42mi |
| 1478 Carriage Ln Jonesboro, GA | 3.0 | 2.0 | 1436 | $1,675 | $1.17 | 23d | 1 | 0.43mi |
| 1174 Walnut Creek Ln Jonesboro, GA | 3.0 | 2.0 | 1218 | $1,861 | $1.53 | 45d | 1 | 0.44mi |
| 1814 Old Dogwood Jonesboro, GA | 3.0 | 2.5 | 1454 | $1,730 | $1.19 | 45d | 1 | 0.45mi |
| 1108 Sunday Ln Jonesboro, GA | 3.0 | 2.0 | 1137 | $1,625 | $1.43 | 45d | 1 | 0.46mi |
| 1556 Wren Rd Jonesboro, GA | 3.0 | 2.0 | 1388 | $1,715 | $1.24 | 45d | 1 | 0.47mi |
| 1096 Bonita Cir Jonesboro, GA | 3.0 | 2.0 | 1442 | $1,700 | $1.18 | 26d | 1 | 0.48mi |
| 1798 Old Dogwood Jonesboro, GA | 3.0 | 3.0 | 1454 | $1,730 | $1.19 | 26d | 1 | 0.48mi |
| 1496 Paladin Ct Hampton, GA | 4.0 | 2.5 | 1116 | $2,045 | $1.83 | 21d | 1 | 0.49mi |
| 1795 Old Dogwood Jonesboro, GA | 3.0 | 3.0 | 1454 | $1,730 | $1.19 | 45d | 1 | 0.50mi |
| 1545 Iris Walk Jonesboro, GA | 3.0 | 3.0 | 1453 | $1,800 | $1.24 | 26d | 1 | 0.50mi |
| 1334 Labelle St Jonesboro, GA | 4.0 | 2.0 | 1352 | $1,521 | $1.12 | 7d | 1 | 0.50mi |
| 1786 Old Dogwood Jonesboro, GA | 3.0 | 2.5 | 1454 | $1,730 | $1.19 | 45d | 1 | 0.51mi |
| 1433 Iron Gate Blvd Jonesboro, GA | 3.0 | 1.5 | 1075 | $1,475 | $1.37 | 14d | 1 | 0.52mi |
| 1779 Old Dogwood Jonesboro, GA | 3.0 | 2.5 | 1454 | $1,730 | $1.19 | 45d | 1 | 0.52mi |
| 1117 Village Crk Jonesboro, GA | 3.0 | 2.5 | 1330 | $1,815 | $1.36 | 45d | 1 | 0.54mi |
| 1485 Bola Ct Jonesboro, GA | 4.0 | 2.0 | 1300 | $1,755 | $1.35 | 0d | 1 | 0.54mi |
| 1585 Iris Walk Jonesboro, GA | 3.0 | 2.5 | 1497 | $1,869 | $1.25 | 0d | 1 | 0.56mi |
| 1576 Iris Walk Jonesboro, GA | 3.0 | 2.5 | 1683 | $1,695 | $1.01 | 45d | 1 | 0.57mi |
| 1546 Plover Rd Jonesboro, GA | 4.0 | 3.0 | 1040 | $1,715 | $1.65 | 0d | 1 | 0.58mi |
| 10091 Silent Trl Jonesboro, GA | 3.0 | 1.5 | 1456 | $1,395 | $0.96 | 26d | 1 | 0.61mi |
| 1139 Commons Ct Jonesboro, GA | 3.0 | 2.0 | 1421 | $1,795 | $1.26 | 22d | 1 | 0.68mi |
| 1057 Misty Meadows Pt Hampton, GA | 3.0 | 2.0 | 1505 | $1,799 | $1.20 | 7d | 1 | 0.68mi |
| 10411 Tobano Trl Jonesboro, GA | 3.0 | 2.5 | 1659 | $1,875 | $1.13 | 45d | 1 | 0.74mi |
| 1374 Misty Ridge Ct Hampton, GA | 3.0 | 2.0 | 1250 | $1,775 | $1.42 | 45d | 1 | 0.75mi |
| 10624 Woodcock St Jonesboro, GA | 4.0 | 2.0 | 1171 | $1,670 | $1.43 | 23d | 1 | 0.77mi |
Listing history 28 events
-
2026-06-13statusdays on market $189,900 Under Contract 198 DOM
-
2026-06-09days on market $189,900 Active 194 DOM
-
2026-06-08days on market $189,900 Active 193 DOM
-
2026-06-07days on market $189,900 Active 192 DOM
-
2026-06-04days on market $189,900 Active 189 DOM
-
2026-06-03days on market $189,900 Active 188 DOM
-
2026-06-02days on market $189,900 Active 187 DOM
-
2026-06-01statusdays on market $189,900 Active 186 DOM
-
2026-05-31days on market $189,900 Price Change 185 DOM
-
2026-04-10price $194,900 239-char remark
Show marketing remark (239 chars)
This cozy 1336 sq ft ranch-style home sits offers a comfortable, single-story layout, featuring 3 bedrooms and 2 bathrooms with an open-concept living area and a well-appointed kitchen. Sit on the front covered porch for outdoor enjoyment.
-
2026-03-03price $199,900 239-char remark
Show marketing remark (239 chars)
This cozy 1336 sq ft ranch-style home sits offers a comfortable, single-story layout, featuring 3 bedrooms and 2 bathrooms with an open-concept living area and a well-appointed kitchen. Sit on the front covered porch for outdoor enjoyment.
-
2026-01-31status Back On Market 239-char remark
Show marketing remark (239 chars)
This cozy 1336 sq ft ranch-style home sits offers a comfortable, single-story layout, featuring 3 bedrooms and 2 bathrooms with an open-concept living area and a well-appointed kitchen. Sit on the front covered porch for outdoor enjoyment.
-
2026-01-16status Under Contract 239-char remark
Show marketing remark (239 chars)
This cozy 1336 sq ft ranch-style home sits offers a comfortable, single-story layout, featuring 3 bedrooms and 2 bathrooms with an open-concept living area and a well-appointed kitchen. Sit on the front covered porch for outdoor enjoyment.
-
2026-01-08price $209,900 239-char remark
Show marketing remark (239 chars)
This cozy 1336 sq ft ranch-style home sits offers a comfortable, single-story layout, featuring 3 bedrooms and 2 bathrooms with an open-concept living area and a well-appointed kitchen. Sit on the front covered porch for outdoor enjoyment.
-
2025-11-22price $214,900 239-char remark
Show marketing remark (239 chars)
This cozy 1336 sq ft ranch-style home sits offers a comfortable, single-story layout, featuring 3 bedrooms and 2 bathrooms with an open-concept living area and a well-appointed kitchen. Sit on the front covered porch for outdoor enjoyment.
-
2025-11-13$219,900 New 239-char remark
Show marketing remark (239 chars)
This cozy 1336 sq ft ranch-style home sits offers a comfortable, single-story layout, featuring 3 bedrooms and 2 bathrooms with an open-concept living area and a well-appointed kitchen. Sit on the front covered porch for outdoor enjoyment.
-
2022-02-16soldstatus $4,857,881
-
2017-07-31soldstatus $2,566,600
-
2016-11-01historical
-
2016-10-18price $77,000
-
2016-10-13price $109,200
-
2016-10-03status Back on Market
-
2016-10-01historical
-
2016-09-08$115,000 New
-
2014-05-01historical
-
2013-12-07price $85,859 Increased
-
2013-10-28$78,054 New
-
1991-05-16soldstatus $76,117
ⓘ Source: listings_history table (triggers on properties + properties_extension) + one-shot
backfill from property_details.listing_events for pre-trigger history.
Tax reassessment forecast GA · Resets to sale price
- Current annual tax
- $3,267 · $272/mo
- Projected year-2 tax
- $3,267 · $272/mo
- Expected delta
- $0/yr ($0/mo · 0.0%)
ⓘ Screening estimate from a state-policy table — verify with the county assessor before closing.
Climate risk First Street
- Flood 1/10 Low FEMA zone X (unshaded) · 0% chance over 30 yrs
- Wildfire 2/10 Low
- Heat 6/10 Major 7 d/yr ≥105°F today · 18 d/yr by 30 yrs out
- Wind 6/10 Major 27% chance of damaging wind over 30 yrs
- Air quality 4/10 Moderate 5 unhealthy d/yr today · 6 by 30 yrs out
Nearby sold comps map
Loading sold comps map…
Walkable amenities ~0.75 mi
Loading nearby amenities…
Taxation est. · year 1
- Rental income
- $22,041
- − Mortgage interest
- −$10,637
- − Property taxes
- −$3,267
- − Insurance
- −$950
- − Repairs & maintenance
- −$1,763
- − Management
- −$1,763
- − Depreciation
- −$5,524
- Taxable loss
- −$1,864
- Est. tax savings @ 24.0%
- +$447
- After-tax cash flow
- $1,693/yr
For passive investors: Depreciation is non-cash, so a rental often shows a tax loss while cash-flowing — sheltering income. Rental losses are passive: they offset passive income freely, and up to $25,000/yr can offset ordinary (W-2) income if you actively participate and your MAGI is under $100k (phasing out to $0 by $150k); unused losses carry forward. On sale, claimed depreciation is recaptured at up to 25%, and gains may owe capital-gains tax (a 1031 exchange can defer both). Figures are a year-1 estimate at your 24.0% rate — not tax advice; consult a CPA.
Schools (NCES district)
- District
- Clayton County
- NCES district ID
- 1301230
- Math proficiency
- 11% ▼ -13.00%
- Reading proficiency
- 20% ▼ -9.00%
- Median HH income
- $42,266
- Composite
- 13.41/100
- National rank
- #9527
- State rank
- #155 of 174 in GA
Livability — Irondale
- Score
- 57/100
- State rank
- #466
- US rank
- #22025
Category grades
Schools grade is shown separately in the Schools card above.
Census & demographics
- Census place
- Irondale, GA
- County
- Clayton County · 230,153 people
- Metro
- Atlanta-Sandy Springs-Alpharetta, GA
- Population (ZIP)
- 43,191
- Household income
- $62,185
- Rent vs Own
- Severe rent burden
- 1992.0
Population outlook (Clayton County) Hauer SSP2
- Today (2025)
- 310,777 people
- By 2030
- 329,762 · +6.1%
- By 2040
- 368,052 · +18.4%
- By 2050
- 401,196 · +29.1%
- By 2075
- 472,488 · +52.0%
- By 2100
- 500,446 · +61.0%
Race, ethnicity, and origin ACS 2023
- Neighborhood character
- Predominantly Black (71%)
- Race & ethnicity
- Black 71% Hispanic / Latino 17% White 7% Two or more races 7%
- Hispanic origin (detail)
- Mexican 13% Puerto Rican 2%
- Foreign-born
- 11% · Canada, United Kingdom
- Languages at home
- 83% English-only · Spanish 14% French/Haitian/Cajun 1%
Political lean MEDSL · Clayton
- 2024 margin
- Solid D (+69.2) · D 84.3% · R 15.1%
- 2008→2024 swing
- +2.8pp toward D · 2008: 66.4pp · 2024: 69.2pp
- All cycles
- 2024: D+69.2 2020: D+70.9 2016: D+71.9 2012: D+70.1 2008: D+66.4
Not yet ingested
- Civics
- —
Market trends
- HPI YoY
- ▼ -105.48%
- Current HPI
- 211.6309
- Rent YoY
- ▲ 2.06%
- Metro
- Atlanta-Sandy Springs-Alpharetta, GA
- State GDP YoY
- ▲ 2.66%
- F500 in state
- 28
Industry mix (Fortune 500 HQ in GA)
| Industry | F500 HQs | Revenue |
|---|---|---|
| Paper / Packaging | 2 | $29B |
|
||
| Retail | 1 | $160B |
|
||
| Transportation / Logistics | 1 | $91B |
|
||
| Airlines | 1 | $62B |
|
||
| Consumer Goods | 1 | $47B |
|
||
| Utilities | 1 | $25B |
|
||
Price history
+156.1% since first listed19 events — show timeline
- 2026-04-10 Price Changed $194,900 GAMLS
- 2026-03-03 Price Changed $199,900 GAMLS
- 2026-01-31 Relisted — GAMLS
- 2026-01-16 Pending — GAMLS
- 2026-01-08 Price Changed $209,900 GAMLS
- 2025-11-22 Price Changed $214,900 GAMLS
- 2025-11-13 Listed $219,900 GAMLS
- 2022-02-16 Sold (Public Records) $4,857,881 Public Records
- 2017-07-31 Sold (Public Records) $2,566,600 Public Records
- 2016-11-01 Listing Removed — GAMLS
- 2016-10-18 Price Changed $77,000 GAMLS
- 2016-10-13 Price Changed $109,200 GAMLS
- 2016-10-03 Relisted — GAMLS
- 2016-10-01 Listing Removed — GAMLS
- 2016-09-08 Listed $115,000 GAMLS
- 2014-05-01 Listing Removed — GAMLS
- 2013-12-07 Price Changed $85,859 GAMLS
- 2013-10-28 Listed $78,054 GAMLS
- 1991-05-16 Sold (Public Records) $76,117 Public Records
Property tax history
+7.8%/yrLatest (2025): $3,267 · -1.8% YoY. Source: county tax records.
Cash-flow waterfall
monthlySold comps — $/sqft
last 12 mo · ≤1 miLoading sold comps…