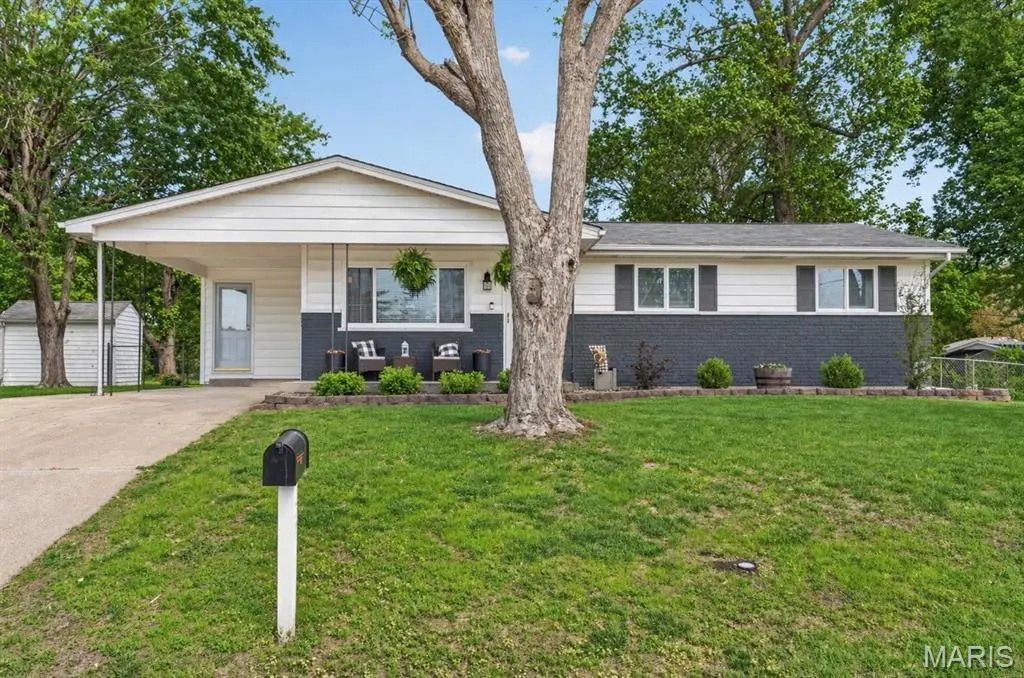
77 Ruth Dr · St. Charles, MO
Flood risk 1/10 · Minimal
- FEMA flood zone
- X (unshaded)
- Chance of flooding over 30 yrs
- 0.0%
- Est. flood insurance / yr
- $473 – $860
Fire risk 1/10 · Minimal
- Est. fire insurance / yr
- $1,054 – $1,958
Heat risk 5/10 · Moderate
- Hot days now (above 107°F)
- 7 days/yr
- Hot days in 30 yrs
- 20 days/yr
Wind risk 2/10 · Minimal
- Chance of severe wind over 30 yrs
- 1.0%
Air-quality risk 3/10 · Minor
- Unhealthy air days now
- 2 days/yr
- Unhealthy air days in 30 yrs
- 3 days/yr
Risk factors via First Street. Map © Google.
Why this score? — see what drove the F grade
The composite is a weighted blend of 9 inputs, each scored 0–100. Each bar is that input's sub-score; the figure is the points it added to the 100-point composite (weight × sub-score).
- ARV discount +7.4/15.0
- Cash flow +6.5/30.0
- Schools +4.1/10.0
- Rent growth +3.3/5.0
- Livability +2.5/5.0
- Condition / age +2.5/5.0
- 1% rule +1.1/10.0
- DSCR +0.8/10.0
- Appreciation +0.0/10.0
$265,000
🖨 Deal sheet (PDF) 📄 Offer letter ✓ Due diligence
Listing remarks
Welcome home to this charming ranch in the heart of Saint Charles. Enjoy an incredible outdoor setup featuring a large screened-in patio, covered porch and a level, fenced backyard—perfect for relaxing or entertaining. Inside, you’re greeted with hardwood floors and neutral paint in the spacious living room, complete with a large window. The kitchen features ample cabinetry, an electric range, and a window above the sink overlooking the backyard. The kitchen flows seamlessly into the breakfast room, which offers a built-in coffee bar, two pantry closets, and sliding glass doors leading to the screened-in patio. Retreat to the primary suite that offers its own private full bathro
Key facts
- 0.34 acre lot
- Parking
- Built 1960
Neighborhood map
What this means for you Summary
Snapshot
- This is a 3-bed/1.0-bath single-family listed at $265k.
Deal economics
- At list price, monthly cash flow is $-445 ($-5k/yr) — negative.
- To cash-flow at today's rent, offer at most $186k (29.7% below list).
- To meet the 1% rule (rent ≥ 1% of price), the offer needs to be $162k (38.7% below list).
- Recommended offer: $162k (38.7% below list) — sets the bar for 1% rule.
- Cap rate 4.3% vs local median 3.4% in St. Charles — meaningfully above typical; check what's discounted (condition, days-on-market, listing class) to confirm the premium yield is real.
Location & tenants
- Location reads: area grade F — affects rentability + tenant quality, not the cash-flow math above.
- St. Charles R-VI (urban): math 44% / reading 52% proficiency, ranked #51 of 324 in MO (top 16%) — families likely to look elsewhere, expect single-tenant / working-renter base with shorter leases.
- Zoned schools: Monroe Elem. (math 42% / reading 47%, grade F, #413 of 1,115 statewide, top 42%, 388 students, 53% FRL); St. Charles High (math 42% / reading 54%, grade D, #153 of 521 statewide, top 29%, 817 students, 43% FRL).
- Market conditions: Rents rising (+3.2%/yr); 301 active listings in the ZIP; 17 comparable units currently listed for rent nearby; rentals leasing fast (median 10d on market — plan ~1-2 weeks tenant-placement turnaround); solid renter incomes; 2,021 units permitted in St. Charles County in 2024 (568 in 5+ unit buildings).
Forward outlook
- Local home prices are declining (-3.0%/yr); year-one equity from $2k of loan paydown is wiped out by about $8k of value loss. Plan a longer hold.
- St. Charles County population projected at +22% by 2050 — long-run rental-demand tailwind backs the buy-and-hold thesis.
Negotiation context
- Only 2 days on market — expect competitive offers; lowballing is unlikely to land.
- Current owner paid $154k; list at $265k implies a 72% gain — meaningful room to come down on a strong offer.
Risks & watch-outs
- Climate carrying-cost: extreme-heat days projected 7→20/yr by 2055 (HVAC capex compounding) — expect insurance premiums to compound above CPI over the hold.
Questions for the listing agent
- What do current leases actually rent for vs. the listed asking? Can we see a recent rent roll and the last 12 months of T-12 income?
- Built in 1960 — when were the roof, HVAC, electrical panel, plumbing, and water heater last replaced?
- Is there a deadline driving the sale (1031 exchange, divorce, estate, relocation)? That informs how much negotiation room exists.
- The area grade is low — what's the realistic commute time and amenity access for the typical tenant pool here? Any planned neighborhood developments (good or bad) we should know about?
- What's the average days-on-market for RENTAL listings here right now (not sales)? A rising rental-DOM trend means longer vacancies and softer asking-rent achievability than the comps imply.
- What's the recent tenant-quality profile in this submarket — average credit score on applications, eviction rate, late-payment / NSF rate, and stable-employment percentage? A property-management company in the area should have these aggregated.
- How much new for-sale + rental construction is in the pipeline within 1–3 miles? Heavy new supply typically softens prices + rents 12–24 months out; constrained supply supports both.
Investment metrics
- 1% rule
- 0.61% ✗
- Cap rate
- 4.28%
- Cash-on-cash
- -7.20%
- DSCR
- 0.68
- GRM
- 13.6
CMA / ARV
- ARV (on-the-fly)
- $264,480
- Comps found
- 12
Show comp detail 12 sales within ~0.75 mi
| Address | Dist | Beds/Ba | Sqft | Sold | Price | $/sf | Match |
|---|---|---|---|---|---|---|---|
| 3129 Eddington Ln | 0.40mi | 3/2.0 | 1,128 (-3%) | 11mo | $290,000 | $257 | 64 |
| 3263 Janton Ln | 0.66mi | 3/1.0 | 1,258 (+8%) | 3mo | $259,000 | $206 | 52 |
| 48 Connie Dr | 0.11mi | 2/1.0 (-1) | 988 (-15%) | 18mo | $229,900 | $233 | 50 |
| 3205 Fleet Ln | 0.48mi | 3/2.0 | 1,050 (-10%) | 10mo | $299,900 | $286 | 49 |
| 2242 Bolton St | 0.62mi | 3/1.5 | 1,042 (-10%) | 5mo | $259,500 | $249 | 48 |
| 3124 Ainsworth Ct | 0.48mi | 3/2.0 | 1,215 (+5%) | 23mo | $276,000 | $227 | 46 |
| 3255 Janton Ln | 0.64mi | 3/1.0 | 1,248 (+8%) | 18mo | $224,000 | $179 | 43 |
| 2520 Bolton St | 0.41mi | 3/1.0 | 1,306 (+13%) | 22mo | $225,000 | $172 | 41 |
| 56 Judy Dr | 0.71mi | 3/1.0 | 1,334 (+15%) | 1mo | $157,000 | $118 | 41 |
| 1101 Olde Coventry Dr | 0.43mi | 4/2.0 (+1) | 1,304 (+12%) | 13mo | $289,900 | $222 | 39 |
| 97 Huck Finn Dr | 0.66mi | 3/2.0 | 999 (-14%) | 10mo | $235,000 | $235 | 34 |
| 827 Treadway Ave | 0.52mi | 3/2.0 | 1,318 (+14%) | 20mo | $299,900 | $228 | 32 |
Match score weights: distance 35% · size 25% · config 20% · recency 20%. Top-matched comps best support the ARV.
Projected returns pro-forma
-3.0% appreciation · 3.2% rent growth · sell at horizon
- IRR
- -28.7%
- Equity multiple
- 0.04×
- Total profit
- $-71,007
- Equity at exit
- $39,512
- IRR
- -27.6%
- Equity multiple
- -0.31×
- Total profit
- $-97,151
- Equity at exit
- $22,912
Cash invested: $74,200 (down + closing). Projections, not guarantees.
Landlord ↔ Tenant lean methodology
- Overall (STATE)
- 81 Strongly Landlord-Friendly
- State Missouri
- 81 Strongly Landlord-Friendly · R+10
- County
- — inherits STATE
- City
- — inherits STATE
ZIP-level market 63301
- Rents YoY
- 3.2%
- Active inventory
- 301
- Price-to-rent
- 13.6×
Monthly cashflow live
- Estimated rent
- $1,624 high interval (Pro) →
- Mortgage (P&I)
- −$1,390
- Tax from tax record
- −$228 /mo · $2,739/yr
- Insurance
- −$110
- HOA
- −$0
- Vacancy / Maint / Mgmt
- −$341
- Net cashflow
- $-445
Break-even live
Sensitivity live
| Price | -10% $-295 | -5% $-370 | +0% $-445 | +5% $-520 | +10% $-595 |
|---|---|---|---|---|---|
| Rent | -10% $-574 | -5% $-509 | +0% $-445 | +5% $-381 | +10% $-317 |
| Rate | -1.0pp $-312 | -0.5pp $-378 | base $-445 | +0.5pp $-514 | +1.0pp $-584 |
UW: 25.0% down · 7.5% · 30yr · 1.5% tax · 5.0% vac · 8.0% maint · 8.0% mgmt
Financing live
Cash to close
- Down payment
- $66,250
- Closing costs
- $7,950
- Reserves months
- —
- Total cash needed
- —
Loan-product check · same deal, 3 products live
Conventional
25% down · 7.5% · 30yr
- Down + closing
- —
- Monthly P&I
- —
- Monthly cashflow
- —
- DSCR
- —
- Eligible?
- —
Personal DTI + credit; lowest rate.
DSCR
20% down · 8.5% · 30yr
- Down + closing
- —
- Monthly P&I
- —
- Monthly cashflow
- —
- DSCR
- —
- Eligible?
- —
No personal income docs; deal must DSCR.
Hard money
10% down · 12.0% · 12mo
- Down + closing
- —
- Monthly P&I
- —
- Monthly cashflow
- —
- DSCR
- —
- Eligible?
- —
Short-term bridge; refi at stabilization.
Rent comps 17 comps
| Address | Beds | Baths | Sqft | Rent | $/sqft | DOM | Units | Dist |
|---|---|---|---|---|---|---|---|---|
| 920 Parkcrest Dr Unit 920 St Charles, MO | 2.0 | 1.5 | 1000 | $1,400 | $1.40 | 18d | 1 | 0.41mi |
| 26 Cedarbrook Dr Saint Charles, MO | 2.0 | 1.0 | 795 | $1,255 | $1.58 | 14d | 1 | 0.42mi |
| 3313 Droste Rd Unit 3313 St Charles, MO | 2.0 | 1.5 | 850 | $1,450 | $1.71 | 0d | 1 | 0.46mi |
| 1300 Sun Lake Dr St Charles, MO | 1.0–2.0 | 1.0–2.0 | 845 | $1,510 | $1.79 | 0d | 12 | 0.83mi |
| 10 San Miguel Dr St Charles, MO | 1.0–2.0 | 1.0–1.5 | 897 | $1,926 | $2.15 | 0d | 13 | 0.90mi |
| 2200 Lake Ct St Charles, MO | 1.0–2.0 | 1.0–2.0 | 860 | $1,749 | $2.03 | 0d | 15 | 0.93mi |
| 1464 Hawks Nest Dr Unit G St Charles, MO | 2.0 | 2.0 | 827 | $1,550 | $1.87 | 9d | 1 | 1.01mi |
| 1456 Hawks Nest Dr Unit G St Charles, MO | 2.0 | 2.0 | 827 | $1,300 | $1.57 | 45d | 1 | 1.04mi |
| 3545 Veterans Memorial Pkwy St Charles, MO | 1.0–3.0 | 1.0–2.0 | 877 | $1,687 | $1.92 | 0d | 21 | 1.07mi |
| 2415 Chesstal St St Charles, MO | 2.0 | 1.0 | 850 | $1,350 | $1.59 | 45d | 1 | 1.20mi |
| 2413 Chesstal St Saint Charles, MO | 2.0 | 1.0 | 850 | $1,350 | $1.59 | 45d | 1 | 1.20mi |
| 2483 Falcons Way Saint Charles, MO | 2.0 | 1.5 | 1050 | $1,400 | $1.33 | 45d | 1 | 1.22mi |
| 3049 Orton St Saint Charles, MO | 3.0 | 1.0 | 912 | $1,895 | $2.08 | 9d | 1 | 1.31mi |
| 3049 Orton St Saint Charles, MO | 3.0 | 1.0 | 912 | $1,895 | $2.08 | 16d | 1 | 1.31mi |
| 236 S Cadillac Dr Saint Charles, MO | 3.0 | 1.0 | 864 | $1,600 | $1.85 | 6d | 1 | 1.37mi |
| 2717 Greenleaf Dr Saint Charles, MO | 3.0 | 2.0 | 1189 | $2,329 | $1.96 | 0d | 1 | 1.38mi |
| 1517 Shadow Wood Dr Saint Charles, MO | 3.0 | 2.0 | 1064 | $2,250 | $2.11 | 13d | 1 | 1.42mi |
Listing history 4 events
-
2026-04-26status Pending
-
2026-04-23$265,000 Active
-
2026-04-18historical $265,000
-
2018-10-23soldstatus $154,200
ⓘ Source: listings_history table (triggers on properties + properties_extension) + one-shot
backfill from property_details.listing_events for pre-trigger history.
Tax reassessment forecast MO · Resets to sale price
- Current annual tax
- $2,739 · $228/mo
- Projected year-2 tax
- $2,739 · $228/mo
- Expected delta
- $0/yr ($0/mo · 0.0%)
ⓘ Screening estimate from a state-policy table — verify with the county assessor before closing.
Climate risk First Street
- Flood 1/10 Low FEMA zone X (unshaded) · 0% chance over 30 yrs
- Wildfire 1/10 Low
- Heat 5/10 Major 7 d/yr ≥107°F today · 20 d/yr by 30 yrs out
- Wind 2/10 Low 100% chance of damaging wind over 30 yrs
- Air quality 3/10 Moderate 2 unhealthy d/yr today · 3 by 30 yrs out
Nearby sold comps map
Loading sold comps map…
Walkable amenities ~0.75 mi
Loading nearby amenities…
Taxation est. · year 1
- Rental income
- $19,491
- − Mortgage interest
- −$14,844
- − Property taxes
- −$2,739
- − Insurance
- −$1,325
- − Repairs & maintenance
- −$1,559
- − Management
- −$1,559
- − Depreciation
- −$7,709
- Taxable loss
- −$10,245
- Est. tax savings @ 24.0%
- +$2,459
- After-tax cash flow
- $-2,884/yr
For passive investors: Depreciation is non-cash, so a rental often shows a tax loss while cash-flowing — sheltering income. Rental losses are passive: they offset passive income freely, and up to $25,000/yr can offset ordinary (W-2) income if you actively participate and your MAGI is under $100k (phasing out to $0 by $150k); unused losses carry forward. On sale, claimed depreciation is recaptured at up to 25%, and gains may owe capital-gains tax (a 1031 exchange can defer both). Figures are a year-1 estimate at your 24.0% rate — not tax advice; consult a CPA.
Schools (NCES district)
- District
- St. Charles R-VI
- NCES district ID
- 2928920
- Math proficiency
- 44% ▼ -4.00%
- Reading proficiency
- 52% ▼ -1.00%
- Median HH income
- $52,897
- Composite
- 41.38/100
- National rank
- #3486
- State rank
- #51 of 324 in MO
Livability — St. Charles
No livability data for this city. (Only ~50 U.S. cities are tracked.)
Census & demographics
- Census place
- St. Charles, MO
- County
- Saint Charles County · 399,703 people
- Metro
- St. Louis, MO-IL
- Population (ZIP)
- 52,667
- Household income
- $85,308
- Rent vs Own
- Severe rent burden
- 1118.0
Population outlook (St. Charles County) Hauer SSP2
- Today (2025)
- 437,857 people
- By 2030
- 461,707 · +5.4%
- By 2040
- 503,222 · +14.9%
- By 2050
- 534,684 · +22.1%
- By 2075
- 597,047 · +36.4%
- By 2100
- 609,682 · +39.2%
Race, ethnicity, and origin ACS 2023
- Neighborhood character
- Predominantly White (80%)
- Race & ethnicity
- White 80% Black 7% Two or more races 7% Hispanic / Latino 7% Asian 2%
- Hispanic origin (detail)
- Mexican 4%
- Common ancestry
- Lithuanian 3% Romanian 2% Italian 2%
- Foreign-born
- 5% · Canada, Guatemala
- Languages at home
- 93% English-only · Spanish 4%
Political lean MEDSL · St. Charles
- 2024 margin
- R (+17.0) · D 40.8% · R 57.8% · Other 1.4%
- 2008→2024 swing
- -7.2pp toward R · 2008: -9.7pp · 2024: -17.0pp
- All cycles
- 2024: R+17.0 2020: R+17.5 2016: R+26.4 2012: R+21.0 2008: R+9.7
Not yet ingested
- Civics
- —
Market trends
- HPI YoY
- ▼ -289.53%
- Current HPI
- 221.0637
- Rent YoY
- ▲ 3.20%
- Metro
- St. Louis, MO-IL
- State GDP YoY
- ▲ 1.84%
- F500 in state
- 20
Industry mix (Fortune 500 HQ in MO)
| Industry | F500 HQs | Revenue |
|---|---|---|
| Healthcare | 1 | $163B |
|
||
| Insurance | 1 | $21B |
|
||
| Industrial Technology | 1 | $17B |
|
||
| Retail | 1 | $16B |
|
||
| Industrial Distribution | 1 | $10B |
|
||
| Utilities | 1 | $9B |
|
||
Price history
+71.9% since first listed4 events — show timeline
- 2026-04-26 Pending — MARIS as Distributed by MLS Grid
- 2026-04-23 Listed $265,000 MARIS as Distributed by MLS Grid
- 2026-04-18 Coming Soon $265,000 MARIS as Distributed by MLS Grid
- 2018-10-23 Sold (Public Records) $154,200 Public Records
Property tax history
+3.1%/yrLatest (2025): $2,739 · +7.0% YoY. Source: county tax records.
Cash-flow waterfall
monthlySold comps — $/sqft
last 12 mo · ≤1 miLoading sold comps…