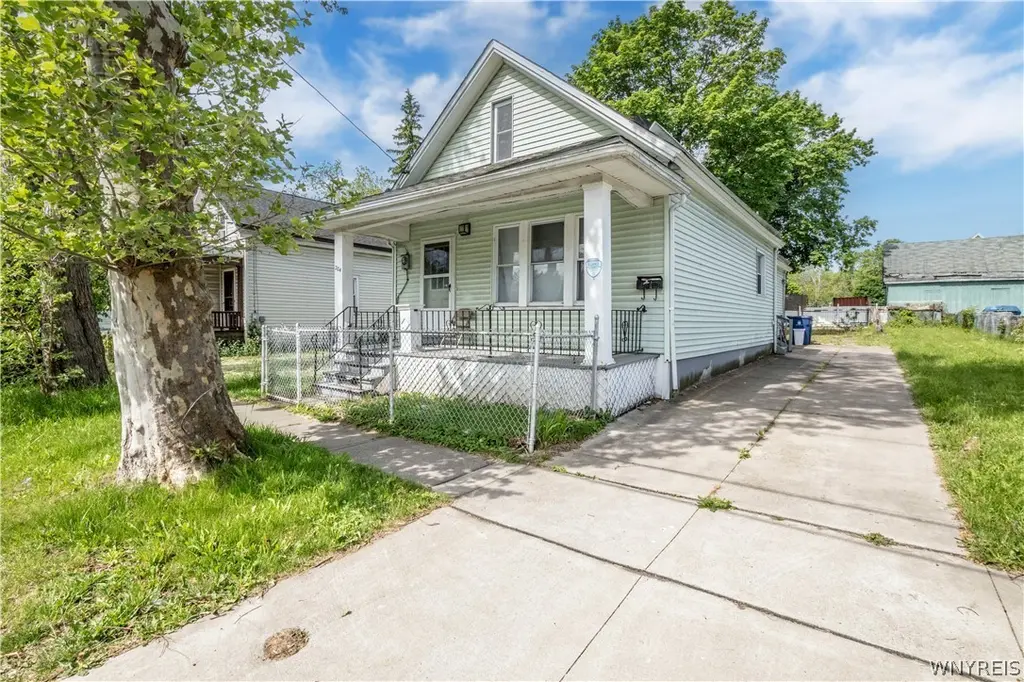
204 Herman St · Buffalo, NY
Flood risk 1/10 · Minimal
- FEMA flood zone
- X (unshaded)
- Chance of flooding over 30 yrs
- 0.0%
- Est. flood insurance / yr
- $473 – $860
Fire risk 1/10 · Minimal
- Est. fire insurance / yr
- $691 – $1,283
Heat risk 2/10 · Minimal
- Hot days now (above 92°F)
- 7 days/yr
- Hot days in 30 yrs
- 15 days/yr
Wind risk 1/10 · Minimal
- Chance of severe wind over 30 yrs
- —
Air-quality risk 3/10 · Minor
- Unhealthy air days now
- 2 days/yr
- Unhealthy air days in 30 yrs
- 3 days/yr
Risk factors via First Street. Map © Google.
Why this score? — see what drove the A- grade
The composite is a weighted blend of 9 inputs, each scored 0–100. Each bar is that input's sub-score; the figure is the points it added to the 100-point composite (weight × sub-score).
- Cash flow +30.0/30.0
- ARV discount +14.6/15.0
- 1% rule +10.0/10.0
- DSCR +10.0/10.0
- Appreciation +6.0/10.0
- Livability +3.9/5.0
- Schools +3.3/10.0
- Rent growth +2.5/5.0
- Condition / age +2.5/5.0
$120,000
🖨 Deal sheet 📄 Offer letter ✓ Due diligence
Listing remarks MLS
Nice single home, spacious for living or a ideal great investment opportunity. Spacious front porch area. Spacious living room and dining room area, updated kitchen, updated plumbing, newer furnace, newer windows. Two bedrooms in the lower level, along with one full bathroom. Quiet back yard area. Showings to begin on November 5, 2021, offers if any will be due on November 12, 2021 at 6:00 p. m.
Key facts
- Newer flooring
- Spacious backyard
- Large attic
Tags
Property features AI
Exterior
- Parking: No garage
- Utilities: Public water (connected); Sewer connected
- Home design: Single-story home; Resale property; Rectangular lot near public transit; 43 x 132 lot dimensions
- Construction: Vinyl siding; Block foundation; Existing structure
- Exterior features: Concrete driveway; Open porch
Interior
- Kitchen: Gas oven; Gas range
- Bedrooms: 2 main-level bedrooms
- Flooring: Vinyl; Varied flooring
- Bathrooms: 1 full bathroom (main level)
- Heating & cooling: Gas forced-air heating
- Interior features: Separate/formal dining room; Bedroom on main level; Partial basement
- Laundry & utility: Gas water heater
Neighborhood map
What this means for you Summary
Snapshot
- This is a 3-bed/1.0-bath single-family listed at $120k.
Deal economics
- At list price, monthly cash flow is $836 ($10k/yr) — positive.
- The deal already cash-flows at list — no discount required.
- Meets the 1% rule at list price ($2k rent vs $120k).
- Cap rate 14.6% vs local median 8.0% in Buffalo — top-decile yield for the area; either an underpriced asset or a hidden risk that comps aren't pricing in. Stress-test before assuming the spread holds.
Location & tenants
- Location reads 77/100 on livability (#195 in NY, #3,011 nationally) — a middle-class / working-renter tenant base. Strengths: commute A+, housing A+, health & safety A+; Watch: crime F, employment D-.
- Buffalo City School District (urban): math 41% / reading 40% proficiency, ranked #535 of 590 in NY (top 91%) — families likely to look elsewhere, expect single-tenant / working-renter base with shorter leases; 75% free/reduced lunch — lower-income household profile, screen leases tightly.
- Market conditions: 172 active listings in the ZIP; 21 comparable units currently listed for rent nearby; rentals at typical pace (median 15d on market — plan ~3-4 weeks tenant-placement turnaround); lower-income renter base — watch delinquency; 1,244 units permitted in Erie County in 2024 (563 in 5+ unit buildings).
- At $2,107/mo this rent would consume 70% of the median local household income ($36k/yr) (locally 1804% of renters already pay >50% of income on rent) — very limited rent-growth headroom before tenants either downsize or default.
Forward outlook
- In year one you build about $3k of equity ($830 loan paydown + $2k appreciation (2.0% local appreciation)).
- At projected returns (2.0% appreciation + 3.0% rent growth), your $34k cash investment doubles in ~3 years — after that, you're playing with house money.
- By year 10, paydown + projected appreciation supports a ~$32k cash-out refi (75% LTV) — recoverable capital for the next deal without selling this one.
Negotiation context
- Only 9 days on market — expect competitive offers; lowballing is unlikely to land.
- 3 sale attempts since 5y ago with the ask held roughly flat each time — persistent listings suggest the price (not the market) is what's stuck; bring a comps-based counter.
- Current owner paid $73k; list at $120k implies a 64% gain — meaningful room to come down on a strong offer.
Risks & watch-outs
- Watch-outs: built in 1890 — expect roof / HVAC / electrical / plumbing capex.
Questions for the listing agent
- Built in 1890 — when were the roof, HVAC, electrical panel, plumbing, and water heater last replaced?
- Is there a deadline driving the sale (1031 exchange, divorce, estate, relocation)? That informs how much negotiation room exists.
- Crime grade is F in this area — have there been break-ins, vandalism, or insurance claims at this property in the last 3 years? What carrier currently insures it and at what premium?
- What's the average days-on-market for RENTAL listings here right now (not sales)? A rising rental-DOM trend means longer vacancies and softer asking-rent achievability than the comps imply.
- What's the recent tenant-quality profile in this submarket — average credit score on applications, eviction rate, late-payment / NSF rate, and stable-employment percentage? A property-management company in the area should have these aggregated.
- How much new for-sale + rental construction is in the pipeline within 1–3 miles? Heavy new supply typically softens prices + rents 12–24 months out; constrained supply supports both.
Investment metrics
- 1% rule
- 1.76% ✓
- Cap rate
- 14.65%
- Cash-on-cash
- 29.84%
- DSCR
- 2.33
- GRM
- 4.7
CMA / ARV
- ARV (on-the-fly)
- $142,370
- Comps found
- 11
Show comp detail 11 sales within ~0.75 mi
| Address | Dist | Beds/Ba | Sqft | Sold | Price | $/sf | Match |
|---|---|---|---|---|---|---|---|
| 189 Reed St | 0.14mi | 4/1.0 (+1) | 1,261 (+2%) | 10mo | $145,000 | $115 | 78 |
| 513 High St | 0.29mi | 3/1.0 | 1,270 (+3%) | 7mo | $95,000 | $75 | 76 |
| 255 Reed St | 0.18mi | 4/1.0 (+1) | 1,294 (+4%) | 6mo | $125,000 | $97 | 74 |
| 598 High St | 0.20mi | 3/1.0 | 1,139 (-8%) | 7mo | $115,000 | $101 | 71 |
| 23 Guilford St | 0.34mi | 4/1.5 (+1) | 1,322 (+7%) | 1mo | $190,000 | $144 | 65 |
| 635 Jefferson Ave | 0.58mi | 3/1.5 | 1,330 (+7%) | 1mo | $220,000 | $165 | 57 |
| 162 Rose St | 0.55mi | 4/1.5 (+1) | 1,336 (+8%) | 11mo | $201,000 | $150 | 45 |
| 95 Peckham St | 0.74mi | 4/1.0 (+1) | 1,249 (+1%) | 18mo | $150,000 | $120 | 44 |
| 70 Camp St | 0.62mi | 3/1.5 | 1,324 (+7%) | 21mo | $245,000 | $185 | 40 |
| 18 Paderewski Dr | 0.56mi | 3/1.0 | 1,080 (-13%) | 17mo | $65,000 | $60 | 38 |
| 31 Walden Ave | 0.64mi | 4/2.0 (+1) | 1,420 (+15%) | 11mo | $31,000 | $22 | 28 |
Match score weights: distance 35% · size 25% · config 20% · recency 20%. Top-matched comps best support the ARV.
Projected returns pro-forma
2.05% appreciation · 3.0% rent growth · sell at horizon
- IRR
- 34.1%
- Equity multiple
- 2.84×
- Total profit
- $61,779
- Equity at exit
- $47,651
- IRR
- 35.2%
- Equity multiple
- 5.56×
- Total profit
- $153,075
- Equity at exit
- $68,864
Cash invested: $33,600 (down + closing). Projections, not guarantees.
Landlord ↔ Tenant lean methodology
- Overall (STATE)
- 15 Strongly Tenant-Friendly
- State New York
- 15 Strongly Tenant-Friendly · D+10
- County
- — inherits STATE
- City
- — inherits STATE
ZIP-level market 14211
- Home prices YoY
- 0.6%
- Active inventory
- 172
- Price-to-rent
- 4.7×
Monthly cashflow live
- Estimated rent
- $2,107 high interval (Pro) →
- Mortgage (P&I)
- −$629
- Tax est. 1.5%
- −$150 /mo · $1,800/yr
- Insurance
- −$50
- HOA
- −$0
- Vacancy / Maint / Mgmt
- −$443
- Net cashflow
- $836
Break-even live
UW: 25.0% down · 7.5% · 30yr · 1.5% tax · 5.0% vac · 8.0% maint · 8.0% mgmt
Financing live
Cash to close
- Down payment
- $30,000
- Closing costs
- $3,600
- Reserves months
- —
- Total cash needed
- —
Loan-product check · same deal, 3 products live
Conventional
25% down · 7.5% · 30yr
- Down + closing
- —
- Monthly P&I
- —
- Monthly cashflow
- —
- DSCR
- —
- Eligible?
- —
Personal DTI + credit; lowest rate.
DSCR
20% down · 8.5% · 30yr
- Down + closing
- —
- Monthly P&I
- —
- Monthly cashflow
- —
- DSCR
- —
- Eligible?
- —
No personal income docs; deal must DSCR.
Hard money
10% down · 12.0% · 12mo
- Down + closing
- —
- Monthly P&I
- —
- Monthly cashflow
- —
- DSCR
- —
- Eligible?
- —
Short-term bridge; refi at stabilization.
Rent comps 21 comps
| Address | Beds | Baths | Sqft | Rent | $/sqft | DOM | Units | Dist |
|---|---|---|---|---|---|---|---|---|
| 983 Michigan Ave Buffalo, NY | 2.0 | 1.0–2.0 | 804 | $3,202 | $3.98 | 2d | 58 | 0.92mi |
| 1145 Michigan Ave Buffalo, NY | 2.0 | 1.0–2.0 | 655 | $2,049 | $3.13 | 43d | 1 | 0.99mi |
| 408 Winslow Ave Unit 2 Buffalo, NY | 3.0 | 1.0 | 1000 | $1,050 | $1.05 | 14d | 1 | 1.12mi |
| 1155 Main St Buffalo, NY | 2.0 | 1.0–2.0 | 592 | $2,300 | $3.88 | 43d | 1 | 1.25mi |
| 184 Butler Ave Unit 1545840P Buffalo, NY | 4.0 | 1.0 | 1496 | $3,226 | $2.16 | 14d | 1 | 1.27mi |
| 628 Ellicott St Buffalo, NY | 1.0–2.0 | 1.0–2.0 | 1059 | $2,812 | $2.65 | 2d | 5 | 1.28mi |
| 104 Butler Ave Buffalo, NY | 3.0 | 1.0 | 1000 | $1,400 | $1.40 | 43d | 1 | 1.28mi |
| 1152 Main St Apt 3 Buffalo, NY | 3.0 | 1.0 | 1000 | $2,400 | $2.40 | 14d | 1 | 1.29mi |
| 19 North St Buffalo, NY | 2.0 | 1.0–2.0 | 1306 | $2,910 | $2.23 | 10d | 7 | 1.30mi |
| 40 North St Unit 306 Buffalo, NY | 2.0 | 1.5 | 1125 | $1,950 | $1.73 | 43d | 1 | 1.33mi |
| 489 Ellicott St Unit 36 Buffalo, NY | 2.0 | 2.0 | 1000 | $1,550 | $1.55 | 2d | 1 | 1.33mi |
| 76 Chester St Unit 1 Buffalo, NY | 3.0 | 1.0 | 1100 | $1,000 | $0.91 | 14d | 1 | 1.34mi |
| 17 N Pearl St Buffalo, NY | 2.0 | 2.0 | 1077 | $2,700 | $2.51 | 23d | 1 | 1.35mi |
| 17 N Pearl St Unit 3 Buffalo, NY | 3.0 | 2.0 | 1197 | $3,100 | $2.59 | 23d | 1 | 1.35mi |
| 44 N Pearl St #5 Buffalo, NY | 3.0 | 1.0 | 1200 | $2,400 | $2.00 | 43d | 1 | 1.36mi |
| 19 E Utica St Unit 203 Buffalo, NY | 2.0 | 1.0 | 850 | $1,300 | $1.53 | 14d | 1 | 1.37mi |
| 519 Virginia St Buffalo, NY | 1.0–2.0 | 1.0–2.0 | 700 | $1,700 | $2.43 | 3d | 3 | 1.39mi |
| 130 Linwood Ave Buffalo, NY | 2.0 | 1.0 | 900 | $1,900 | $2.11 | 23d | 1 | 1.39mi |
| 179 Donaldson Rd Buffalo, NY | 3.0 | 1.0 | 1152 | $1,350 | $1.17 | 3d | 1 | 1.43mi |
| 140 Seymour St Buffalo, NY | 2.0 | 1.0 | 1300 | $1,800 | $1.38 | 23d | 1 | 1.46mi |
| 140 Seymour St Unit First Floor Buffalo, NY | 2.0 | 1.0 | 1300 | $1,800 | $1.38 | 3d | 1 | 1.46mi |
Listing history 8 events
-
2026-06-18days on market $120,000 Active 9 DOM
-
2026-06-17days on market $120,000 Active 8 DOM
-
2026-06-16days on market $120,000 Active 7 DOM
-
2026-06-15days on market $120,000 Active 6 DOM
-
2026-06-13days on market $120,000 Active 4 DOM
-
2026-06-13days on market $120,000 Active 3 DOM
-
2026-06-10remarks 522-char remark
-
2026-06-10$120,000 Active 1 DOM
ⓘ Source: listings_history table (triggers on properties + properties_extension) + one-shot
backfill from property_details.listing_events for pre-trigger history.
Climate risk First Street
- Flood 1/10 Low FEMA zone X (unshaded) · 0% chance over 30 yrs
- Wildfire 1/10 Low
- Heat 2/10 Low 7 d/yr ≥92°F today · 15 d/yr by 30 yrs out
- Wind 1/10 Low
- Air quality 3/10 Moderate 2 unhealthy d/yr today · 3 by 30 yrs out
Nearby sold comps map
Loading sold comps map…
Walkable amenities ~0.75 mi
Loading nearby amenities…
Taxation est. · year 1
- Rental income
- $25,290
- − Mortgage interest
- −$6,722
- − Property taxes
- −$1,800
- − Insurance
- −$600
- − Repairs & maintenance
- −$2,023
- − Management
- −$2,023
- − Depreciation
- −$3,491
- Taxable income
- $8,630
- Est. tax owed @ 24.0%
- −$2,071
- After-tax cash flow
- $7,956/yr
For passive investors: Depreciation is non-cash, so a rental often shows a tax loss while cash-flowing — sheltering income. Rental losses are passive: they offset passive income freely, and up to $25,000/yr can offset ordinary (W-2) income if you actively participate and your MAGI is under $100k (phasing out to $0 by $150k); unused losses carry forward. On sale, claimed depreciation is recaptured at up to 25%, and gains may owe capital-gains tax (a 1031 exchange can defer both). Figures are a year-1 estimate at your 24.0% rate — not tax advice; consult a CPA.
Schools (NCES district)
- District
- Buffalo City School District
- NCES district ID
- 3605850
- Math proficiency
- 41% ▲ 11.00%
- Reading proficiency
- 40% ▲ 7.00%
- Median HH income
- $31,665
- Composite
- 33.17/100
- National rank
- #5544
- State rank
- #535 of 590 in NY
Livability — Buffalo
- Score
- 77/100
- State rank
- #195
- US rank
- #3011
Category grades
Schools grade is shown separately in the Schools card above.
Census & demographics
- Census place
- Buffalo, NY
- County
- Erie County · 714,559 people
- City population
- 440,021
- Metro
- Buffalo-Cheektowaga, NY
- Population (ZIP)
- 24,663
- Household income
- $36,300
- Rent vs Own
- Severe rent burden
- 1804.0
Population outlook (Erie County) Hauer SSP2
- Today (2025)
- 933,037 people
- By 2030
- 935,181 · +0.2%
- By 2040
- 928,531 · -0.5%
- By 2050
- 905,725 · -2.9%
- By 2075
- 834,037 · -10.6%
- By 2100
- 708,033 · -24.1%
Race, ethnicity, and origin ACS 2023
- Neighborhood character
- Diverse neighborhood (Simpson 0.60)
- Race & ethnicity
- Black 59% Asian 20% Hispanic / Latino 9% White 9% Two or more races 5%
- Hispanic origin (detail)
- Puerto Rican 6%
- Common ancestry
- Romanian 4%
- Foreign-born
- 17% · Canada, Philippines, Vietnam
- Languages at home
- 74% English-only · Other Indo-European 14% Spanish 6% Other Asian/Pacific 1%
Political lean MEDSL · Erie
- 2024 margin
- Lean D (+9.7) · D 54.8% · R 45.2%
- 2008→2024 swing
- -7.9pp toward R · 2008: 17.5pp · 2024: 9.7pp
- All cycles
- 2024: D+9.7 2020: D+14.7 2016: D+4.8 2012: D+15.6 2008: D+17.5
Not yet ingested
- Civics
- —
Market trends
- HPI YoY
- ▲ 2.05%
- Current HPI
- 357.6438
- Rent YoY
- —
- Metro
- Buffalo-Cheektowaga, NY
- State GDP YoY
- ▲ 2.60%
- F500 in state
- 92
Industry mix (Fortune 500 HQ in NY)
| Industry | F500 HQs | Revenue |
|---|---|---|
| Financial Services | 10 | $950B |
|
||
| Consumer Goods | 9 | $162B |
|
||
| Insurance | 4 | $225B |
|
||
| Telecommunications | 2 | $144B |
|
||
| Pharmaceuticals | 2 | $112B |
|
||
| Media / Entertainment | 2 | $69B |
|
||
Price history
+41.2% since first listed6 events — show timeline
- 2026-06-09 Listed $120,000 WNYREIS
- 2025-12-24 Listing Removed — WNYREIS
- 2025-08-24 Listed $119,900 WNYREIS
- 2022-03-09 Sold (MLS) $73,000 WNYREIS
- 2021-11-19 Pending — WNYREIS
- 2021-11-05 Listed $85,000 WNYREIS
Property tax history
+14.6%/yrLatest (2025): $225 · +60.3% YoY. Source: county tax records.
Cash-flow waterfall
monthlySold comps — $/sqft
last 12 mo · ≤1 miLoading sold comps…