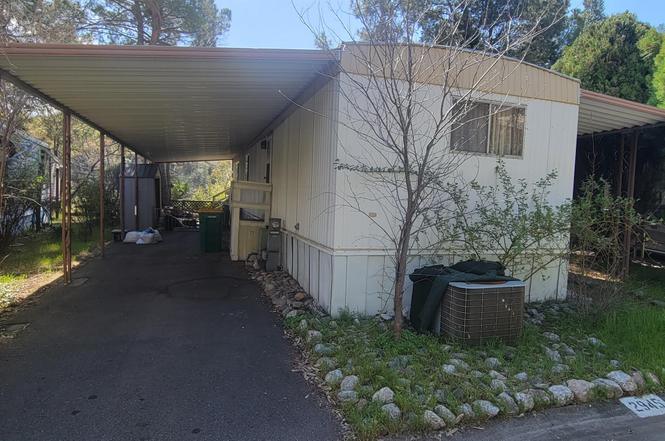
2945 Glenwood Ln · Placerville, CA
Flood risk 1/10 · Minimal
- FEMA flood zone
- X (unshaded)
- Chance of flooding over 30 yrs
- 0.0%
- Est. flood insurance / yr
- $507 – $1,088
Fire risk 9/10 · Severe
- Est. fire insurance / yr
- $659 – $1,223
Heat risk 6/10 · Moderate
- Hot days now (above 99°F)
- 7 days/yr
- Hot days in 30 yrs
- 16 days/yr
Wind risk 1/10 · Minimal
- Chance of severe wind over 30 yrs
- —
Air-quality risk 10/10 · Severe
- Unhealthy air days now
- 31 days/yr
- Unhealthy air days in 30 yrs
- 38 days/yr
Risk factors via First Street. Map © Google.
Why this score? — see what drove the B grade
The composite is a weighted blend of 9 inputs, each scored 0–100. Each bar is that input's sub-score; the figure is the points it added to the 100-point composite (weight × sub-score).
- Cash flow +30.0/30.0
- 1% rule +10.0/10.0
- DSCR +10.0/10.0
- ARV discount +7.5/15.0
- Rent growth +5.0/5.0
- Schools +3.3/10.0
- Livability +3.1/5.0
- Condition / age +2.5/5.0
- Appreciation +0.0/10.0
$49,750
🖨 Deal sheet (PDF) 📄 Offer letter ✓ Due diligence
Listing remarks
Single-wide 1BR/1BA mobilehome for sale in the immaculate Hidden Springs Villa senior community! Facilities include a recreational hall, game room, pool and spa for residents to enjoy. Located in the City of Placerville with close access to Highway 50.
Key facts
- Recreational hall
- Pool and spa
- Game room
Tags
Property features AI
Finance
- HOA & community: Pets allowed (cats and dogs OK; number and size limits; upon approval); Community amenities managed by park
Exterior
- Parking: Carport with awning; Covered tandem carport for 2 or more vehicles; No garage
- Utilities: Central air; Wall furnace heating; Electric meter; Gas meter; Community water/sewer (typical for park)
- Home design: Manufactured in-park home; Single-wide mobile home; Model: Hillcrest; One-story
- Construction: 624 total living area (manufactured home)
- Exterior features: Community in-ground pool; Heated spa; Clubhouse; Fitness center; Pool and spa; Game room; Guest parking; Laundry in community; Cable TV available; Electric metered; Gas metered; Park interview required; Senior community
Interior
- Kitchen: Dishwasher; Double oven; Refrigerator; Disposal; Laminate counters
- Bedrooms: 1 bedroom
- Flooring: Carpet
- Bathrooms: 1 full bathroom with tub
- Heating & cooling: Wall furnace heating; Central air conditioning
- Interior features: Washer/dryer stacked included; Laundry facility on main entry level; Main entry present; Carpet flooring
- Laundry & utility: Stacked washer and dryer included
Neighborhood map
What this means for you Summary
Snapshot
- This is a 1-bed/1.0-bath manufactured listed at $50k.
Deal economics
- At list price, monthly cash flow is $879 ($11k/yr) — positive.
- The deal already cash-flows at list — no discount required.
- Meets the 1% rule at list price ($2k rent vs $50k).
- Recommended offer: $44k (12.0% below list) — sets the bar for market timing.
- Cap rate 27.5% vs local median 2.8% in Placerville — top-decile yield for the area; either an underpriced asset or a hidden risk that comps aren't pricing in. Stress-test before assuming the spread holds.
Location & tenants
- Location reads 61/100 on livability (#553 in CA) — a middle-class / working-renter tenant base. Strengths: housing B+; Watch: schools D+, amenities D, crime F.
- Placerville Union Elementary (town): math 29% / reading 46% proficiency, ranked #248 of 517 in CA (top 48%) — families likely to look elsewhere, expect single-tenant / working-renter base with shorter leases.
- Market conditions: Rents rising fast (+12.5%/yr); 352 active listings in the ZIP; 1 comparable units currently listed for rent nearby; solid renter incomes; 437 units permitted in El Dorado County in 2024 (0 in 5+ unit buildings).
Forward outlook
- Local home prices are declining (-3.0%/yr); year-one equity from $344 of loan paydown is wiped out by about $1k of value loss. Plan a longer hold.
- El Dorado County population projected to shrink 3% by 2050 — rents likely to lag national; underwrite the cash flow, not the appreciation.
- At projected returns (-3.0% appreciation + 8.0% rent growth), your $14k cash investment doubles in ~2 years — after that, you're playing with house money.
Negotiation context
- It's been on market 768 days — a 12% lower offer ($44k) is reasonable based on typical stale-listing flexibility.
Risks & watch-outs
- Climate carrying-cost: severe wildfire risk; extreme-heat days projected 7→16/yr by 2055 (HVAC capex compounding) — expect insurance premiums to compound above CPI over the hold.
Questions for the listing agent
- It's been on market 768 days. Have you received any prior offers? Is the seller open to a 12% concession, seller financing, or rate buy-down credit?
- Why hasn't it sold? Are there any deal-killer items the seller is aware of (foundation, flood, title, zoning, code violations)?
- Is there a deadline driving the sale (1031 exchange, divorce, estate, relocation)? That informs how much negotiation room exists.
- Schools are D-rated, which usually means shorter tenancies and higher turnover. Who's the typical renter profile here, and what's been the actual vacancy rate?
- Crime grade is F in this area — have there been break-ins, vandalism, or insurance claims at this property in the last 3 years? What carrier currently insures it and at what premium?
- What's the average days-on-market for RENTAL listings here right now (not sales)? A rising rental-DOM trend means longer vacancies and softer asking-rent achievability than the comps imply.
- What's the recent tenant-quality profile in this submarket — average credit score on applications, eviction rate, late-payment / NSF rate, and stable-employment percentage? A property-management company in the area should have these aggregated.
- How much new for-sale + rental construction is in the pipeline within 1–3 miles? Heavy new supply typically softens prices + rents 12–24 months out; constrained supply supports both.
Investment metrics
- 1% rule
- 3.11% ✓
- Cap rate
- 27.49%
- Cash-on-cash
- 75.70%
- DSCR
- 4.37
- GRM
- 2.7
CMA / ARV
No comps found within radius.
Projected returns pro-forma
-3.0% appreciation · 8.0% rent growth · sell at horizon
- IRR
- 81.2%
- Equity multiple
- 5.03×
- Total profit
- $56,111
- Equity at exit
- $7,418
- IRR
- 85.9%
- Equity multiple
- 12.36×
- Total profit
- $158,250
- Equity at exit
- $4,301
Cash invested: $13,930 (down + closing). Projections, not guarantees.
Landlord ↔ Tenant lean methodology
- Overall (STATE)
- 18 Strongly Tenant-Friendly
- State California
- 18 Strongly Tenant-Friendly · D+13
- County
- — inherits STATE
- City
- — inherits STATE
ZIP-level market 95667
- Rents YoY
- 12.5%
- Active inventory
- 352
- Price-to-rent
- 2.7×
Monthly cashflow live
- Estimated rent
- $1,548 medium interval (Pro) →
- Mortgage (P&I)
- −$261
- Tax est. 1.5%
- −$62 /mo · $746/yr
- Insurance
- −$21
- HOA
- −$0
- Vacancy / Maint / Mgmt
- −$325
- Net cashflow
- $879
Break-even live
Sensitivity live
| Price | -10% $913 | -5% $896 | +0% $879 | +5% $862 | +10% $844 |
|---|---|---|---|---|---|
| Rent | -10% $757 | -5% $818 | +0% $879 | +5% $940 | +10% $1,001 |
| Rate | -1.0pp $904 | -0.5pp $891 | base $879 | +0.5pp $866 | +1.0pp $853 |
UW: 25.0% down · 7.5% · 30yr · 1.5% tax · 5.0% vac · 8.0% maint · 8.0% mgmt
Financing live
Cash to close
- Down payment
- $12,438
- Closing costs
- $1,492
- Reserves months
- —
- Total cash needed
- —
Loan-product check · same deal, 3 products live
Conventional
25% down · 7.5% · 30yr
- Down + closing
- —
- Monthly P&I
- —
- Monthly cashflow
- —
- DSCR
- —
- Eligible?
- —
Personal DTI + credit; lowest rate.
DSCR
20% down · 8.5% · 30yr
- Down + closing
- —
- Monthly P&I
- —
- Monthly cashflow
- —
- DSCR
- —
- Eligible?
- —
No personal income docs; deal must DSCR.
Hard money
10% down · 12.0% · 12mo
- Down + closing
- —
- Monthly P&I
- —
- Monthly cashflow
- —
- DSCR
- —
- Eligible?
- —
Short-term bridge; refi at stabilization.
Rent comps 1 comps
| Address | Beds | Baths | Sqft | Rent | $/sqft | DOM | Units | Dist |
|---|---|---|---|---|---|---|---|---|
| 2760 Coloma St Apt 3 Placerville, CA | 2.0 | 1.0 | 725 | $1,700 | $2.34 | 2d | 1 | 1.29mi |
Listing history 18 events
-
2026-06-21days on market $49,750 Active 768 DOM
-
2026-06-18days on market $49,750 Active 765 DOM
-
2026-06-17days on market $49,750 Active 764 DOM
-
2026-06-16days on market $49,750 Active 763 DOM
-
2026-06-15days on market $49,750 Active 762 DOM
-
2026-06-13days on market $49,750 Active 760 DOM
-
2026-06-09days on market $49,750 Active 756 DOM
-
2026-06-08days on market $49,750 Active 755 DOM
-
2026-06-07days on market $49,750 Active 754 DOM
-
2026-06-05days on market $49,750 Active 751 DOM
-
2026-06-03days on market $49,750 Active 750 DOM
-
2026-06-02days on market $49,750 Active 749 DOM
-
2026-06-01days on market $49,750 Active 748 DOM
-
2026-05-31days on market $49,750 Active 747 DOM
-
2025-08-26price $49,750
-
2025-01-28price $55,000
-
2024-10-05price $59,500
-
2024-05-14$69,500 Active
ⓘ Source: listings_history table (triggers on properties + properties_extension) + one-shot
backfill from property_details.listing_events for pre-trigger history.
Climate risk First Street
- Flood 1/10 Low FEMA zone X (unshaded) · 0% chance over 30 yrs
- Wildfire 9/10 Extreme
- Heat 6/10 Major 7 d/yr ≥99°F today · 16 d/yr by 30 yrs out
- Wind 1/10 Low
- Air quality 10/10 Extreme 31 unhealthy d/yr today · 38 by 30 yrs out
Nearby sold comps map
Loading sold comps map…
Walkable amenities ~0.75 mi
Loading nearby amenities…
Taxation est. · year 1
- Rental income
- $18,571
- − Mortgage interest
- −$2,787
- − Property taxes
- −$746
- − Insurance
- −$249
- − Repairs & maintenance
- −$1,486
- − Management
- −$1,486
- − Depreciation
- −$1,447
- Taxable income
- $10,371
- Est. tax owed @ 24.0%
- −$2,489
- After-tax cash flow
- $8,056/yr
For passive investors: Depreciation is non-cash, so a rental often shows a tax loss while cash-flowing — sheltering income. Rental losses are passive: they offset passive income freely, and up to $25,000/yr can offset ordinary (W-2) income if you actively participate and your MAGI is under $100k (phasing out to $0 by $150k); unused losses carry forward. On sale, claimed depreciation is recaptured at up to 25%, and gains may owe capital-gains tax (a 1031 exchange can defer both). Figures are a year-1 estimate at your 24.0% rate — not tax advice; consult a CPA.
Schools (NCES district)
- District
- Placerville Union Elementary
- NCES district ID
- 0630780
- Math proficiency
- 29% ▼ -16.00%
- Reading proficiency
- 46% ▼ -11.00%
- Median HH income
- $54,662
- Composite
- 32.8/100
- National rank
- #5626
- State rank
- #248 of 517 in CA
Livability — Placerville
- Score
- 61/100
- State rank
- #553
- US rank
- #18366
Category grades
Schools grade is shown separately in the Schools card above.
Census & demographics
- Census place
- Placerville, CA
- County
- El Dorado County · 144,198 people
- City population
- 36,830
- Metro
- Sacramento-Roseville-Folsom, CA
- Population (ZIP)
- 36,830
- Household income
- $89,938
- Rent vs Own
- Severe rent burden
- 1147.0
Population outlook (El Dorado County) Hauer SSP2
- Today (2025)
- 191,666 people
- By 2030
- 193,662 · +1.0%
- By 2040
- 192,583 · +0.5%
- By 2050
- 185,904 · -3.0%
- By 2075
- 169,543 · -11.5%
- By 2100
- 139,623 · -27.2%
Race, ethnicity, and origin ACS 2023
- Neighborhood character
- Predominantly White (78%)
- Race & ethnicity
- White 78% Hispanic / Latino 14% Two or more races 8% Native American 1%
- Hispanic origin (detail)
- Mexican 11%
- Common ancestry
- Italian 4% Slovak 4% Lithuanian 3%
- Foreign-born
- 6% · Canada, China
- Languages at home
- 92% English-only · Spanish 6%
Political lean MEDSL · El Dorado
- 2024 margin
- R (+12.0) · D 42.6% · R 54.6% · Other 2.8%
- 2008→2024 swing
- -1.5pp toward R · 2008: -10.5pp · 2024: -12.0pp
- All cycles
- 2024: R+12.0 2020: R+8.8 2016: R+13.9 2012: R+18.2 2008: R+10.5
Not yet ingested
- Civics
- —
Market trends
- HPI YoY
- ▼ -480.50%
- Current HPI
- 262.6014
- Rent YoY
- ▲ 12.48%
- Metro
- Sacramento-Roseville-Folsom, CA
- State GDP YoY
- ▲ 3.21%
- F500 in state
- 116
Industry mix (Fortune 500 HQ in CA)
| Industry | F500 HQs | Revenue |
|---|---|---|
| Technology | 27 | $1,492B |
|
||
| Financial Services | 3 | $174B |
|
||
| Retail | 3 | $44B |
|
||
| Insurance | 3 | $26B |
|
||
| Media / Entertainment | 2 | $115B |
|
||
| Pharmaceuticals / Biotech | 2 | $62B |
|
||
Price history
-28.4% since first listed4 events — show timeline
- 2025-08-26 Price Changed $49,750 bridgeMLS, Bay East AOR, or Contra Costa AOR
- 2025-01-28 Price Changed $55,000 bridgeMLS, Bay East AOR, or Contra Costa AOR
- 2024-10-05 Price Changed $59,500 bridgeMLS, Bay East AOR, or Contra Costa AOR
- 2024-05-14 Listed $69,500 bridgeMLS, Bay East AOR, or Contra Costa AOR
Cash-flow waterfall
monthlySold comps — $/sqft
last 12 mo · ≤1 miLoading sold comps…