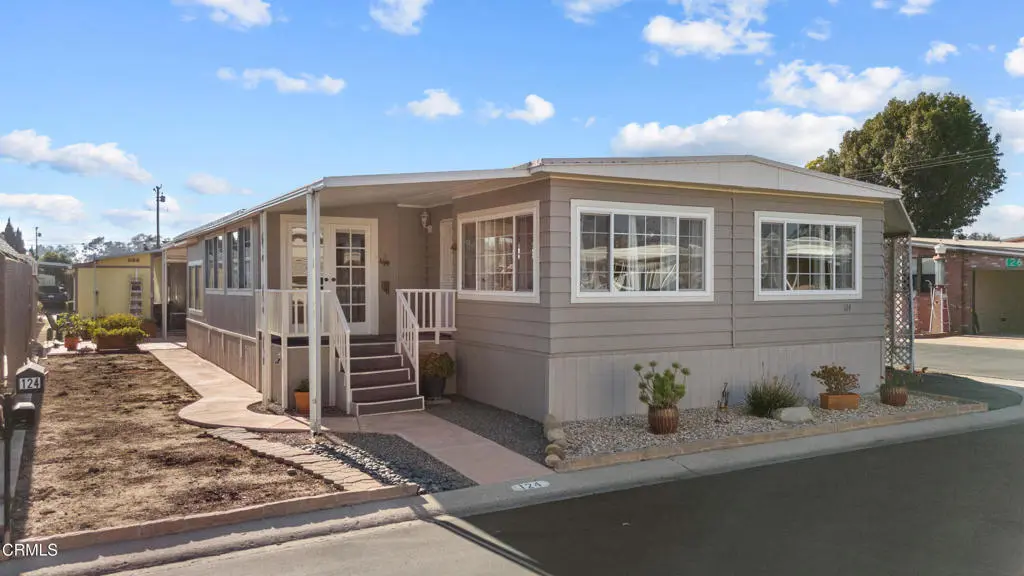
500 West Santa Maria St #124 · Santa Paula, CA
Flood risk 4/10 · Minor
- FEMA flood zone
- X (unshaded)
- Chance of flooding over 30 yrs
- 0.24%
- Est. flood insurance / yr
- $507 – $1,088
Fire risk 5/10 · Moderate
- Est. fire insurance / yr
- $659 – $1,223
Heat risk 5/10 · Moderate
- Hot days now (above 95°F)
- 7 days/yr
- Hot days in 30 yrs
- 17 days/yr
Wind risk 1/10 · Minimal
- Chance of severe wind over 30 yrs
- —
Air-quality risk 7/10 · Major
- Unhealthy air days now
- 12 days/yr
- Unhealthy air days in 30 yrs
- 12 days/yr
Risk factors via First Street. Map © Google.
Why this score? — see what drove the D- grade
The composite is a weighted blend of 9 inputs, each scored 0–100. Each bar is that input's sub-score; the figure is the points it added to the 100-point composite (weight × sub-score).
- Cash flow +18.0/30.0
- DSCR +5.6/10.0
- 1% rule +4.8/10.0
- Livability +3.3/5.0
- Schools +3.0/10.0
- Rent growth +2.5/5.0
- Condition / age +2.5/5.0
- ARV discount +0.0/15.0
- Appreciation +0.0/10.0
$299,999
🖨 Deal sheet (PDF) 📄 Offer letter ✓ Due diligence
Listing remarks MLS
Discover the perfect blend of natural beauty and vibrant and desirable 55+ community living at 500 W Santa Maria Space 124 in Santa Paula. This beautiful manufactured home is nestled against a breathtaking backdrop of surrounding mountains, offering tranquility and stunning views. Step inside and enjoy your spacious living room, with an open concept and the kitchen boasts a convenient new dishwasher, making everyday life a breeze. A just installed heating unit allows for cozy mornings. Step outside and enjoy an exceptional array of community amenities, including a refreshing pool, relaxing spa and sauna, fun pool tables, and a dedicated dog park--everything you need for an active and social lifestyle. This is more than a home; it's your entry to a delightful and amenity-rich community.
Key facts
- Relaxing spa
- Refreshing pool
- New dishwasher
Tags
Neighborhood map
What this means for you Summary
Snapshot
- This is a 2-bed/2.0-bath manufactured listed at $300k.
Deal economics
- At list price, monthly cash flow is $258 ($3k/yr) — positive.
- The deal already cash-flows at list — no discount required.
- To meet the 1% rule (rent ≥ 1% of price), the offer needs to be $295k (1.7% below list).
- Recommended offer: $264k (12.0% below list) — sets the bar for market timing.
- Cap rate 7.3% vs local median 2.0% in Santa Paula — top-decile yield for the area; either an underpriced asset or a hidden risk that comps aren't pricing in. Stress-test before assuming the spread holds.
Location & tenants
- Location reads 66/100 on livability (#331 in CA) — a middle-class / working-renter tenant base. Strengths: health & safety A-, commute B+; Watch: amenities F, cost of living F.
- Santa Paula Unified (town): math 26% / reading 35% proficiency, ranked #1,004 of 1,400 in CA (top 72%) — families likely to look elsewhere, expect single-tenant / working-renter base with shorter leases; 67% free/reduced lunch — lower-income household profile, screen leases tightly.
- Zoned schools: Blanchard Elementary (254 students, 76% FRL); Isbell Middle (1,010 students, 72% FRL); Santa Paula High (1,708 students, 64% FRL) — zoned schools at 71% FRL track the district average.
- Market conditions: 159 active listings in the ZIP; 5 comparable units currently listed for rent nearby; rentals at typical pace (median 21d on market — plan ~3-4 weeks tenant-placement turnaround); 40% of comp listings sitting > 30 days — soft ceiling on asking rent; solid renter incomes; 1,759 units permitted in Ventura County in 2024 (1,196 in 5+ unit buildings).
- This rent runs 44% of the median local income ($81k/yr) — at the standard rent-burdened threshold; future hikes will face affordability resistance.
Forward outlook
- Local home prices are declining (-3.0%/yr); year-one equity from $2k of loan paydown is wiped out by about $9k of value loss. Plan a longer hold.
- Ventura County population projected at +4% by 2050 — modest demand growth; plan on rents tracking national, not racing it.
Negotiation context
- It's been on market 234 days — a 12% lower offer ($264k) is reasonable based on typical stale-listing flexibility.
- 3 sale attempts since 15y ago with the ask held roughly flat each time — persistent listings suggest the price (not the market) is what's stuck; bring a comps-based counter.
- Current owner paid $62k; list at $300k implies a 384% gain — meaningful room to come down on a strong offer.
Risks & watch-outs
- Climate carrying-cost: moderate wildfire risk; extreme-heat days projected 7→17/yr by 2055 (HVAC capex compounding) — expect insurance premiums to compound above CPI over the hold.
Questions for the listing agent
- It's been on market 234 days. Have you received any prior offers? Is the seller open to a 12% concession, seller financing, or rate buy-down credit?
- Built in 1973 — when were the roof, HVAC, electrical panel, plumbing, and water heater last replaced?
- Why hasn't it sold? Are there any deal-killer items the seller is aware of (foundation, flood, title, zoning, code violations)?
- Is there a deadline driving the sale (1031 exchange, divorce, estate, relocation)? That informs how much negotiation room exists.
- Schools are D-rated, which usually means shorter tenancies and higher turnover. Who's the typical renter profile here, and what's been the actual vacancy rate?
- The area grade is low — what's the realistic commute time and amenity access for the typical tenant pool here? Any planned neighborhood developments (good or bad) we should know about?
- What's the average days-on-market for RENTAL listings here right now (not sales)? A rising rental-DOM trend means longer vacancies and softer asking-rent achievability than the comps imply.
- What's the recent tenant-quality profile in this submarket — average credit score on applications, eviction rate, late-payment / NSF rate, and stable-employment percentage? A property-management company in the area should have these aggregated.
- How much new for-sale + rental construction is in the pipeline within 1–3 miles? Heavy new supply typically softens prices + rents 12–24 months out; constrained supply supports both.
Investment metrics
- 1% rule
- 0.98% ✗
- Cap rate
- 7.32%
- Cash-on-cash
- 3.68%
- DSCR
- 1.16
- GRM
- 8.5
CMA / ARV
- ARV (median comp)
- $219,241
- List price
- $299,999
- Delta
- 36.84%
- Verdict
- OVERPRICED
- Comps
- 7 within 1.0 mi
Show comp detail 12 sales within ~0.75 mi
| Address | Dist | Beds/Ba | Sqft | Sold | Price | $/sf | Match |
|---|---|---|---|---|---|---|---|
| 500 W Santa Maria St #1 | 0.08mi | 2/2.0 | 1,488 (+3%) | 6mo | $195,000 | $131 | 86 |
| 500 W Santa Maria St #30 | 0.08mi | 2/2.0 | 1,344 (-7%) | 1mo | $315,000 | $234 | 84 |
| 500 W Santa Maria St #111 | 0.09mi | 2/2.0 | 1,536 (+7%) | 2mo | $215,000 | $140 | 83 |
| 500 W Santa Maria St #54 | 0.00mi | 2/2.0 | 1,296 (-10%) | 2mo | $263,000 | $203 | 82 |
| 720 W Santa Maria St #10 | 0.31mi | 2/2.0 | 1,456 (+1%) | 3mo | $310,000 | $213 | 82 |
| 500 W Santa Maria St #83 | 0.07mi | 2/2.0 | 1,500 (+4%) | 12mo | $209,000 | $139 | 79 |
| 500 W Santa Maria St #103 | 0.08mi | 2/2.0 | 1,550 (+8%) | 15mo | $240,000 | $155 | 71 |
| 500 W Santa Maria #43 | 0.07mi | 2/2.0 | 1,248 (-13%) | 5mo | $87,000 | $70 | 70 |
| 500 W Santa Maria St #63 | 0.02mi | 2/2.0 | 1,566 (+9%) | 17mo | $290,000 | $185 | 70 |
| 500 W Santa Maria St #78 | 0.00mi | 3/2.0 (+1) | 1,593 (+11%) | 12mo | $329,000 | $207 | 67 |
| 500 W Santa Maria St #38 | 0.07mi | 3/2.0 (+1) | 1,356 (-6%) | 21mo | $230,000 | $170 | 64 |
| 720 W Santa Maria St #36 | 0.24mi | 2/2.0 | 1,344 (-7%) | 21mo | $273,500 | $203 | 60 |
Match score weights: distance 35% · size 25% · config 20% · recency 20%. Top-matched comps best support the ARV.
Projected returns pro-forma
-3.0% appreciation · 3.0% rent growth · sell at horizon
- IRR
- -10.5%
- Equity multiple
- 0.62×
- Total profit
- $-32,165
- Equity at exit
- $44,731
- IRR
- -1.2%
- Equity multiple
- 0.92×
- Total profit
- $-6,706
- Equity at exit
- $25,938
Cash invested: $84,000 (down + closing). Projections, not guarantees.
Landlord ↔ Tenant lean methodology
- Overall (STATE)
- 18 Strongly Tenant-Friendly
- State California
- 18 Strongly Tenant-Friendly · D+13
- County
- — inherits STATE
- City
- — inherits STATE
ZIP-level market 93060
- Active inventory
- 159
- Price-to-rent
- 8.5×
Monthly cashflow live
- Estimated rent
- $2,950 high interval (Pro) →
- Mortgage (P&I)
- −$1,573
- Tax est. 1.5%
- −$375 /mo · $4,500/yr
- Insurance
- −$125
- HOA
- −$0
- Vacancy / Maint / Mgmt
- −$620
- Net cashflow
- $258
Break-even live
Sensitivity live
| Price | -10% $465 | -5% $361 | +0% $258 | +5% $154 | +10% $50 |
|---|---|---|---|---|---|
| Rent | -10% $24 | -5% $141 | +0% $258 | +5% $374 | +10% $491 |
| Rate | -1.0pp $409 | -0.5pp $334 | base $258 | +0.5pp $180 | +1.0pp $101 |
UW: 25.0% down · 7.5% · 30yr · 1.5% tax · 5.0% vac · 8.0% maint · 8.0% mgmt
Financing live
Cash to close
- Down payment
- $75,000
- Closing costs
- $9,000
- Reserves months
- —
- Total cash needed
- —
Loan-product check · same deal, 3 products live
Conventional
25% down · 7.5% · 30yr
- Down + closing
- —
- Monthly P&I
- —
- Monthly cashflow
- —
- DSCR
- —
- Eligible?
- —
Personal DTI + credit; lowest rate.
DSCR
20% down · 8.5% · 30yr
- Down + closing
- —
- Monthly P&I
- —
- Monthly cashflow
- —
- DSCR
- —
- Eligible?
- —
No personal income docs; deal must DSCR.
Hard money
10% down · 12.0% · 12mo
- Down + closing
- —
- Monthly P&I
- —
- Monthly cashflow
- —
- DSCR
- —
- Eligible?
- —
Short-term bridge; refi at stabilization.
Rent comps 5 comps
| Address | Beds | Baths | Sqft | Rent | $/sqft | DOM | Units | Dist |
|---|---|---|---|---|---|---|---|---|
| 325 Princeton St Santa Paula, CA | 3.0 | 2.0 | 1197 | $3,600 | $3.01 | 45d | 1 | 0.30mi |
| 325 Princeton St Santa Paula, CA | 3.0 | 2.0 | 1197 | $3,600 | $3.01 | 3d | 1 | 0.30mi |
| 126 E Ventura St Unit F Santa Paula, CA | 2.0 | 1.0 | 890 | $2,350 | $2.64 | 3d | 1 | 0.65mi |
| 200 W Main St Apt 7 Santa Paula, CA | 2.0 | 1.0 | 900 | $2,175 | $2.42 | 21d | 1 | 0.66mi |
| 180 Pleasant St Unit D Santa Paula, CA | 2.0 | 1.0 | 980 | $2,100 | $2.14 | 46d | 1 | 1.07mi |
Listing history 28 events
-
2026-06-21days on market $299,999 Active 234 DOM
-
2026-06-18days on market $299,999 Active 231 DOM
-
2026-06-17days on market $299,999 Active 230 DOM
-
2026-06-16days on market $299,999 Active 229 DOM
-
2026-06-15days on market $299,999 Active 228 DOM
-
2026-06-13days on market $299,999 Active 226 DOM
-
2026-06-13days on market $299,999 Active 225 DOM
-
2026-06-10days on market $299,999 Active 223 DOM
-
2026-06-09days on market $299,999 Active 222 DOM
-
2026-06-08days on market $299,999 Active 221 DOM
-
2026-06-07days on market $299,999 Active 220 DOM
-
2026-06-05days on market $299,999 Active 217 DOM
-
2026-06-03days on market $299,999 Active 216 DOM
-
2026-06-02days on market $299,999 Active 215 DOM
-
2026-06-01days on market $299,999 Active 214 DOM
-
2026-05-31days on market $299,999 Active 213 DOM
-
2026-02-12price $299,999 798-char remark
Show marketing remark (798 chars)
Discover the perfect blend of natural beauty and vibrant and desirable 55+ community living at 500 W Santa Maria Space 124 in Santa Paula. This beautiful manufactured home is nestled against a breathtaking backdrop of surrounding mountains, offering tranquility and stunning views. Step inside and enjoy your spacious living room, with an open concept and the kitchen boasts a convenient new dishwasher, making everyday life a breeze. A just installed heating unit allows for cozy mornings. Step outside and enjoy an exceptional array of community amenities, including a refreshing pool, relaxing spa and sauna, fun pool tables, and a dedicated dog park--everything you need for an active and social lifestyle. This is more than a home; it's your entry to a delightful and amenity-rich community.
-
2025-10-30$310,000 Active 798-char remark
Show marketing remark (798 chars)
Discover the perfect blend of natural beauty and vibrant and desirable 55+ community living at 500 W Santa Maria Space 124 in Santa Paula. This beautiful manufactured home is nestled against a breathtaking backdrop of surrounding mountains, offering tranquility and stunning views. Step inside and enjoy your spacious living room, with an open concept and the kitchen boasts a convenient new dishwasher, making everyday life a breeze. A just installed heating unit allows for cozy mornings. Step outside and enjoy an exceptional array of community amenities, including a refreshing pool, relaxing spa and sauna, fun pool tables, and a dedicated dog park--everything you need for an active and social lifestyle. This is more than a home; it's your entry to a delightful and amenity-rich community.
-
2025-05-02historical
-
2025-04-01$260,000 Active
-
2025-03-29historical
-
2011-12-12soldstatus $62,000 Closed
-
2011-11-18historical
-
2011-11-08historical Contingent
-
2011-10-18price $65,000
-
2011-10-04price $73,000
-
2011-09-20price $76,000
-
2011-07-26$76,500 Active
ⓘ Source: listings_history table (triggers on properties + properties_extension) + one-shot
backfill from property_details.listing_events for pre-trigger history.
Climate risk First Street
- Flood 4/10 Moderate FEMA zone X (unshaded) · 24% chance over 30 yrs
- Wildfire 5/10 Major
- Heat 5/10 Major 7 d/yr ≥95°F today · 17 d/yr by 30 yrs out
- Wind 1/10 Low
- Air quality 7/10 Severe 12 unhealthy d/yr today · 12 by 30 yrs out
Nearby sold comps map
Loading sold comps map…
Walkable amenities ~0.75 mi
Loading nearby amenities…
Taxation est. · year 1
- Rental income
- $35,404
- − Mortgage interest
- −$16,805
- − Property taxes
- −$4,500
- − Insurance
- −$1,500
- − Repairs & maintenance
- −$2,832
- − Management
- −$2,832
- − Depreciation
- −$8,727
- Taxable loss
- −$1,792
- Est. tax savings @ 24.0%
- +$430
- After-tax cash flow
- $3,521/yr
For passive investors: Depreciation is non-cash, so a rental often shows a tax loss while cash-flowing — sheltering income. Rental losses are passive: they offset passive income freely, and up to $25,000/yr can offset ordinary (W-2) income if you actively participate and your MAGI is under $100k (phasing out to $0 by $150k); unused losses carry forward. On sale, claimed depreciation is recaptured at up to 25%, and gains may owe capital-gains tax (a 1031 exchange can defer both). Figures are a year-1 estimate at your 24.0% rate — not tax advice; consult a CPA.
Schools (NCES district)
- District
- Santa Paula Unified
- NCES district ID
- 0601421
- Math proficiency
- 26% ▲ 2.00%
- Reading proficiency
- 35% ▲ 4.00%
- Median HH income
- $51,933
- Composite
- 29.6/100
- National rank
- #11750
- State rank
- #1004 of 1400 in CA
Livability — Santa Paula
- Score
- 66/100
- State rank
- #331
- US rank
- #11320
Category grades
Schools grade is shown separately in the Schools card above.
Census & demographics
- Census place
- Santa Paula, CA
- County
- Ventura County · 829,955 people
- City population
- 34,501
- Metro
- Oxnard-Thousand Oaks-Ventura, CA
- Population (ZIP)
- 34,501
- Household income
- $80,979
- Rent vs Own
- Severe rent burden
- 1317.0
Population outlook (Ventura County) Hauer SSP2
- Today (2025)
- 895,754 people
- By 2030
- 912,134 · +1.8%
- By 2040
- 931,454 · +4.0%
- By 2050
- 934,609 · +4.3%
- By 2075
- 924,899 · +3.3%
- By 2100
- 864,712 · -3.5%
Race, ethnicity, and origin ACS 2023
- Neighborhood character
- Predominantly Hispanic (77%)
- Race & ethnicity
- Hispanic / Latino 77% White 18% Two or more races 18% Black 1% Native American 1% Asian 1%
- Hispanic origin (detail)
- Mexican 75%
- Common ancestry
- Lithuanian 1% Portuguese 1% Slovak 1%
- Foreign-born
- 31% · Canada
- Languages at home
- 37% English-only · Spanish 61%
Political lean MEDSL · Ventura
- 2024 margin
- D (+15.1) · D 56.1% · R 41.0% · Other 2.9%
- 2008→2024 swing
- +2.8pp toward D · 2008: 12.3pp · 2024: 15.1pp
- All cycles
- 2024: D+15.1 2020: D+21.1 2016: D+16.8 2012: D+5.3 2008: D+12.3
Not yet ingested
- Civics
- —
Market trends
- HPI YoY
- ▼ -942.94%
- Current HPI
- 333.9105
- Rent YoY
- —
- Metro
- Oxnard-Thousand Oaks-Ventura, CA
- State GDP YoY
- ▲ 3.21%
- F500 in state
- 116
Industry mix (Fortune 500 HQ in CA)
| Industry | F500 HQs | Revenue |
|---|---|---|
| Technology | 27 | $1,492B |
|
||
| Financial Services | 3 | $174B |
|
||
| Retail | 3 | $44B |
|
||
| Insurance | 3 | $26B |
|
||
| Media / Entertainment | 2 | $115B |
|
||
| Pharmaceuticals / Biotech | 2 | $62B |
|
||
Price history
+292.2% since first listed12 events — show timeline
- 2026-02-12 Price Changed $299,999 CRMLS
- 2025-10-30 Listed $310,000 CRMLS
- 2025-05-02 Listing Removed — CRMLS
- 2025-04-01 Listed $260,000 CRMLS
- 2025-03-29 Coming Soon — CRMLS
- 2011-12-12 Sold (MLS) $62,000 CRMLS
- 2011-11-18 Listing Removed — CRMLS
- 2011-11-08 Contingent — CRMLS
- 2011-10-18 Price Changed $65,000 CRMLS
- 2011-10-04 Price Changed $73,000 CRMLS
- 2011-09-20 Price Changed $76,000 CRMLS
- 2011-07-26 Listed $76,500 CRMLS
Cash-flow waterfall
monthlySold comps — $/sqft
last 12 mo · ≤1 miLoading sold comps…