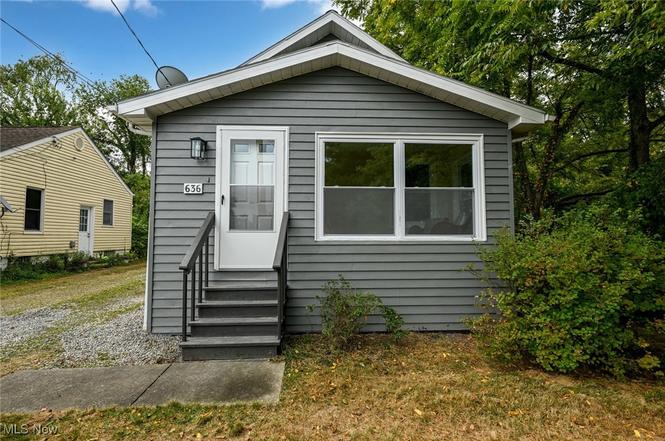
636 Flora Ave · Akron, OH
Flood risk 1/10 · Minimal
- FEMA flood zone
- X (unshaded)
- Chance of flooding over 30 yrs
- 0.0%
- Est. flood insurance / yr
- $473 – $860
Fire risk 1/10 · Minimal
- Est. fire insurance / yr
- $713 – $1,323
Heat risk 3/10 · Minor
- Hot days now (above 96°F)
- 7 days/yr
- Hot days in 30 yrs
- 17 days/yr
Wind risk 1/10 · Minimal
- Chance of severe wind over 30 yrs
- —
Air-quality risk 2/10 · Minimal
- Unhealthy air days now
- 1 days/yr
- Unhealthy air days in 30 yrs
- 2 days/yr
Risk factors via First Street. Map © Google.
Why this score? — see what drove the F grade
The composite is a weighted blend of 9 inputs, each scored 0–100. Each bar is that input's sub-score; the figure is the points it added to the 100-point composite (weight × sub-score).
- Cash flow +6.4/30.0
- Livability +4.0/5.0
- Rent growth +3.5/5.0
- Condition / age +2.5/5.0
- Schools +2.1/10.0
- 1% rule +0.8/10.0
- DSCR +0.7/10.0
- ARV discount +0.0/15.0
- Appreciation +0.0/10.0
$169,990
🖨 Deal sheet (PDF) 📄 Offer letter ✓ Due diligence
Listing remarks
Wow, this end unit has been completely revamped! It features a brand-new furnace, new windows, a redesigned kitchen, recessed lights, and new flooring, along with laundry on the first level for convenient first-floor living. This home has two large bedrooms: one on the first level and one on the walkout basement level. There are two additional small rooms on the upper level, which can be utilized as an office space or storage, perhaps an additional closet area or family living area, whatever your choice. The interior features a beautifully remodelled bathroom on the first floor, complete with tiles from floor to wall, a new vanity, and an overall stunning look. This is complemented by a bra
Key facts
- New furnace
- New flooring
- Recessed lights
Tags
Property features AI
Exterior
- Parking: Detached garage; Driveway parking; On-street parking; Garage with 1 parking space
- Utilities: Public water; Public sewer
- Home design: Single-story structure; Updated/remodeled condition; Vinyl siding exterior; Asphalt/fiberglass roof
- Construction: Vinyl siding construction; Asphalt/fiberglass roof; Year built per assessor
- Exterior features: Attached property; Lot approx. 0.149 acres
Interior
- Kitchen: First-floor kitchen
- Bedrooms: One main-level bedroom; Multiple second-level bedrooms (carpeted)
- Flooring: Carpet in several bedrooms
- Bathrooms: Two full bathrooms total; One full bathroom on the main level; Additional full bathroom on the lower level
- Heating & cooling: Forced air heating; Central air conditioning
- Interior features: Finished full basement; Additional living suite in basement; Sunroom on the first floor; Office in lower level; Dining room
- Laundry & utility: First-floor laundry room
Neighborhood map
What this means for you Summary
Snapshot
- This is a 1-bed/1.0-bath single-family listed at $170k.
Deal economics
- At list price, monthly cash flow is $-294 ($-4k/yr) — negative.
- To cash-flow at today's rent, offer at most $118k (30.5% below list).
- To meet the 1% rule (rent ≥ 1% of price), the offer needs to be $99k (41.8% below list).
- Recommended offer: $99k (41.8% below list) — sets the bar for 1% rule.
- Cap rate 4.2% vs local median 6.6% in Akron — below-typical yield; the buyer is paying a premium for something (appreciation thesis, condition, location) that the cap rate doesn't capture.
Location & tenants
- Location reads 81/100 on livability (#104 in OH, #1,591 nationally) — a professional / high-income tenant draw. Strengths: amenities A+, commute A+, cost of living A+; Watch: crime F, employment F.
- Akron City (urban): math 22% / reading 30% proficiency, ranked #602 of 656 in OH (top 92%) — low school quality limits family demand, transient renter base, plan for 1-2y turnover; 66% free/reduced lunch — lower-income household profile, screen leases tightly.
- Zoned schools: Rimer Community Learning Center (math 37% / reading 37%, grade F, #1,087 of 1,584 statewide, top 70%, 278 students, 0% FRL); Innes Community Learning Center (math 8% / reading 15%, grade F, #641 of 654 statewide, top 98%, 641 students, 0% FRL); Akron Early College High School (math 62% / reading 98%, grade A, #34 of 781 statewide, top 4%, 377 students, 0% FRL) — zoned schools average 0% FRL vs 66% district-wide (66 pts lower); this property's tenant base skews higher-income than the district average.
- Zoned-school proficiency averages 43% at this address vs 26% district-wide (+17 pts) — the actual schools serving this property are materially stronger than the Akron City average implies; a family-tenant draw the district grade alone would hide.
- Market conditions: Rents rising (+3.9%/yr); 104 active listings in the ZIP; 12 comparable units currently listed for rent nearby; rentals lingering (median 46d on market — plan ~5-8 weeks vacancy on turnover, expect pricing pressure); 67% of comp listings sitting > 30 days — soft ceiling on asking rent; 1,114 units permitted in Summit County in 2024 (397 in 5+ unit buildings).
Forward outlook
- Local home prices are declining (-3.0%/yr); year-one equity from $1k of loan paydown is wiped out by about $5k of value loss. Plan a longer hold.
- Summit County population projected to shrink 6% by 2050 — rents likely to lag national; underwrite the cash flow, not the appreciation.
Negotiation context
- It's been on market 249 days — a 12% lower offer ($150k) is reasonable based on typical stale-listing flexibility.
Risks & watch-outs
- Watch-outs: built in 1927 — expect roof / HVAC / electrical / plumbing capex.
Questions for the listing agent
- What do current leases actually rent for vs. the listed asking? Can we see a recent rent roll and the last 12 months of T-12 income?
- It's been on market 249 days. Have you received any prior offers? Is the seller open to a 42% concession, seller financing, or rate buy-down credit?
- Built in 1927 — when were the roof, HVAC, electrical panel, plumbing, and water heater last replaced?
- Why hasn't it sold? Are there any deal-killer items the seller is aware of (foundation, flood, title, zoning, code violations)?
- Is there a deadline driving the sale (1031 exchange, divorce, estate, relocation)? That informs how much negotiation room exists.
- Crime grade is F in this area — have there been break-ins, vandalism, or insurance claims at this property in the last 3 years? What carrier currently insures it and at what premium?
- The area grade is low — what's the realistic commute time and amenity access for the typical tenant pool here? Any planned neighborhood developments (good or bad) we should know about?
- What's the average days-on-market for RENTAL listings here right now (not sales)? A rising rental-DOM trend means longer vacancies and softer asking-rent achievability than the comps imply.
- What's the recent tenant-quality profile in this submarket — average credit score on applications, eviction rate, late-payment / NSF rate, and stable-employment percentage? A property-management company in the area should have these aggregated.
- How much new for-sale + rental construction is in the pipeline within 1–3 miles? Heavy new supply typically softens prices + rents 12–24 months out; constrained supply supports both.
Investment metrics
- 1% rule
- 0.58% ✗
- Cap rate
- 4.22%
- Cash-on-cash
- -7.40%
- DSCR
- 0.67
- GRM
- 14.3
CMA / ARV
- ARV (on-the-fly)
- $125,188
- Comps found
- 11
Show comp detail 11 sales within ~0.75 mi
| Address | Dist | Beds/Ba | Sqft | Sold | Price | $/sf | Match |
|---|---|---|---|---|---|---|---|
| 2328 7th St SW | 0.17mi | 2/1.0 (+1) | 972 (-8%) | 20mo | $61,000 | $63 | 57 |
| 592 Sharon St | 0.58mi | 2/1.5 (+1) | 1,020 (-3%) | 6mo | $50,000 | $49 | 56 |
| 2407 Nesmith Lake Blvd | 0.68mi | 2/1.0 (+1) | 1,002 (-5%) | 2mo | $131,000 | $131 | 53 |
| 471 Westmoreland St | 0.33mi | 2/2.0 (+1) | 1,084 (+3%) | 22mo | $145,000 | $134 | 52 |
| 2255 Nesmith Lake Blvd | 0.51mi | 2/1.0 (+1) | 942 (-10%) | 2mo | $116,500 | $124 | 52 |
| 447 Allenford St | 0.36mi | 2/2.0 (+1) | 1,152 (+10%) | 11mo | $137,000 | $119 | 49 |
| 2133 6th St SW | 0.50mi | 2/1.0 (+1) | 1,000 (-5%) | 18mo | $52,000 | $52 | 49 |
| 393 Celtic St | 0.48mi | 2/1.0 (+1) | 1,083 (+3%) | 23mo | $90,000 | $83 | 48 |
| 474 Rexford St | 0.47mi | 2/2.0 (+1) | 968 (-8%) | 11mo | $175,000 | $181 | 47 |
| 2499 Nesmith Lake Blvd | 0.74mi | 2/1.0 (+1) | 1,092 (+4%) | 11mo | $156,000 | $143 | 45 |
| 2009 6th St SW | 0.73mi | 2/1.0 (+1) | 951 (-10%) | 7mo | $94,000 | $99 | 39 |
Match score weights: distance 35% · size 25% · config 20% · recency 20%. Top-matched comps best support the ARV.
Projected returns pro-forma
-3.0% appreciation · 3.91% rent growth · sell at horizon
- IRR
- -28.4%
- Equity multiple
- 0.05×
- Total profit
- $-45,379
- Equity at exit
- $25,346
- IRR
- -24.9%
- Equity multiple
- -0.26×
- Total profit
- $-59,963
- Equity at exit
- $14,698
Cash invested: $47,597 (down + closing). Projections, not guarantees.
Landlord ↔ Tenant lean methodology
- Overall (STATE)
- 73 Landlord-Friendly
- State Ohio
- 73 Landlord-Friendly · R+6
- County
- — inherits STATE
- City
- — inherits STATE
ZIP-level market 44314
- Rents YoY
- 3.9%
- Active inventory
- 104
- Price-to-rent
- 14.3×
Monthly cashflow live
- Estimated rent
- $989 high interval (Pro) →
- Mortgage (P&I)
- −$891
- Tax from tax record
- −$113 /mo · $1,354/yr
- Insurance
- −$71
- HOA
- −$0
- Vacancy / Maint / Mgmt
- −$208
- Net cashflow
- $-294
Break-even live
Sensitivity live
| Price | -10% $-197 | -5% $-246 | +0% $-294 | +5% $-342 | +10% $-390 |
|---|---|---|---|---|---|
| Rent | -10% $-372 | -5% $-333 | +0% $-294 | +5% $-255 | +10% $-215 |
| Rate | -1.0pp $-208 | -0.5pp $-250 | base $-294 | +0.5pp $-338 | +1.0pp $-382 |
UW: 25.0% down · 7.5% · 30yr · 1.5% tax · 5.0% vac · 8.0% maint · 8.0% mgmt
Financing live
Cash to close
- Down payment
- $42,498
- Closing costs
- $5,100
- Reserves months
- —
- Total cash needed
- —
Loan-product check · same deal, 3 products live
Conventional
25% down · 7.5% · 30yr
- Down + closing
- —
- Monthly P&I
- —
- Monthly cashflow
- —
- DSCR
- —
- Eligible?
- —
Personal DTI + credit; lowest rate.
DSCR
20% down · 8.5% · 30yr
- Down + closing
- —
- Monthly P&I
- —
- Monthly cashflow
- —
- DSCR
- —
- Eligible?
- —
No personal income docs; deal must DSCR.
Hard money
10% down · 12.0% · 12mo
- Down + closing
- —
- Monthly P&I
- —
- Monthly cashflow
- —
- DSCR
- —
- Eligible?
- —
Short-term bridge; refi at stabilization.
Rent comps 12 comps
| Address | Beds | Baths | Sqft | Rent | $/sqft | DOM | Units | Dist |
|---|---|---|---|---|---|---|---|---|
| 835 Kenmore Blvd Unit UP Akron, OH | 2.0 | 1.0 | 872 | $750 | $0.86 | 23d | 1 | 0.46mi |
| 2139 18th St SW Akron, OH | 2.0 | 1.0 | 992 | $1,100 | $1.11 | 45d | 1 | 0.83mi |
| 1253 California Ave Akron, OH | 2.0 | 1.0 | 780 | $1,100 | $1.41 | 46d | 1 | 1.15mi |
| 1253 California Ave Akron, OH | 2.0 | 1.0 | 780 | $950 | $1.22 | 25d | 1 | 1.15mi |
| 1169 Weiser Ave Akron, OH | 2.0 | 1.0 | 768 | $950 | $1.24 | 45d | 1 | 1.18mi |
| 847 Jason Ave Unit 1 Akron, OH | 2.0 | 1.0 | 798 | $825 | $1.03 | 25d | 1 | 1.21mi |
| 781 Saxon Ave Akron, OH | 2.0 | 1.0 | 800 | $900 | $1.12 | 45d | 1 | 1.22mi |
| 1304 Kellogg Ave Akron, OH | 2.0 | 2.0 | 1148 | $2,000 | $1.74 | 16d | 1 | 1.36mi |
| 58 E Archwood Ave Akron, OH | 2.0 | 1.0 | 750 | $850 | $1.13 | 45d | 1 | 1.41mi |
| 46 Brighton Dr Akron, OH | 2.0 | 1.0 | 850 | $1,100 | $1.29 | 45d | 1 | 1.41mi |
| 45 E Emerling Ave Unit F Akron, OH | 2.0 | 1.0 | 850 | $795 | $0.94 | 45d | 1 | 1.44mi |
| 67 E Archwood Ave Unit A Akron, OH | 2.0 | 1.0 | 1000 | $850 | $0.85 | 45d | 1 | 1.45mi |
Listing history 5 events
-
2026-05-14status Pending
-
2026-04-04historical Contingent
-
2025-10-10price $169,990
-
2025-10-10price $169,000
-
2025-09-07$179,000 Active
ⓘ Source: listings_history table (triggers on properties + properties_extension) + one-shot
backfill from property_details.listing_events for pre-trigger history.
Tax reassessment forecast OH · Partial reset (capped growth)
- Current annual tax
- $1,354 · $113/mo
- Projected year-2 tax
- $2,003 · $167/mo
- Expected delta
- +$649/yr (+$54/mo · 47.9%)
ⓘ Screening estimate from a state-policy table — verify with the county assessor before closing.
Climate risk First Street
- Flood 1/10 Low FEMA zone X (unshaded) · 0% chance over 30 yrs
- Wildfire 1/10 Low
- Heat 3/10 Moderate 7 d/yr ≥96°F today · 17 d/yr by 30 yrs out
- Wind 1/10 Low
- Air quality 2/10 Low 1 unhealthy d/yr today · 2 by 30 yrs out
Nearby sold comps map
Loading sold comps map…
Walkable amenities ~0.75 mi
Loading nearby amenities…
Taxation est. · year 1
- Rental income
- $11,871
- − Mortgage interest
- −$9,522
- − Property taxes
- −$1,354
- − Insurance
- −$850
- − Repairs & maintenance
- −$950
- − Management
- −$950
- − Depreciation
- −$4,945
- Taxable loss
- −$6,700
- Est. tax savings @ 24.0%
- +$1,608
- After-tax cash flow
- $-1,915/yr
For passive investors: Depreciation is non-cash, so a rental often shows a tax loss while cash-flowing — sheltering income. Rental losses are passive: they offset passive income freely, and up to $25,000/yr can offset ordinary (W-2) income if you actively participate and your MAGI is under $100k (phasing out to $0 by $150k); unused losses carry forward. On sale, claimed depreciation is recaptured at up to 25%, and gains may owe capital-gains tax (a 1031 exchange can defer both). Figures are a year-1 estimate at your 24.0% rate — not tax advice; consult a CPA.
Schools (NCES district)
- District
- Akron City
- NCES district ID
- 3904348
- Math proficiency
- 22% ▼ -17.00%
- Reading proficiency
- 30% ▼ -12.00%
- Median HH income
- $33,811
- Composite
- 21.31/100
- National rank
- #8383
- State rank
- #602 of 656 in OH
Livability — Akron
- Score
- 81/100
- State rank
- #104
- US rank
- #1591
Category grades
Schools grade is shown separately in the Schools card above.
Census & demographics
- Census place
- Akron, OH
- County
- Summit County · 440,783 people
- City population
- 174,375
- Metro
- Akron, OH
- Population (ZIP)
- 17,885
- Household income
- $47,468
- Rent vs Own
- Severe rent burden
- 975.0
Population outlook (Summit County) Hauer SSP2
- Today (2025)
- 546,583 people
- By 2030
- 544,028 · -0.5%
- By 2040
- 531,363 · -2.8%
- By 2050
- 514,923 · -5.8%
- By 2075
- 481,765 · -11.9%
- By 2100
- 432,265 · -20.9%
Race, ethnicity, and origin ACS 2023
- Neighborhood character
- Predominantly White (69%)
- Race & ethnicity
- White 69% Black 16% Two or more races 12% Hispanic / Latino 3% Asian 3%
- Common ancestry
- Slovak 2% Romanian 2% Lithuanian 1%
- Foreign-born
- 3% · India, Canada, Philippines
- Languages at home
- 96% English-only · Chinese 2% Russian/Polish/Slavic 1% Spanish 1%
Political lean MEDSL · Summit
- 2024 margin
- Lean D (+7.0) · D 53.0% · R 46.0%
- 2008→2024 swing
- -9.6pp toward R · 2008: 16.6pp · 2024: 7.0pp
- All cycles
- 2024: D+7.0 2020: D+9.6 2016: D+8.2 2012: D+14.8 2008: D+16.6
Not yet ingested
- Civics
- —
Market trends
- HPI YoY
- ▼ -166.61%
- Current HPI
- 151.066
- Rent YoY
- ▲ 3.91%
- Metro
- Akron, OH
- State GDP YoY
- ▲ 1.98%
- F500 in state
- 48
Industry mix (Fortune 500 HQ in OH)
| Industry | F500 HQs | Revenue |
|---|---|---|
| Insurance | 3 | $145B |
|
||
| Industrial Machinery | 3 | $49B |
|
||
| Financial Services | 3 | $24B |
|
||
| Consumer Goods | 2 | $93B |
|
||
| Aerospace / Defense | 2 | $47B |
|
||
| Utilities | 2 | $33B |
|
||
Price history
-5.0% since first listed5 events — show timeline
- 2026-05-14 Pending — MLSNOW
- 2026-04-04 Contingent — MLSNOW
- 2025-10-10 Price Changed $169,990 MLSNOW
- 2025-10-10 Price Changed $169,000 MLSNOW
- 2025-09-07 Listed $179,000 MLSNOW
Property tax history
-0.1%/yrLatest (2025): $1,354 · +5.5% YoY. Source: county tax records.
Cash-flow waterfall
monthlySold comps — $/sqft
last 12 mo · ≤1 miLoading sold comps…