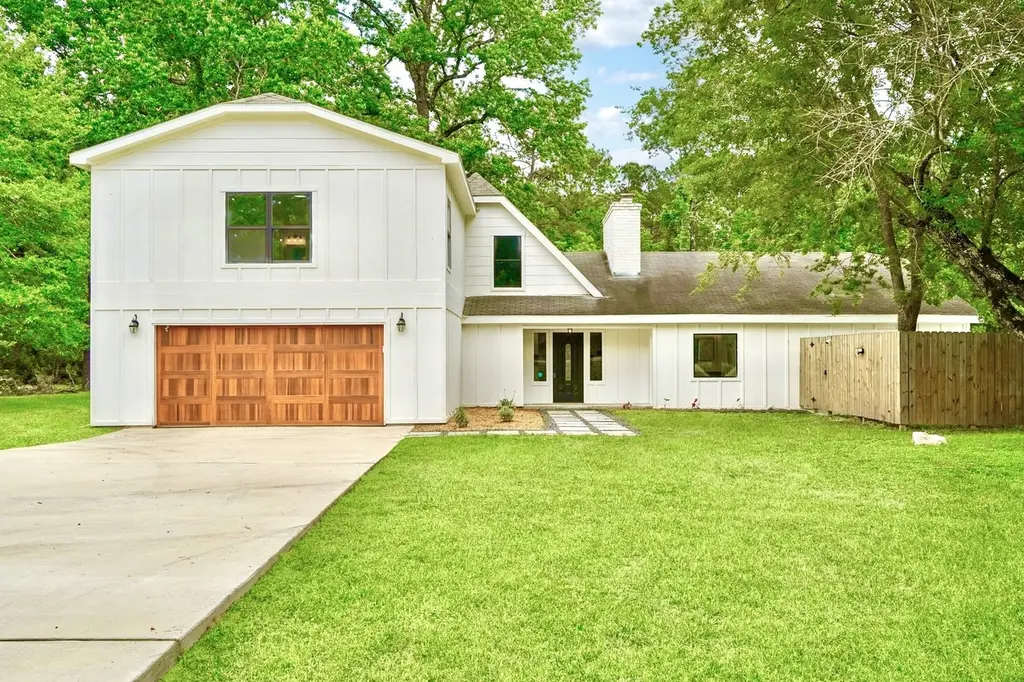
32606 Glenda Dr · Magnolia, TX
Flood risk 1/10 · Minimal
- FEMA flood zone
- X (unshaded)
- Chance of flooding over 30 yrs
- 0.0%
- Est. flood insurance / yr
- $507 – $1,088
Fire risk 4/10 · Minor
- Est. fire insurance / yr
- $1,222 – $2,270
Heat risk 8/10 · Major
- Hot days now (above 111°F)
- 7 days/yr
- Hot days in 30 yrs
- 24 days/yr
Wind risk 8/10 · Major
- Chance of severe wind over 30 yrs
- 99.0%
Air-quality risk 2/10 · Minimal
- Unhealthy air days now
- 2 days/yr
- Unhealthy air days in 30 yrs
- 2 days/yr
Risk factors via First Street. Map © Google.
Why this score? — see what drove the D grade
The composite is a weighted blend of 9 inputs, each scored 0–100. Each bar is that input's sub-score; the figure is the points it added to the 100-point composite (weight × sub-score).
- ARV discount +15.0/15.0
- Appreciation +10.0/10.0
- Schools +3.9/10.0
- Livability +3.7/5.0
- Cash flow +3.4/30.0
- Rent growth +2.6/5.0
- Condition / age +2.5/5.0
- 1% rule +0.0/10.0
- DSCR +0.0/10.0
$579,000
🖨 Deal sheet 📄 Offer letter ✓ Due diligence
Listing remarks
Tucked beneath mature trees on a 2/3 acre lot, this fully reimagined modern farmhouse blends luxury with serenity. Spanning 3,386 SF, this 5 bed, 4 bath home features two, true primary suites on both the 1st & 2nd floors, custom finishes throughout, and brand-new plumbing w/ tankless water heater and electrical for peace of mind. The heart of the home opens to warm wood, LVP floors, vaulted ceilings, two slate fireplaces with rustic mantles, and thoughtfully designed spaces that feel both elevated and inviting. Designer kitchens and baths shine, with 3 of the 4 baths offering double sinks. Upstairs, a fun game room overlooks the living area below, creating an open, connected feel with
Key facts
- 0.69 acre lot
- 2 garage spots
- Pool
Property features AI
Finance
- Other: Building area approximately 3,386 total square feet
Exterior
- Parking: Attached oversized garage with 2 spaces; Driveway parking
- Security: Smoke detectors
- Utilities: Well water; Septic sewer
- Home design: Residential property; Facing west; Full ownership; Built in 1973; Slab foundation
- Construction: Cement siding; Composition roof; Slab foundation; Year built: 1973
- Exterior features: Private in-ground pool; Partial fencing; Fence and private yard; Backs to greenbelt/park; Cleared lot with side yard; Additional parcel(s)
Interior
- Kitchen: Dishwasher; Electric oven and electric range; Microwave; Garbage disposal; Energy Star qualified appliances; Pot filler
- Bedrooms: Up to 5 bedrooms; Primary bedrooms on first and second levels; Additional bedrooms on first and second levels
- Bathrooms: 4 full bathrooms; Primary bathrooms with separate shower and soaking tub; Double vanities in primary baths
- Heating & cooling: Central heating (electric); Central air conditioning (electric)
- Interior features: Breakfast bar; Balcony; Double vanities; High ceilings; Kitchen/family room combo; Pot filler; Self-closing cabinet doors and drawers; Soaking tub; Separate shower; Tub/shower combination; Vaulted ceilings; Ceiling fans; Loft; Programmable thermostat; Wood-burning fireplaces (2 total)
- Laundry & utility: Washer hookup; Electric dryer hookup; Tankless water heater; Utility room on first floor
Neighborhood map
What this means for you Summary
Snapshot
- This is a 5-bed/2.0-bath single-family listed at $579k.
Deal economics
- At list price, monthly cash flow is $-2k ($-21k/yr) — negative.
- To cash-flow at today's rent, offer at most $268k (53.8% below list).
- To meet the 1% rule (rent ≥ 1% of price), the offer needs to be $239k (58.7% below list).
- Recommended offer: $239k (58.7% below list) — sets the bar for 1% rule.
- Cap rate 2.6% vs local median 3.4% in Magnolia — below-typical yield; the buyer is paying a premium for something (appreciation thesis, condition, location) that the cap rate doesn't capture.
Location & tenants
- Location reads 73/100 on livability (#222 in TX) — a middle-class / working-renter tenant base. Strengths: crime A+, cost of living A+, housing A+; Watch: amenities F, commute F.
- Magnolia ISD (rural): math 42% / reading 45% proficiency, ranked #247 of 826 in TX (top 30%) — families likely to look elsewhere, expect single-tenant / working-renter base with shorter leases.
- Zoned schools: Magnolia Parkway El (math 38% / reading 46%, grade F, #1,335 of 4,322 statewide, top 33%, 776 students, 45% FRL); Magnolia H S (math 47% / reading 62%, grade C-, #379 of 1,632 statewide, top 26%, 2,248 students, 31% FRL) — zoned schools at 38% FRL track the district average.
- Market conditions: Rents flat; 1604 active listings in the ZIP; 1 comparable units currently listed for rent nearby; high-income renter base; 13,259 units permitted in Montgomery County in 2024 (1,402 in 5+ unit buildings).
Forward outlook
- In year one you build about $62k of equity ($4k loan paydown + $58k appreciation (10.0% local appreciation)).
- Montgomery County population projected at +65% by 2050 — long-run rental-demand tailwind backs the buy-and-hold thesis.
- By year 2, paydown + projected appreciation supports a ~$100k cash-out refi (75% LTV) — recoverable capital for the next deal without selling this one.
Negotiation context
- It's been on market 42 days — a 3% lower offer ($562k) is reasonable based on typical stale-listing flexibility.
- 8 sale attempts since 11y ago with the ask held roughly flat each time — persistent listings suggest the price (not the market) is what's stuck; bring a comps-based counter.
Risks & watch-outs
- Climate carrying-cost: severe wind risk, 99% chance of damaging wind over 30y; extreme-heat days projected 7→24/yr by 2055 (HVAC capex compounding) — expect insurance premiums to compound above CPI over the hold.
Questions for the listing agent
- What do current leases actually rent for vs. the listed asking? Can we see a recent rent roll and the last 12 months of T-12 income?
- It's been on market 42 days. Have you received any prior offers? Is the seller open to a 59% concession, seller financing, or rate buy-down credit?
- Built in 1973 — when were the roof, HVAC, electrical panel, plumbing, and water heater last replaced?
- Is there a deadline driving the sale (1031 exchange, divorce, estate, relocation)? That informs how much negotiation room exists.
- Schools are D-rated, which usually means shorter tenancies and higher turnover. Who's the typical renter profile here, and what's been the actual vacancy rate?
- The area grade is low — what's the realistic commute time and amenity access for the typical tenant pool here? Any planned neighborhood developments (good or bad) we should know about?
- What's the average days-on-market for RENTAL listings here right now (not sales)? A rising rental-DOM trend means longer vacancies and softer asking-rent achievability than the comps imply.
- What's the recent tenant-quality profile in this submarket — average credit score on applications, eviction rate, late-payment / NSF rate, and stable-employment percentage? A property-management company in the area should have these aggregated.
- How much new for-sale + rental construction is in the pipeline within 1–3 miles? Heavy new supply typically softens prices + rents 12–24 months out; constrained supply supports both.
Investment metrics
- 1% rule
- 0.41% ✗
- Cap rate
- 2.64%
- Cash-on-cash
- -13.05%
- DSCR
- 0.42
- GRM
- 20.2
CMA / ARV
- ARV (median comp)
- $826,144
- List price
- $579,000
- Delta
- -29.92%
- Verdict
- UNDERPRICED
- Comps
- 20 within 1.0 mi
Show comp detail 1 sale within ~0.75 mi
| Address | Dist | Beds/Ba | Sqft | Sold | Price | $/sf | Match |
|---|---|---|---|---|---|---|---|
| 32363 Spinnaker Run | 0.63mi | 4/3.0 (-1) | 2,863 (+14%) | 11mo | $725,000 | $253 | 30 |
Match score weights: distance 35% · size 25% · config 20% · recency 20%. Top-matched comps best support the ARV.
Projected returns pro-forma
10.0% appreciation · 0.32% rent growth · sell at horizon
- IRR
- 14.7%
- Equity multiple
- 2.21×
- Total profit
- $196,607
- Equity at exit
- $521,609
- IRR
- 14.2%
- Equity multiple
- 5.04×
- Total profit
- $655,524
- Equity at exit
- $1,124,870
Cash invested: $162,120 (down + closing). Projections, not guarantees.
Landlord ↔ Tenant lean methodology
- Overall (STATE)
- 87 Strongly Landlord-Friendly
- State Texas
- 87 Strongly Landlord-Friendly · R+5
- County
- — inherits STATE
- City
- — inherits STATE
ZIP-level market 77354
- Home prices YoY
- 2.4%
- Rents YoY
- 0.3%
- Active inventory
- 1604
- Price-to-rent
- 20.2×
Monthly cashflow live
- Estimated rent
- $2,389 medium interval (Pro) →
- Mortgage (P&I)
- −$3,036
- Tax from tax record
- −$373 /mo · $4,472/yr
- Insurance
- −$241
- HOA
- −$0
- Vacancy / Maint / Mgmt
- −$502
- Net cashflow
- $-1,763
Break-even live
UW: 25.0% down · 7.5% · 30yr · 1.5% tax · 5.0% vac · 8.0% maint · 8.0% mgmt
Financing live
Cash to close
- Down payment
- $144,750
- Closing costs
- $17,370
- Reserves months
- —
- Total cash needed
- —
Loan-product check · same deal, 3 products live
Conventional
25% down · 7.5% · 30yr
- Down + closing
- —
- Monthly P&I
- —
- Monthly cashflow
- —
- DSCR
- —
- Eligible?
- —
Personal DTI + credit; lowest rate.
DSCR
20% down · 8.5% · 30yr
- Down + closing
- —
- Monthly P&I
- —
- Monthly cashflow
- —
- DSCR
- —
- Eligible?
- —
No personal income docs; deal must DSCR.
Hard money
10% down · 12.0% · 12mo
- Down + closing
- —
- Monthly P&I
- —
- Monthly cashflow
- —
- DSCR
- —
- Eligible?
- —
Short-term bridge; refi at stabilization.
Rent comps 1 comps
| Address | Beds | Baths | Sqft | Rent | $/sqft | DOM | Units | Dist |
|---|---|---|---|---|---|---|---|---|
| 12035 Noble Wood Village DR Magnolia, TX | 4.0 | 2.5 | 1979 | $2,150 | $1.09 | 43d | 1 | 1.29mi |
Listing history 40 events
-
2026-06-18days on market $579,000 Active 42 DOM
-
2026-06-17days on market $579,000 Active 41 DOM
-
2026-06-16days on market $579,000 Active 40 DOM
-
2026-06-15days on market $579,000 Active 39 DOM
-
2026-06-13days on market $579,000 Active 37 DOM
-
2026-06-09days on market $579,000 Active 33 DOM
-
2026-06-08days on market $579,000 Active 32 DOM
-
2026-06-07days on market $579,000 Active 31 DOM
-
2026-06-04days on market $579,000 Active 28 DOM
-
2026-06-03days on market $579,000 Active 27 DOM
-
2026-06-02days on market $579,000 Active 26 DOM
-
2026-06-01days on market $579,000 Active 25 DOM
-
2026-05-31days on market $579,000 Active 24 DOM
-
2026-05-08$579,000 Active 972-char remark
-
2026-04-26historical $579,000 972-char remark
-
2022-08-04historical
-
2022-07-16price $3,170
-
2022-06-29status Active
-
2022-06-22historical
-
2022-06-21$349,900 Active
-
2022-01-15status Pending
-
2022-01-06status Option Pending
-
2022-01-05historical
-
2021-12-27status Active
-
2021-10-27status Pending
-
2021-10-22price $200,000
-
2021-10-22status Active
-
2021-10-15status Option Pending
-
2021-09-20price $230,000
-
2021-09-03$250,000 Active
-
2015-07-17soldstatus Sold
-
2015-07-17status Pending
-
2015-06-26status Pending, Continue to Show
-
2015-06-16status Option Pending
-
2015-06-08$168,000 Active
-
2015-06-04status Pending, Continue to Show
-
2015-04-22status Pending
-
2015-04-11status Option Pending
-
2015-04-11historical
-
2015-04-01$168,000 Active
ⓘ Source: listings_history table (triggers on properties + properties_extension) + one-shot
backfill from property_details.listing_events for pre-trigger history.
Tax reassessment forecast TX · Resets to sale price
- Current annual tax
- $4,472 · $373/mo
- Projected year-2 tax
- $10,596 · $883/mo
- Expected delta
- +$6,123/yr (+$510/mo · 136.9%)
ⓘ Screening estimate from a state-policy table — verify with the county assessor before closing.
Climate risk First Street
- Flood 1/10 Low FEMA zone X (unshaded) · 0% chance over 30 yrs
- Wildfire 4/10 Moderate
- Heat 8/10 Severe 7 d/yr ≥111°F today · 24 d/yr by 30 yrs out
- Wind 8/10 Severe 99% chance of damaging wind over 30 yrs
- Air quality 2/10 Low 2 unhealthy d/yr today · 2 by 30 yrs out
Nearby sold comps map
Loading sold comps map…
Walkable amenities ~0.75 mi
Loading nearby amenities…
Taxation est. · year 1
- Rental income
- $28,670
- − Mortgage interest
- −$32,433
- − Property taxes
- −$4,472
- − Insurance
- −$2,895
- − Repairs & maintenance
- −$2,294
- − Management
- −$2,294
- − Depreciation
- −$16,844
- Taxable loss
- −$32,561
- Est. tax savings @ 24.0%
- +$7,815
- After-tax cash flow
- $-13,340/yr
For passive investors: Depreciation is non-cash, so a rental often shows a tax loss while cash-flowing — sheltering income. Rental losses are passive: they offset passive income freely, and up to $25,000/yr can offset ordinary (W-2) income if you actively participate and your MAGI is under $100k (phasing out to $0 by $150k); unused losses carry forward. On sale, claimed depreciation is recaptured at up to 25%, and gains may owe capital-gains tax (a 1031 exchange can defer both). Figures are a year-1 estimate at your 24.0% rate — not tax advice; consult a CPA.
Schools (NCES district)
- District
- Magnolia ISD
- NCES district ID
- 4828740
- Math proficiency
- 42% ▼ -7.00%
- Reading proficiency
- 45% ▼ -4.00%
- Median HH income
- $71,692
- Composite
- 39.46/100
- National rank
- #3958
- State rank
- #247 of 826 in TX
Livability — Magnolia
- Score
- 73/100
- State rank
- #222
- US rank
- #5442
Category grades
Schools grade is shown separately in the Schools card above.
Census & demographics
- County
- Montgomery County · 663,713 people
- City population
- 32,847
- Metro
- Houston-The Woodlands-Sugar Land, TX
- Population (ZIP)
- 44,900
- Household income
- $112,504
- Rent vs Own
- Severe rent burden
- 586.0
Population outlook (Montgomery County) Hauer SSP2
- Today (2025)
- 713,896 people
- By 2030
- 805,263 · +12.8%
- By 2040
- 992,708 · +39.1%
- By 2050
- 1,179,590 · +65.2%
- By 2075
- 1,628,084 · +128.1%
- By 2100
- 1,937,880 · +171.5%
Race, ethnicity, and origin ACS 2023
- Neighborhood character
- Predominantly White (66%)
- Race & ethnicity
- White 66% Hispanic / Latino 25% Two or more races 18% Black 3% Asian 1%
- Hispanic origin (detail)
- Mexican 14% Puerto Rican 1%
- Common ancestry
- Lithuanian 4% Slovak 2% Italian 2%
- Foreign-born
- 11% · Canada, Vietnam
- Languages at home
- 83% English-only · Spanish 15% Other Indo-European 1% German/W. Germanic 1%
Political lean MEDSL · Montgomery
- 2024 margin
- Solid R (+45.5) · D 26.8% · R 72.3%
- 2008→2024 swing
- +7.2pp toward D · 2008: -52.7pp · 2024: -45.5pp
- All cycles
- 2024: R+45.5 2020: R+43.8 2016: R+51.4 2012: R+60.7 2008: R+52.7
Not yet ingested
- Civics
- —
Market trends
- HPI YoY
- ▲ 12.09%
- Current HPI
- 512.87
- Rent YoY
- ▲ 0.32%
- Metro
- Houston-The Woodlands-Sugar Land, TX
- State GDP YoY
- ▲ 3.95%
- F500 in state
- 110
Industry mix (Fortune 500 HQ in TX)
| Industry | F500 HQs | Revenue |
|---|---|---|
| Energy | 16 | $1,198B |
|
||
| Technology | 5 | $198B |
|
||
| Engineering / Construction | 4 | $72B |
|
||
| Energy Services | 3 | $60B |
|
||
| Utilities | 3 | $41B |
|
||
| Healthcare | 2 | $330B |
|
||
Price history
+244.6% since first listed27 events — show timeline
- 2026-05-08 Listed $579,000 HARMLS
- 2026-04-26 Coming Soon $579,000 HARMLS
- 2022-08-04 Listing Removed — HARMLS
- 2022-07-16 Price Changed $3,170 RENT.
- 2022-06-29 Relisted — HARMLS
- 2022-06-22 Listing Removed — HARMLS
- 2022-06-21 Listed $349,900 HARMLS
- 2022-01-15 Pending — HARMLS
- 2022-01-06 Pending — HARMLS
- 2022-01-05 Listing Removed — HARMLS
- 2021-12-27 Relisted — HARMLS
- 2021-10-27 Pending — HARMLS
- 2021-10-22 Price Changed $200,000 HARMLS
- 2021-10-22 Relisted — HARMLS
- 2021-10-15 Pending — HARMLS
- 2021-09-20 Price Changed $230,000 HARMLS
- 2021-09-03 Listed $250,000 HARMLS
- 2015-07-17 Sold (MLS) — HARMLS
- 2015-07-17 Pending — HARMLS
- 2015-06-26 Pending — HARMLS
- 2015-06-16 Pending — HARMLS
- 2015-06-08 Listed $168,000 HARMLS
- 2015-06-04 Pending — HARMLS
- 2015-04-22 Pending — HARMLS
- 2015-04-11 Pending — HARMLS
- 2015-04-11 Listing Removed — HARMLS
- 2015-04-01 Listed $168,000 HARMLS
Property tax history
+9.4%/yrLatest (2025): $4,472 · -5.4% YoY. Source: county tax records.
Cash-flow waterfall
monthlySold comps — $/sqft
last 12 mo · ≤1 miLoading sold comps…