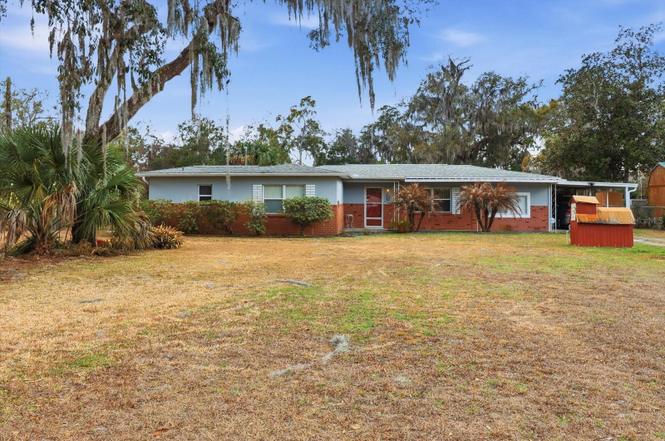
2580 N Bucknell Ter · Hernando, FL
Flood risk 1/10 · Minimal
- FEMA flood zone
- X (unshaded)
- Chance of flooding over 30 yrs
- 0.0%
- Est. flood insurance / yr
- $507 – $1,088
Fire risk 6/10 · Moderate
- Est. fire insurance / yr
- $947 – $1,759
Heat risk 9/10 · Severe
- Hot days now (above 108°F)
- 7 days/yr
- Hot days in 30 yrs
- 23 days/yr
Wind risk 9/10 · Severe
- Chance of severe wind over 30 yrs
- 99.0%
Air-quality risk 1/10 · Minimal
- Unhealthy air days now
- 0 days/yr
- Unhealthy air days in 30 yrs
- 0 days/yr
Risk factors via First Street. Map © Google.
Why this score? — see what drove the C- grade
The composite is a weighted blend of 9 inputs, each scored 0–100. Each bar is that input's sub-score; the figure is the points it added to the 100-point composite (weight × sub-score).
- Cash flow +21.3/30.0
- ARV discount +7.5/15.0
- DSCR +6.8/10.0
- 1% rule +4.3/10.0
- Schools +4.1/10.0
- Livability +3.6/5.0
- Rent growth +2.5/5.0
- Condition / age +2.5/5.0
- Appreciation +0.0/10.0
$225,000
🖨 Deal sheet 📄 Offer letter ✓ Due diligence
Listing remarks MLS
Don't pass the buck on this 3 bedroom, 2 bath home on Bucknell Terrace in Hernando! Full of updates including fresh paint, new appliances, light fixtures, and lots more! Cozy living room, spacious bedrooms, enclosed porch, storage shed - the list goes on - all on a lot shaded by trees. Located close to area amenities. A must-see at a great price - this one won't last long! Inquire today!
Key facts
- Double lot
- Large storage shed
- 0.62 acre lot
Tags
Neighborhood map
What this means for you Summary
Snapshot
- This is a 3-bed/2.0-bath single-family listed at $225k.
Deal economics
- At list price, monthly cash flow is $328 ($4k/yr) — positive.
- The deal already cash-flows at list — no discount required.
- To meet the 1% rule (rent ≥ 1% of price), the offer needs to be $209k (7.1% below list).
- Recommended offer: $209k (7.1% below list) — sets the bar for 1% rule.
- Cap rate 8.0% vs local median 5.6% in Hernando — top-decile yield for the area; either an underpriced asset or a hidden risk that comps aren't pricing in. Stress-test before assuming the spread holds.
Location & tenants
- Location reads 71/100 on livability (#402 in FL) — a middle-class / working-renter tenant base. Strengths: cost of living A+, housing A+, health & safety A+; Watch: amenities F, commute F, employment D-.
- Citrus (rural): math 49% / reading 50% proficiency, ranked #44 of 73 in FL (top 60%) — families likely to look elsewhere, expect single-tenant / working-renter base with shorter leases.
- Market conditions: 444 active listings in the ZIP; 3 comparable units currently listed for rent nearby; rentals at typical pace (median 21d on market — plan ~3-4 weeks tenant-placement turnaround); 2,443 units permitted in Citrus County in 2024 (0 in 5+ unit buildings).
- This rent runs 44% of the median local income ($57k/yr) — at the standard rent-burdened threshold; future hikes will face affordability resistance.
Forward outlook
- Local home prices are declining (-3.0%/yr); year-one equity from $2k of loan paydown is wiped out by about $7k of value loss. Plan a longer hold.
- Citrus County population projected to shrink 10% by 2050 — rents likely to lag national; underwrite the cash flow, not the appreciation.
Negotiation context
- It's been on market 70 days — a 6% lower offer ($212k) is reasonable based on typical stale-listing flexibility.
- 2 sale attempts since 11y ago; this cycle's ask has dropped $14k (6%) from the opening price — seller is motivated, your offer sets the floor, not the list.
- Current owner paid $58k; list at $225k implies a 289% gain — meaningful room to come down on a strong offer.
Risks & watch-outs
- Climate carrying-cost: severe wind risk, 99% chance of damaging wind over 30y; major wildfire risk; extreme-heat days projected 7→23/yr by 2055 (HVAC capex compounding) — expect insurance premiums to compound above CPI over the hold.
Questions for the listing agent
- It's been on market 70 days. Have you received any prior offers? Is the seller open to a 7% concession, seller financing, or rate buy-down credit?
- Built in 1960 — when were the roof, HVAC, electrical panel, plumbing, and water heater last replaced?
- Why hasn't it sold? Are there any deal-killer items the seller is aware of (foundation, flood, title, zoning, code violations)?
- Is there a deadline driving the sale (1031 exchange, divorce, estate, relocation)? That informs how much negotiation room exists.
- What's the average days-on-market for RENTAL listings here right now (not sales)? A rising rental-DOM trend means longer vacancies and softer asking-rent achievability than the comps imply.
- What's the recent tenant-quality profile in this submarket — average credit score on applications, eviction rate, late-payment / NSF rate, and stable-employment percentage? A property-management company in the area should have these aggregated.
- How much new for-sale + rental construction is in the pipeline within 1–3 miles? Heavy new supply typically softens prices + rents 12–24 months out; constrained supply supports both.
Investment metrics
- 1% rule
- 0.93% ✗
- Cap rate
- 8.04%
- Cash-on-cash
- 6.24%
- DSCR
- 1.28
- GRM
- 9.0
CMA / ARV
- ARV (on-the-fly)
- $225,008
- Comps found
- 10
Show comp detail 10 sales within ~0.75 mi
| Address | Dist | Beds/Ba | Sqft | Sold | Price | $/sf | Match |
|---|---|---|---|---|---|---|---|
| 2580 N Bucknell Ter | 0.00mi | 3/2.0 | 1,372 (0%) | 1mo | $225,000 | $164 | 99 |
| 2600 N Bucknell Ter | 0.02mi | 3/2.0 | 1,523 (+11%) | 1mo | $125,000 | $82 | 80 |
| 4880 E Harvard Dr | 0.30mi | 3/2.0 | 1,437 (+5%) | 13mo | $270,000 | $188 | 67 |
| 4785 E Amherst St | 0.12mi | 3/1.5 | 1,512 (+10%) | 16mo | $61,000 | $40 | 62 |
| 4980 E Rugby Trl | 0.56mi | 2/2.0 (-1) | 1,286 (-6%) | 6mo | $199,000 | $155 | 54 |
| 2895 N Tomberlin Pt | 0.45mi | 3/2.0 | 1,559 (+14%) | 4mo | $469,500 | $301 | 53 |
| 4015 E Parsons Point Rd | 0.67mi | 2/2.0 (-1) | 1,348 (-2%) | 11mo | $385,000 | $286 | 52 |
| 3025 N Edwards Island Pt | 0.44mi | 2/2.0 (-1) | 1,331 (-3%) | 22mo | $375,000 | $282 | 51 |
| 4875 E Fordham Pl | 0.38mi | 3/2.0 | 1,500 (+9%) | 22mo | $190,000 | $127 | 49 |
| 2861 N Wheaton Pt | 0.46mi | 3/2.0 | 1,568 (+14%) | 18mo | $190,000 | $121 | 40 |
Match score weights: distance 35% · size 25% · config 20% · recency 20%. Top-matched comps best support the ARV.
Projected returns pro-forma
-3.0% appreciation · 3.0% rent growth · sell at horizon
- IRR
- -6.7%
- Equity multiple
- 0.75×
- Total profit
- $-15,706
- Equity at exit
- $33,548
- IRR
- 2.8%
- Equity multiple
- 1.20×
- Total profit
- $12,742
- Equity at exit
- $19,454
Cash invested: $63,000 (down + closing). Projections, not guarantees.
Landlord ↔ Tenant lean methodology
- Overall (STATE)
- 87 Strongly Landlord-Friendly
- State Florida
- 87 Strongly Landlord-Friendly · R+3
- County
- — inherits STATE
- City
- — inherits STATE
ZIP-level market 34442
- Home prices YoY
- -21.9%
- Active inventory
- 444
- Price-to-rent
- 9.0×
Monthly cashflow live
- Estimated rent
- $2,091 medium interval (Pro) →
- Mortgage (P&I)
- −$1,180
- Tax from tax record
- −$51 /mo · $610/yr
- Insurance
- −$94
- HOA
- −$0
- Vacancy / Maint / Mgmt
- −$439
- Net cashflow
- $328
Break-even live
UW: 25.0% down · 7.5% · 30yr · 1.5% tax · 5.0% vac · 8.0% maint · 8.0% mgmt
Financing live
Cash to close
- Down payment
- $56,250
- Closing costs
- $6,750
- Reserves months
- —
- Total cash needed
- —
Loan-product check · same deal, 3 products live
Conventional
25% down · 7.5% · 30yr
- Down + closing
- —
- Monthly P&I
- —
- Monthly cashflow
- —
- DSCR
- —
- Eligible?
- —
Personal DTI + credit; lowest rate.
DSCR
20% down · 8.5% · 30yr
- Down + closing
- —
- Monthly P&I
- —
- Monthly cashflow
- —
- DSCR
- —
- Eligible?
- —
No personal income docs; deal must DSCR.
Hard money
10% down · 12.0% · 12mo
- Down + closing
- —
- Monthly P&I
- —
- Monthly cashflow
- —
- DSCR
- —
- Eligible?
- —
Short-term bridge; refi at stabilization.
Rent comps 3 comps
| Address | Beds | Baths | Sqft | Rent | $/sqft | DOM | Units | Dist |
|---|---|---|---|---|---|---|---|---|
| 4855 E Princeton Ln Hernando, FL | 4.0 | 2.0 | 1662 | $2,000 | $1.20 | 21d | 1 | 0.25mi |
| 4865 E Princeton Ln Hernando, FL | 4.0 | 2.0 | 1662 | $2,000 | $1.20 | 21d | 1 | 0.25mi |
| 2675 N Canterbury Lake Dr Hernando, FL | 3.0 | 2.0 | 1855 | $2,000 | $1.08 | 21d | 1 | 1.39mi |
Listing history 9 events
-
2026-04-27status Pending
-
2026-03-30price $225,000
-
2026-02-16$239,000 Active
-
2016-03-31soldstatus $57,900 391-char remark
Show marketing remark (391 chars)
Don't pass the buck on this 3 bedroom, 2 bath home on Bucknell Terrace in Hernando! Full of updates including fresh paint, new appliances, light fixtures, and lots more! Cozy living room, spacious bedrooms, enclosed porch, storage shed - the list goes on - all on a lot shaded by trees. Located close to area amenities. A must-see at a great price - this one won't last long! Inquire today!
-
2015-11-30$59,900 391-char remark
Show marketing remark (391 chars)
Don't pass the buck on this 3 bedroom, 2 bath home on Bucknell Terrace in Hernando! Full of updates including fresh paint, new appliances, light fixtures, and lots more! Cozy living room, spacious bedrooms, enclosed porch, storage shed - the list goes on - all on a lot shaded by trees. Located close to area amenities. A must-see at a great price - this one won't last long! Inquire today!
-
2001-11-15soldstatus $59,000
-
2000-12-20soldstatus $45,000
-
1992-12-01soldstatus $45,000
-
1982-01-01soldstatus $38,000
ⓘ Source: listings_history table (triggers on properties + properties_extension) + one-shot
backfill from property_details.listing_events for pre-trigger history.
Tax reassessment forecast FL · Resets to sale price
- Current annual tax
- $610 · $51/mo
- Projected year-2 tax
- $1,868 · $156/mo
- Expected delta
- +$1,258/yr (+$105/mo · 206.4%)
ⓘ Screening estimate from a state-policy table — verify with the county assessor before closing.
Climate risk First Street
- Flood 1/10 Low FEMA zone X (unshaded) · 0% chance over 30 yrs
- Wildfire 6/10 Major
- Heat 9/10 Extreme 7 d/yr ≥108°F today · 23 d/yr by 30 yrs out
- Wind 9/10 Extreme 99% chance of damaging wind over 30 yrs
- Air quality 1/10 Low 0 unhealthy d/yr today · 0 by 30 yrs out
Nearby sold comps map
Loading sold comps map…
Walkable amenities ~0.75 mi
Loading nearby amenities…
Taxation est. · year 1
- Rental income
- $25,094
- − Mortgage interest
- −$12,603
- − Property taxes
- −$610
- − Insurance
- −$1,125
- − Repairs & maintenance
- −$2,008
- − Management
- −$2,008
- − Depreciation
- −$6,545
- Taxable income
- $196
- Est. tax owed @ 24.0%
- −$47
- After-tax cash flow
- $3,884/yr
For passive investors: Depreciation is non-cash, so a rental often shows a tax loss while cash-flowing — sheltering income. Rental losses are passive: they offset passive income freely, and up to $25,000/yr can offset ordinary (W-2) income if you actively participate and your MAGI is under $100k (phasing out to $0 by $150k); unused losses carry forward. On sale, claimed depreciation is recaptured at up to 25%, and gains may owe capital-gains tax (a 1031 exchange can defer both). Figures are a year-1 estimate at your 24.0% rate — not tax advice; consult a CPA.
Schools (NCES district)
- District
- Citrus
- NCES district ID
- 1200270
- Math proficiency
- 49% ▼ -10.00%
- Reading proficiency
- 50% ▼ -6.00%
- Median HH income
- $38,618
- Composite
- 41.28/100
- National rank
- #3519
- State rank
- #44 of 73 in FL
Livability — Hernando
- Score
- 71/100
- State rank
- #402
- US rank
- #7137
Category grades
Schools grade is shown separately in the Schools card above.
Census & demographics
- Census place
- Hernando, FL
- County
- Citrus County · 111,314 people
- City population
- 17,281
- Metro
- Homosassa Springs, FL
- Population (ZIP)
- 17,281
- Household income
- $57,259
- Rent vs Own
- Severe rent burden
- 314.0
Population outlook (Citrus County) Hauer SSP2
- Today (2025)
- 138,622 people
- By 2030
- 136,886 · -1.3%
- By 2040
- 132,009 · -4.8%
- By 2050
- 125,196 · -9.7%
- By 2075
- 108,570 · -21.7%
- By 2100
- 84,454 · -39.1%
Race, ethnicity, and origin ACS 2023
- Neighborhood character
- Predominantly White (90%)
- Race & ethnicity
- White 90% Hispanic / Latino 4% Two or more races 3% Asian 2% Black 2%
- Common ancestry
- Romanian 4% Slovak 4% Lithuanian 3%
- Foreign-born
- 8% · Canada, China, South Korea
- Languages at home
- 93% English-only · Spanish 3% German/W. Germanic 2% Tagalog/Filipino 1%
Political lean MEDSL · Citrus
- 2024 margin
- Solid R (+45.9) · D 26.8% · R 72.6%
- 2008→2024 swing
- -29.8pp toward R · 2008: -16.1pp · 2024: -45.9pp
- All cycles
- 2024: R+45.9 2020: R+41.0 2016: R+39.7 2012: R+21.9 2008: R+16.1
Not yet ingested
- Civics
- —
Market trends
- HPI YoY
- ▼ -76.70%
- Current HPI
- 273.3262
- Rent YoY
- —
- Metro
- Homosassa Springs, FL
- State GDP YoY
- ▲ 3.28%
- F500 in state
- 36
Industry mix (Fortune 500 HQ in FL)
| Industry | F500 HQs | Revenue |
|---|---|---|
| Industrial Technology | 2 | $29B |
|
||
| Insurance | 2 | $17B |
|
||
| Retail | 1 | $60B |
|
||
| Technology Distribution | 1 | $58B |
|
||
| Homebuilding | 1 | $35B |
|
||
| Technology Manufacturing | 1 | $35B |
|
||
Price history
+492.1% since first listed9 events — show timeline
- 2026-04-27 Pending — Stellar MLS as Distributed by MLS Grid
- 2026-03-30 Price Changed $225,000 Stellar MLS as Distributed by MLS Grid
- 2026-02-16 Listed $239,000 Stellar MLS as Distributed by MLS Grid
- 2016-03-31 Sold (MLS) $57,900 RACC
- 2015-11-30 Listed $59,900 RACC
- 2001-11-15 Sold (Public Records) $59,000 Public Records
- 2000-12-20 Sold (Public Records) $45,000 Public Records
- 1992-12-01 Sold (Public Records) $45,000 Public Records
- 1982-01-01 Sold (Public Records) $38,000 Public Records
Property tax history
+1.9%/yrLatest (2025): $610 · +9.8% YoY. Source: county tax records.
Cash-flow waterfall
monthlySold comps — $/sqft
last 12 mo · ≤1 miLoading sold comps…