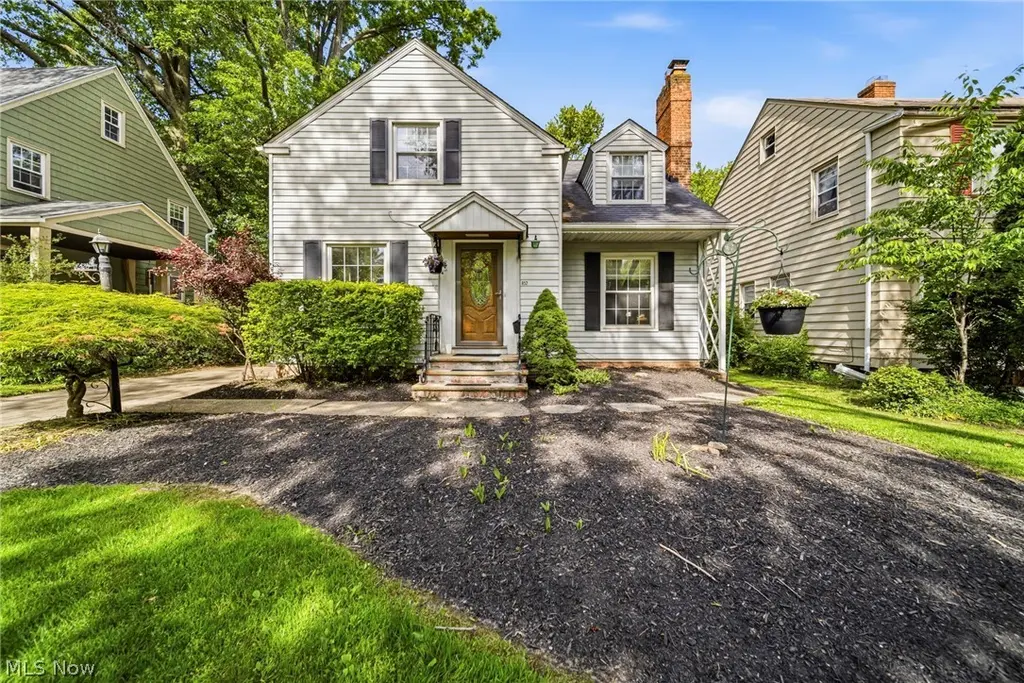
852 Englewood Rd · Cleveland Heights, OH
Flood risk 1/10 · Minimal
- FEMA flood zone
- X (unshaded)
- Chance of flooding over 30 yrs
- 0.0%
- Est. flood insurance / yr
- $473 – $860
Fire risk 1/10 · Minimal
- Est. fire insurance / yr
- $713 – $1,323
Heat risk 2/10 · Minimal
- Hot days now (above 95°F)
- 7 days/yr
- Hot days in 30 yrs
- 15 days/yr
Wind risk 1/10 · Minimal
- Chance of severe wind over 30 yrs
- —
Air-quality risk 3/10 · Minor
- Unhealthy air days now
- 2 days/yr
- Unhealthy air days in 30 yrs
- 5 days/yr
Risk factors via First Street. Map © Google.
Why this score? — see what drove the C- grade
The composite is a weighted blend of 9 inputs, each scored 0–100. Each bar is that input's sub-score; the figure is the points it added to the 100-point composite (weight × sub-score).
- Cash flow +16.6/30.0
- ARV discount +14.1/15.0
- DSCR +5.2/10.0
- 1% rule +5.0/10.0
- Livability +4.5/5.0
- Rent growth +4.2/5.0
- Schools +2.8/10.0
- Condition / age +2.5/5.0
- Appreciation +0.0/10.0
$215,000
🖨 Deal sheet 📄 Offer letter ✓ Due diligence
Listing remarks
Welcome to 852 Englewood Road in the desirable Cleveland Heights community. Meticulously maintained by the same owner for the past 40 years, this five-bedroom, two-bath Colonial truly reflects a pride of ownership and offers an ideal setting for both spacious living and family gatherings. The interior features original hardwood flooring throughout, a living room with a fireplace, and a dining room with a built-in China cabinet. The large family room, which includes a gas fireplace, leads directly to an outdoor deck and patio area that is fully handicapped accessible. The home features a first-floor bedroom, three additional bedrooms on the second floor, and a spacious owners suite with a pr
Key facts
- First-floor bedroom
- Large family room
- 8,102 sq ft lot
Tags
Property features AI
Exterior
- Parking: Detached 2-car garage with garage door opener; Driveway
- Utilities: Public water; Public sewer
- Home design: 2-story house; Above-grade finished living area recorded; Below-grade finished living area recorded
- Construction: Aluminum and vinyl siding; Asphalt/fiberglass roof; Home warranty included; Built (year per public records)
- Exterior features: Deck; Back yard fencing; Paved lot
Interior
- Kitchen: Range; Microwave; Dishwasher; Refrigerator
- Bedrooms: 1 main-level bedroom
- Bathrooms: 2 full bathrooms; 1 bathroom on the main level
- Heating & cooling: Forced air heating; Central air conditioning
- Interior features: Full finished basement; 3 fireplaces (one in basement)
- Laundry & utility: Washer and dryer in basement
Neighborhood map
What this means for you Summary
Snapshot
- This is a 4-bed/1.5-bath single-family listed at $215k.
Deal economics
- At list price, monthly cash flow is $131 ($2k/yr) — positive.
- The deal already cash-flows at list — no discount required.
- To meet the 1% rule (rent ≥ 1% of price), the offer needs to be $214k (0.4% below list).
- Recommended offer: $214k (0.4% below list) — sets the bar for 1% rule.
- Cap rate 7.0% vs local median 4.4% in Cleveland Heights — top-decile yield for the area; either an underpriced asset or a hidden risk that comps aren't pricing in. Stress-test before assuming the spread holds.
Location & tenants
- Location reads 89/100 on livability (#12 in OH, #124 nationally) — a professional / high-income tenant draw. Strengths: amenities A+, commute A+, cost of living A+.
- Cleveland Heights-University Heights City (suburban): math 23% / reading 41% proficiency, ranked #568 of 656 in OH (top 87%) — families likely to look elsewhere, expect single-tenant / working-renter base with shorter leases; 64% free/reduced lunch — lower-income household profile, screen leases tightly.
- Market conditions: Rents rising fast (+6.8%/yr); 148 active listings in the ZIP; 15 comparable units currently listed for rent nearby; rentals at typical pace (median 16d on market — plan ~3-4 weeks tenant-placement turnaround); solid renter incomes; 1,441 units permitted in Cuyahoga County in 2024 (700 in 5+ unit buildings).
- This rent runs 33% of the median local income ($77k/yr) — at the standard rent-burdened threshold; future hikes will face affordability resistance.
Forward outlook
- Local home prices are declining (-3.0%/yr); year-one equity from $1k of loan paydown is wiped out by about $6k of value loss. Plan a longer hold.
- Cuyahoga County population projected to shrink 8% by 2050 — rents likely to lag national; underwrite the cash flow, not the appreciation.
Negotiation context
- Only 5 days on market — expect competitive offers; lowballing is unlikely to land.
- Current owner paid $57k; list at $215k implies a 277% gain — meaningful room to come down on a strong offer.
Risks & watch-outs
- Watch-outs: built in 1946 — expect roof / HVAC / electrical / plumbing capex.
Questions for the listing agent
- Built in 1946 — when were the roof, HVAC, electrical panel, plumbing, and water heater last replaced?
- Is there a deadline driving the sale (1031 exchange, divorce, estate, relocation)? That informs how much negotiation room exists.
- Schools are A-rated — typically a magnet for longer-tenancy family renters. What's the average tenant stay here, and is there a school-zone premium baked into asking?
- What's the average days-on-market for RENTAL listings here right now (not sales)? A rising rental-DOM trend means longer vacancies and softer asking-rent achievability than the comps imply.
- What's the recent tenant-quality profile in this submarket — average credit score on applications, eviction rate, late-payment / NSF rate, and stable-employment percentage? A property-management company in the area should have these aggregated.
- How much new for-sale + rental construction is in the pipeline within 1–3 miles? Heavy new supply typically softens prices + rents 12–24 months out; constrained supply supports both.
Investment metrics
- 1% rule
- 1.00% ✗
- Cap rate
- 7.03%
- Cash-on-cash
- 2.61%
- DSCR
- 1.12
- GRM
- 8.4
CMA / ARV
- ARV (on-the-fly)
- $252,096
- Comps found
- 12
Show comp detail 12 sales within ~0.75 mi
| Address | Dist | Beds/Ba | Sqft | Sold | Price | $/sf | Match |
|---|---|---|---|---|---|---|---|
| 888 Roanoke Rd | 0.11mi | 4/2.5 | 2,257 (-7%) | 3mo | $135,000 | $60 | 76 |
| 3598 Atherstone Rd | 0.50mi | 4/2.0 | 2,307 (-5%) | 7mo | $285,000 | $124 | 61 |
| 3609 Langton Rd | 0.56mi | 4/2.0 | 2,532 (+4%) | 6mo | $185,000 | $73 | 59 |
| 1042 Allston Rd | 0.41mi | 4/2.5 | 2,330 (-4%) | 14mo | $210,000 | $90 | 59 |
| 1117 Allston Rd | 0.52mi | 4/3.5 | 2,484 (+2%) | 7mo | $148,900 | $60 | 58 |
| 3690 Runnymede Blvd | 0.59mi | 3/2.5 (-1) | 2,430 (+0%) | 14mo | $296,000 | $122 | 52 |
| 3917 Princeton Blvd | 0.32mi | 5/3.5 (+1) | 2,700 (+11%) | 12mo | $287,000 | $106 | 43 |
| 3972 Lancaster Rd | 0.57mi | 4/3.0 | 2,156 (-11%) | 9mo | $237,500 | $110 | 42 |
| 1057 Renfield Rd | 0.51mi | 3/2.0 (-1) | 2,178 (-10%) | 15mo | $175,000 | $80 | 40 |
| 3595 Runnymede Blvd | 0.72mi | 4/2.5 | 2,733 (+13%) | 5mo | $329,900 | $121 | 37 |
| 1049 Renfield Rd | 0.49mi | 3/2.5 (-1) | 2,089 (-14%) | 12mo | $215,000 | $103 | 35 |
| 3609 Brinkmore Rd | 0.66mi | 3/3.5 (-1) | 2,204 (-9%) | 15mo | $230,000 | $104 | 28 |
Match score weights: distance 35% · size 25% · config 20% · recency 20%. Top-matched comps best support the ARV.
Projected returns pro-forma
-3.0% appreciation · 6.85% rent growth · sell at horizon
- IRR
- -7.7%
- Equity multiple
- 0.70×
- Total profit
- $-17,791
- Equity at exit
- $32,057
- IRR
- 6.4%
- Equity multiple
- 1.56×
- Total profit
- $33,859
- Equity at exit
- $18,589
Cash invested: $60,200 (down + closing). Projections, not guarantees.
Landlord ↔ Tenant lean methodology
- Overall (STATE)
- 73 Landlord-Friendly
- State Ohio
- 73 Landlord-Friendly · R+6
- County
- — inherits STATE
- City
- — inherits STATE
ZIP-level market 44121
- Rents YoY
- 6.8%
- Active inventory
- 148
- Price-to-rent
- 8.4×
Monthly cashflow live
- Estimated rent
- $2,141 high interval (Pro) →
- Mortgage (P&I)
- −$1,127
- Tax from tax record
- −$343 /mo · $4,122/yr
- Insurance
- −$90
- HOA
- −$0
- Vacancy / Maint / Mgmt
- −$450
- Net cashflow
- $131
Break-even live
UW: 25.0% down · 7.5% · 30yr · 1.5% tax · 5.0% vac · 8.0% maint · 8.0% mgmt
Financing live
Cash to close
- Down payment
- $53,750
- Closing costs
- $6,450
- Reserves months
- —
- Total cash needed
- —
Loan-product check · same deal, 3 products live
Conventional
25% down · 7.5% · 30yr
- Down + closing
- —
- Monthly P&I
- —
- Monthly cashflow
- —
- DSCR
- —
- Eligible?
- —
Personal DTI + credit; lowest rate.
DSCR
20% down · 8.5% · 30yr
- Down + closing
- —
- Monthly P&I
- —
- Monthly cashflow
- —
- DSCR
- —
- Eligible?
- —
No personal income docs; deal must DSCR.
Hard money
10% down · 12.0% · 12mo
- Down + closing
- —
- Monthly P&I
- —
- Monthly cashflow
- —
- DSCR
- —
- Eligible?
- —
Short-term bridge; refi at stabilization.
Rent comps 15 comps
| Address | Beds | Baths | Sqft | Rent | $/sqft | DOM | Units | Dist |
|---|---|---|---|---|---|---|---|---|
| 554 Greenvale Rd Cleveland, OH | 4.0 | 3.0 | 3237 | $2,995 | $0.93 | 14d | 1 | 0.41mi |
| 1082 Hillstone Rd Cleveland, OH | 3.0 | 2.0 | 2376 | $1,695 | $0.71 | 23d | 1 | 0.46mi |
| 1082 Hillstone Rd Unit 1 Cleveland Heights, OH | 3.0 | 1.5 | 2376 | $1,695 | $0.71 | 23d | 1 | 0.46mi |
| 3802 Princeton Blvd Cleveland, OH | 3.0 | 1.5 | 1656 | $2,275 | $1.37 | 1d | 1 | 0.47mi |
| 3917 Bluestone Rd Cleveland, OH | 4.0 | 1.5 | 1700 | $1,650 | $0.97 | 21d | 1 | 0.58mi |
| 3808 Kirkwood Rd Cleveland, OH | 4.0 | 1.5 | 1740 | $2,150 | $1.24 | 14d | 1 | 0.77mi |
| 3430 Winsford Rd Cleveland, OH | 4.0 | 1.5 | 1800 | $1,590 | $0.88 | 16d | 1 | 0.80mi |
| 821 Nela View Rd Cleveland, OH | 4.0 | 2.5 | 2178 | $2,100 | $0.96 | 7d | 1 | 0.80mi |
| 3777 Montevista Rd Cleveland, OH | 5.0 | 2.0 | 2050 | $2,900 | $1.41 | 1d | 1 | 0.81mi |
| 963 Chelston Rd Cleveland, OH | 4.0 | 2.0 | 1974 | $1,950 | $0.99 | 43d | 1 | 0.87mi |
| 1024 Greyton Rd Cleveland, OH | 5.0 | 2.5 | 1800 | $2,500 | $1.39 | 43d | 1 | 0.96mi |
| 910 Dresden Rd Cleveland, OH | 4.0 | 2.0 | 1839 | $1,800 | $0.98 | 16d | 1 | 1.19mi |
| 1420 Villa Dr Cleveland, OH | 3.0 | 2.0 | 1600 | $1,550 | $0.97 | 43d | 1 | 1.24mi |
| 4456 Donna Dr Richmond Heights, OH | 3.0 | 2.5 | 1940 | $2,295 | $1.18 | 1d | 1 | 1.32mi |
| 15801 Hazel Rd Cleveland, OH | 3.0 | 1.5 | 1908 | $1,550 | $0.81 | 16d | 1 | 1.47mi |
Listing history 4 events
-
2026-06-15statusdays on market $215,000 Pending 5 DOM
-
2026-06-13days on market $215,000 Active 4 DOM
-
2026-06-10remarks 699-char remark
-
2026-06-10$215,000 Active 1 DOM
ⓘ Source: listings_history table (triggers on properties + properties_extension) + one-shot
backfill from property_details.listing_events for pre-trigger history.
Tax reassessment forecast OH · Partial reset (capped growth)
- Current annual tax
- $4,122 · $343/mo
- Projected year-2 tax
- $4,122 · $343/mo
- Expected delta
- $0/yr ($0/mo · 0.0%)
ⓘ Screening estimate from a state-policy table — verify with the county assessor before closing.
Climate risk First Street
- Flood 1/10 Low FEMA zone X (unshaded) · 0% chance over 30 yrs
- Wildfire 1/10 Low
- Heat 2/10 Low 7 d/yr ≥95°F today · 15 d/yr by 30 yrs out
- Wind 1/10 Low
- Air quality 3/10 Moderate 2 unhealthy d/yr today · 5 by 30 yrs out
Nearby sold comps map
Loading sold comps map…
Walkable amenities ~0.75 mi
Loading nearby amenities…
Taxation est. · year 1
- Rental income
- $25,697
- − Mortgage interest
- −$12,043
- − Property taxes
- −$4,122
- − Insurance
- −$1,075
- − Repairs & maintenance
- −$2,056
- − Management
- −$2,056
- − Depreciation
- −$6,255
- Taxable loss
- −$1,909
- Est. tax savings @ 24.0%
- +$458
- After-tax cash flow
- $2,032/yr
For passive investors: Depreciation is non-cash, so a rental often shows a tax loss while cash-flowing — sheltering income. Rental losses are passive: they offset passive income freely, and up to $25,000/yr can offset ordinary (W-2) income if you actively participate and your MAGI is under $100k (phasing out to $0 by $150k); unused losses carry forward. On sale, claimed depreciation is recaptured at up to 25%, and gains may owe capital-gains tax (a 1031 exchange can defer both). Figures are a year-1 estimate at your 24.0% rate — not tax advice; consult a CPA.
Schools (NCES district)
- District
- Cleveland Heights-University Heights City
- NCES district ID
- 3904379
- Math proficiency
- 23% ▼ -22.00%
- Reading proficiency
- 41% ▼ -12.00%
- Median HH income
- $53,451
- Composite
- 28.12/100
- National rank
- #6822
- State rank
- #568 of 656 in OH
Livability — Cleveland Heights
- Score
- 89/100
- State rank
- #12
- US rank
- #124
Category grades
Schools grade is shown separately in the Schools card above.
Census & demographics
- Census place
- Cleveland Heights, OH
- County
- Cuyahoga County · 1,090,369 people
- City population
- 32,312
- Metro
- Cleveland-Elyria, OH
- Population (ZIP)
- 32,312
- Household income
- $76,767
- Rent vs Own
- Severe rent burden
- 672.0
Population outlook (Cuyahoga County) Hauer SSP2
- Today (2025)
- 1,244,621 people
- By 2030
- 1,230,093 · -1.2%
- By 2040
- 1,189,108 · -4.5%
- By 2050
- 1,145,706 · -7.9%
- By 2075
- 1,076,557 · -13.5%
- By 2100
- 978,987 · -21.3%
Race, ethnicity, and origin ACS 2023
- Neighborhood character
- Diverse neighborhood (Simpson 0.56)
- Race & ethnicity
- Black 55% White 36% Two or more races 4% Hispanic / Latino 3% Asian 2%
- Common ancestry
- Romanian 3% Italian 2% Scotch-Irish 2%
- Foreign-born
- 5% · Canada, China, India
- Languages at home
- 92% English-only · Spanish 2% Chinese 1% Other Indo-European 1%
Political lean MEDSL · Cuyahoga
- 2024 margin
- Solid D (+31.5) · D 65.4% · R 33.9%
- 2008→2024 swing
- -7.4pp toward R · 2008: 38.9pp · 2024: 31.5pp
- All cycles
- 2024: D+31.5 2020: D+34.1 2016: D+35.0 2012: D+38.7 2008: D+38.9
Not yet ingested
- Civics
- —
Market trends
- HPI YoY
- ▼ -180.15%
- Current HPI
- 173.7405
- Rent YoY
- ▲ 6.85%
- Metro
- Cleveland-Elyria, OH
- State GDP YoY
- ▲ 1.98%
- F500 in state
- 48
Industry mix (Fortune 500 HQ in OH)
| Industry | F500 HQs | Revenue |
|---|---|---|
| Insurance | 3 | $145B |
|
||
| Industrial Machinery | 3 | $49B |
|
||
| Financial Services | 3 | $24B |
|
||
| Consumer Goods | 2 | $93B |
|
||
| Aerospace / Defense | 2 | $47B |
|
||
| Utilities | 2 | $33B |
|
||
Price history
+313.5% since first listed3 events — show timeline
- 2026-06-09 Listed $215,000 MLSNOW
- 1983-10-12 Sold (Public Records) $57,000 Public Records
- 1980-01-30 Sold (Public Records) $52,000 Public Records
Property tax history
+1.4%/yrLatest (2025): $4,122 · -2.7% YoY. Source: county tax records.
Cash-flow waterfall
monthlySold comps — $/sqft
last 12 mo · ≤1 miLoading sold comps…