 Triplex
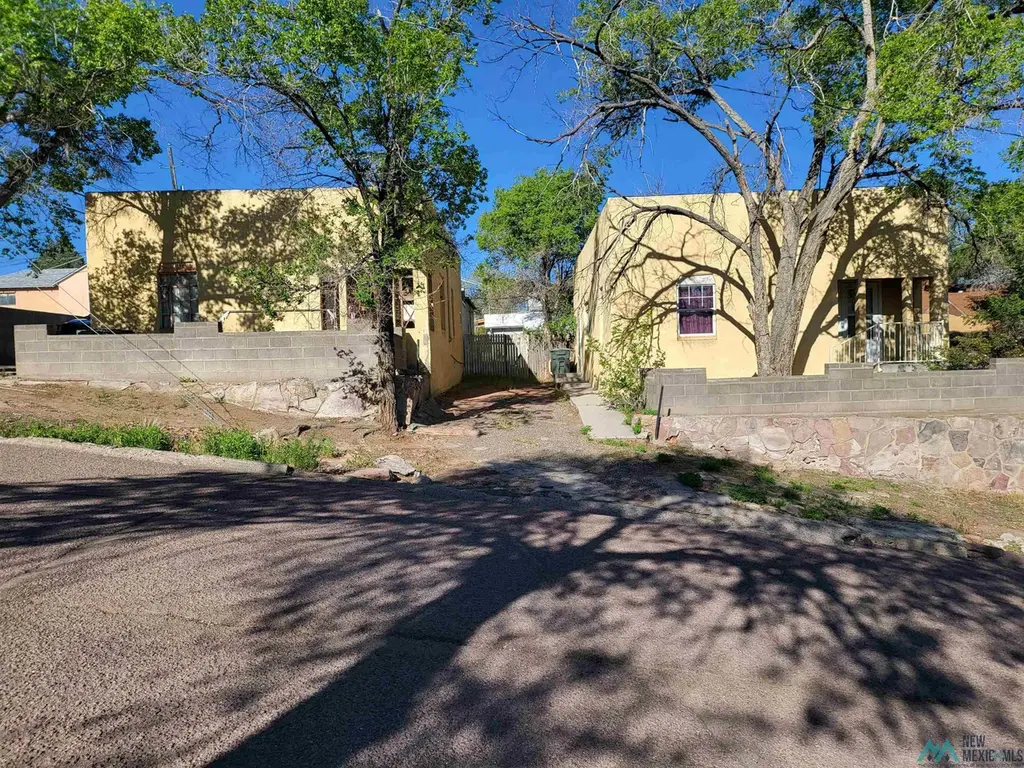
202 S Strong Dr Unit 204 S. Strong & 204 S. Strong Unit B · Gallup, NM
Flood risk 1/10 · Minimal
- FEMA flood zone
- X (unshaded)
- Chance of flooding over 30 yrs
- 0.0%
- Est. flood insurance / yr
- $507 – $1,088
Fire risk 3/10 · Minor
- Est. fire insurance / yr
- $706 – $1,312
Heat risk 3/10 · Minor
- Hot days now (above 90°F)
- 7 days/yr
- Hot days in 30 yrs
- 16 days/yr
Wind risk 1/10 · Minimal
- Chance of severe wind over 30 yrs
- —
Air-quality risk 1/10 · Minimal
- Unhealthy air days now
- 0 days/yr
- Unhealthy air days in 30 yrs
- 0 days/yr
Risk factors via First Street. Map © Google.
Why this score? — see what drove the B- grade
The composite is a weighted blend of 9 inputs, each scored 0–100. Each bar is that input's sub-score; the figure is the points it added to the 100-point composite (weight × sub-score).
- Cash flow +30.0/30.0
- 1% rule +10.0/10.0
- DSCR +10.0/10.0
- ARV discount +7.5/15.0
- Livability +3.6/5.0
- Rent growth +2.5/5.0
- Schools +2.2/10.0
- Condition / age +2.2/5.0
- Appreciation +0.0/10.0
$110,000
🖨 Deal sheet 📄 Offer letter ✓ Due diligence
Multi-family units
County records classify this as Multi-Family (2-4 Unit). Listing-text estimate: 3 units. confirmed
Listing remarks
Great investment opportunity! This 3 unit property has plenty of potential. 202 S. Strong and 204 S. Strong are 2 bedrooms, 1 bathroom units, includes refrigerator and stove. 204 S. Strong Unit B is a 1 bedroom, 1 bathroom unit with the washer and dryer included along with the stove and refrigerator. All units are already occupied!! Located close to the downtown area.
Key facts
- Includes stove
- 5,325 sq ft lot
- Built 1945
Tags
Property features AI
Exterior
- Utilities: Public water; Natural gas available and connected; Electricity connected; Sewer connected
- Home design: Single-story multi-family residence; Multi Unit (2–4 units)
- Exterior features: Fenced lot
Interior
- Kitchen: Free-standing range; Refrigerator
- Flooring: Carpet; Other
- Heating & cooling: No central heating; Ceiling fan cooling
- Interior features: Ceiling fans
Neighborhood map
What this means for you Summary
Snapshot
- This is a 2×2bd/1ba + 1×1bd/1ba units multifamily listed at $110k. Condition is rated fair.
Deal economics
- At list price, monthly cash flow is $1k ($16k/yr) — positive. Per door: $431/mo.
- The deal already cash-flows at list — no discount required.
- Meets the 1% rule at list price ($3k rent vs $110k).
Location & tenants
- Location reads 71/100 on livability (#15 in NM) — a middle-class / working-renter tenant base. Strengths: cost of living A+, housing A+, health & safety A+; Watch: employment D+, schools F, crime F.
- Gallup-Mckinley Cty Schools (rural): math 17% / reading 30% proficiency, ranked #54 of 95 in NM (top 57%) — low school quality limits family demand, transient renter base, plan for 1-2y turnover; 84% free/reduced lunch — lower-income household profile, screen leases tightly.
- Market conditions: 96 active listings in the ZIP; 1 units permitted in McKinley County in 2024 (0 in 5+ unit buildings).
Forward outlook
- Local home prices are declining (-3.0%/yr); year-one equity from $761 of loan paydown is wiped out by about $3k of value loss. Plan a longer hold.
- McKinley County population projected at +36% by 2050 — long-run rental-demand tailwind backs the buy-and-hold thesis.
- At projected returns (-3.0% appreciation + 3.0% rent growth), your $31k cash investment doubles in ~3 years — after that, you're playing with house money.
Negotiation context
- Only 5 days on market — expect competitive offers; lowballing is unlikely to land.
Risks & watch-outs
- Watch-outs: built in 1945 — expect roof / HVAC / electrical / plumbing capex.
Questions for the listing agent
- Can we see the unit-by-unit rent roll, current vacancy, and any below-market leases? What's the average tenancy length?
- What capital expenditures (roof, boiler, parking lot, exteriors) have been made in the last 5 years, and what's planned in the next 2?
- Have any recent inspections been done? Can we get a copy of the seller's disclosures and any deferred-maintenance estimates?
- Built in 1945 — when were the roof, HVAC, electrical panel, plumbing, and water heater last replaced?
- Is there a deadline driving the sale (1031 exchange, divorce, estate, relocation)? That informs how much negotiation room exists.
- Schools are F-rated, which usually means shorter tenancies and higher turnover. Who's the typical renter profile here, and what's been the actual vacancy rate?
- Crime grade is F in this area — have there been break-ins, vandalism, or insurance claims at this property in the last 3 years? What carrier currently insures it and at what premium?
- What's the average days-on-market for RENTAL listings here right now (not sales)? A rising rental-DOM trend means longer vacancies and softer asking-rent achievability than the comps imply.
- What's the recent tenant-quality profile in this submarket — average credit score on applications, eviction rate, late-payment / NSF rate, and stable-employment percentage? A property-management company in the area should have these aggregated.
- How much new apartment / multifamily construction is in the pipeline within 1–3 miles? Heavy new supply (>2% of stock underway) typically softens rents 12–24 months out; light construction supports rent growth.
Investment metrics
- 1% rule
- 2.36% ✓
- Cap rate
- 20.40%
- Cash-on-cash
- 50.38%
- DSCR
- 3.24
- GRM
- 3.5
CMA / ARV
No comps found within radius.
Projected returns pro-forma
-3.0% appreciation · 3.0% rent growth · sell at horizon
- IRR
- 48.1%
- Equity multiple
- 3.10×
- Total profit
- $64,568
- Equity at exit
- $16,401
- IRR
- 53.8%
- Equity multiple
- 6.27×
- Total profit
- $162,427
- Equity at exit
- $9,511
Cash invested: $30,800 (down + closing). Projections, not guarantees.
Landlord ↔ Tenant lean methodology
- Overall (STATE)
- 55 Moderately Landlord-Leaning
- State New Mexico
- 55 Moderately Landlord-Leaning · D+3
- County
- — inherits STATE
- City
- — inherits STATE
ZIP-level market 87301
- Active inventory
- 96
- Price-to-rent
- 10.4×
Monthly cashflow live
- Estimated rent
- $2,599 medium interval (Pro) →
- Mortgage (P&I)
- −$577
- Tax est. 1.5%
- −$138 /mo · $1,650/yr
- Insurance
- −$46
- HOA
- −$0
- Vacancy / Maint / Mgmt
- −$546
- Net cashflow
- $1,293
Break-even live
3-unit breakdown (identical units grouped — click to expand)
| Units | Beds | Baths | Est. rent |
|---|---|---|---|
| 2× units | 2 | 1 | $1,756 |
| #1 | 2 | 1 | $878 |
| #2 | 2 | 1 | $878 |
| 1× unit | 1 | 1 | $842 |
| Total (3 units) | $2,599 | ||
UW: 25.0% down · 7.5% · 30yr · 1.5% tax · 5.0% vac · 8.0% maint · 8.0% mgmt
Financing live
Cash to close
- Down payment
- $27,500
- Closing costs
- $3,300
- Reserves months
- —
- Total cash needed
- —
Loan-product check · same deal, 3 products live
Conventional
25% down · 7.5% · 30yr
- Down + closing
- —
- Monthly P&I
- —
- Monthly cashflow
- —
- DSCR
- —
- Eligible?
- —
Personal DTI + credit; lowest rate.
DSCR
20% down · 8.5% · 30yr
- Down + closing
- —
- Monthly P&I
- —
- Monthly cashflow
- —
- DSCR
- —
- Eligible?
- —
No personal income docs; deal must DSCR.
Hard money
10% down · 12.0% · 12mo
- Down + closing
- —
- Monthly P&I
- —
- Monthly cashflow
- —
- DSCR
- —
- Eligible?
- —
Short-term bridge; refi at stabilization.
Listing history 2 events
-
2026-05-18status Pending
-
2026-05-05$110,000 Active
ⓘ Source: listings_history table (triggers on properties + properties_extension) + one-shot
backfill from property_details.listing_events for pre-trigger history.
Climate risk First Street
- Flood 1/10 Low FEMA zone X (unshaded) · 0% chance over 30 yrs
- Wildfire 3/10 Moderate
- Heat 3/10 Moderate 7 d/yr ≥90°F today · 16 d/yr by 30 yrs out
- Wind 1/10 Low
- Air quality 1/10 Low 0 unhealthy d/yr today · 0 by 30 yrs out
Nearby sold comps map
Loading sold comps map…
Walkable amenities ~0.75 mi
Loading nearby amenities…
Taxation est. · year 1
- Rental income
- $31,188
- − Mortgage interest
- −$6,162
- − Property taxes
- −$1,650
- − Insurance
- −$550
- − Repairs & maintenance
- −$2,495
- − Management
- −$2,495
- − Depreciation
- −$3,200
- Taxable income
- $14,636
- Est. tax owed @ 24.0%
- −$3,513
- After-tax cash flow
- $12,004/yr
For passive investors: Depreciation is non-cash, so a rental often shows a tax loss while cash-flowing — sheltering income. Rental losses are passive: they offset passive income freely, and up to $25,000/yr can offset ordinary (W-2) income if you actively participate and your MAGI is under $100k (phasing out to $0 by $150k); unused losses carry forward. On sale, claimed depreciation is recaptured at up to 25%, and gains may owe capital-gains tax (a 1031 exchange can defer both). Figures are a year-1 estimate at your 24.0% rate — not tax advice; consult a CPA.
Condition & rehab AI · 14 photos
This property requires moderate repairs and maintenance to improve its condition and value. Focus on cleaning, organizing, and repairing the exterior and landscaping to enhance both resale and rental appeal.
Repairs flagged
- Minor Kitchen countertops — Cluttered and disorganized, minor cleaning needed
- Minor Bathroom countertops — Cluttered and disorganized, minor cleaning needed
- Moderate Fencing — Weathered and in poor condition, needs repair or replacement
- Moderate Landscaping — Overgrown and unkempt, needs trimming and maintenance
Value-add opportunities
- Both Clean and organize kitchen and bathrooms — Improved appearance and functionality, enhances both resale and rental appeal
- Both Repair or replace fencing — Enhances curb appeal and safety, improves both resale and rental value
- Both Trim and maintain landscaping — Enhances curb appeal and property value, improves both resale and rental appeal
Renovation cost estimate screening
| Repair item | Severity | Est. cost |
|---|---|---|
| Kitchen countertops · Cluttered and disorganized, minor cleaning needed | Minor | $500–3,000 |
| Bathroom countertops · Cluttered and disorganized, minor cleaning needed | Minor | $500–3,000 |
| Fencing · Weathered and in poor condition, needs repair or replacement | Moderate | $3,000–15,000 |
| Landscaping · Overgrown and unkempt, needs trimming and maintenance | Moderate | $3,000–15,000 |
| Total estimated repair cost · 4 items | $7,000–36,000 |
Value-add ROI direction
- Both Clean and organize kitchen and bathrooms — Improved appearance and functionality, enhances both resale and rental appeal ↑
- Both Repair or replace fencing — Enhances curb appeal and safety, improves both resale and rental value ↑
- Both Trim and maintain landscaping — Enhances curb appeal and property value, improves both resale and rental appeal ↑
ⓘ Cost ranges are severity-bucket heuristics (US national rule-of-thumb). Get contractor quotes + a written scope before underwriting a rehab budget.
Schools (NCES district)
- District
- Gallup-Mckinley Cty Schools
- NCES district ID
- 3501110
- Math proficiency
- 17% —
- Reading proficiency
- 30% —
- Median HH income
- $30,298
- Composite
- 22.01/100
- National rank
- #13541
- State rank
- #54 of 95 in NM
Livability — Gallup
- Score
- 71/100
- State rank
- #15
- US rank
- #6953
Category grades
Schools grade is shown separately in the Schools card above.
Census & demographics
- Census place
- Gallup, NM
- City population
- 21,981
- Population (ZIP)
- 21,981
Population outlook (McKinley County) Hauer SSP2
- Today (2025)
- 88,386 people
- By 2030
- 94,451 · +6.9%
- By 2040
- 107,369 · +21.5%
- By 2050
- 119,937 · +35.7%
- By 2075
- 148,818 · +68.4%
- By 2100
- 160,771 · +81.9%
Race, ethnicity, and origin ACS 2023
- Neighborhood character
- Highly diverse neighborhood (Simpson 0.91)
- Race & ethnicity
- Native American 51% Hispanic / Latino 24% White 17% Two or more races 10% Asian 3% Black 1%
- Hispanic origin (detail)
- Mexican 19%
- Common ancestry
- Lithuanian 1% Italian 1% Iranian 1%
- Foreign-born
- 6% · Canada
- Languages at home
- 66% English-only · Spanish 11% Other Indo-European 2% Tagalog/Filipino 2%
Political lean MEDSL · McKinley
- 2024 margin
- Strong D (+24.5) · D 60.7% · R 36.2% · Other 3.1%
- 2008→2024 swing
- -19.4pp toward R · 2008: 43.9pp · 2024: 24.5pp
- All cycles
- 2024: D+24.5 2020: D+38.6 2016: D+39.8 2012: D+46.6 2008: D+43.9
Not yet ingested
- Civics
- —
Market trends
- HPI YoY
- ▼ -77.73%
- Current HPI
- 143.4008
- Rent YoY
- —
- Metro
- —
- State GDP YoY
- —
- F500 in state
- 0
Price history
2 events — show timeline
- 2026-05-18 Pending — NMMLS
- 2026-05-05 Listed $110,000 NMMLS
Cash-flow waterfall
monthlySold comps — $/sqft
last 12 mo · ≤1 miLoading sold comps…