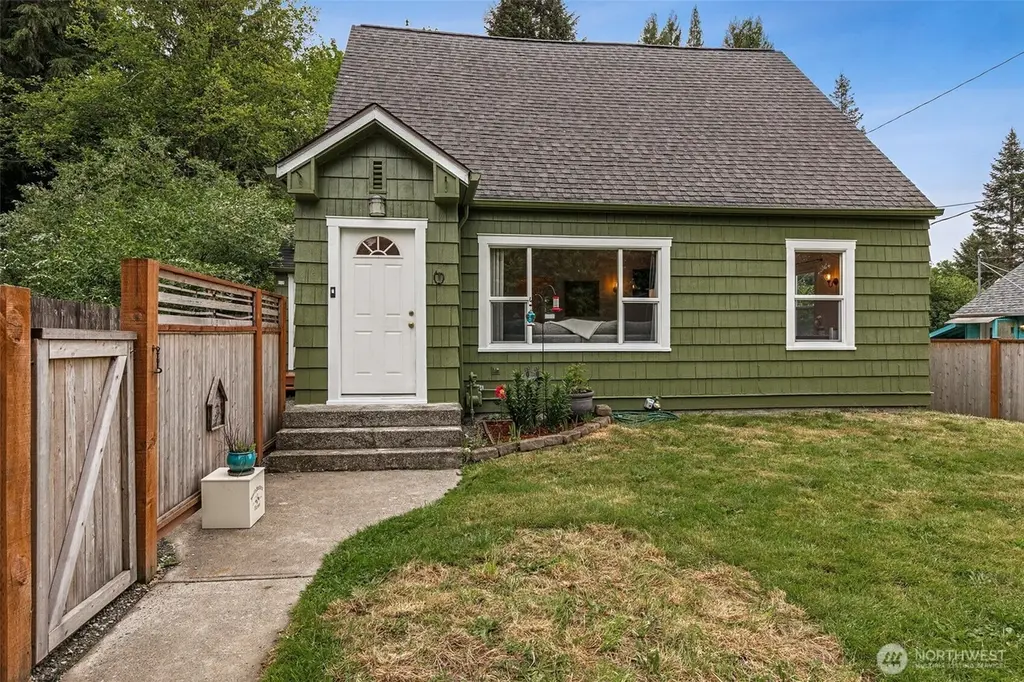
1022 Brawne Ave NW · Olympia, WA
Flood risk 1/10 · Minimal
- FEMA flood zone
- X (unshaded)
- Chance of flooding over 30 yrs
- 0.0%
- Est. flood insurance / yr
- $473 – $860
Fire risk 1/10 · Minimal
- Est. fire insurance / yr
- $604 – $1,122
Heat risk 3/10 · Minor
- Hot days now (above 89°F)
- 7 days/yr
- Hot days in 30 yrs
- 14 days/yr
Wind risk 1/10 · Minimal
- Chance of severe wind over 30 yrs
- —
Air-quality risk 6/10 · Moderate
- Unhealthy air days now
- 6 days/yr
- Unhealthy air days in 30 yrs
- 7 days/yr
Risk factors via First Street. Map © Google.
Why this score? — see what drove the D grade
The composite is a weighted blend of 9 inputs, each scored 0–100. Each bar is that input's sub-score; the figure is the points it added to the 100-point composite (weight × sub-score).
- ARV discount +10.2/15.0
- Appreciation +10.0/10.0
- Schools +6.2/10.0
- Livability +4.2/5.0
- Cash flow +3.8/30.0
- Rent growth +3.3/5.0
- Condition / age +2.5/5.0
- 1% rule +0.0/10.0
- DSCR +0.0/10.0
$589,000
🖨 Deal sheet 📄 Offer letter ✓ Due diligence
Listing remarks
Don’t miss this one-of-a-kind Westside charmer! This sunny, south-facing bungalow offers 1,452 SF plus a 400 SF detached den/flex space and an 839 SF basement. Gorgeous Fir floors span the main-level living room, dining room, and office. The refreshed kitchen features an eating bar, new quartz counters, and updated lighting fixtures throughout. Main floor also includes a full bath and laundry/mud room off the kitchen. Upstairs you’ll find 3 generously sized bedrooms w/ abundant ceiling height and windows, plus a Jack & Jill 3/4 bath with new quartz counters. Peek-a-boo bay and mountain views from upper bedroom! Big deck backs to a nature preserve and leads to the detached
Key facts
- New quartz counters
- Full bath
- Refreshed kitchen
Tags
Property features AI
Finance
- Other: Buyer brokerage compensation: 2.5%
- Financial info: Listing terms: Cash or Conventional
Exterior
- Parking: Uncovered parking for 3 vehicles; Driveway
- Security: Fully fenced
- Utilities: Public water; Sewer available; Natural gas energy source; Natural gas water heater in basement; Power by PSE; Cable (Xfinity); Internet (Xfinity)
- Home design: Single family residence; Two-story house with basement; Main level entry; South-facing; Has view
- Construction: Wood construction; Composition roof; Block foundation; Built on lot
- Exterior features: Deck; Patio; Cabana/Gazebo; Fully fenced yard; Garden space; Cable TV available; Gas available
Interior
- Kitchen: Dishwasher; Stove/Range; Refrigerator
- Bedrooms: 3 bedrooms on the upper level
- Flooring: Ceramic tile; Softwood; Vinyl; Carpet
- Bathrooms: 1 full bath; 1 three-quarter bath; 1 bathtub; 2 showers; Main level full bathroom
- Heating & cooling: Forced air heating; No central cooling
- Interior features: Ceiling fan(s); French doors; Water heater in basement
- Laundry & utility: Washer; Dryer
Neighborhood map
What this means for you Summary
Snapshot
- This is a 3-bed/2.0-bath single-family listed at $589k.
Deal economics
- At list price, monthly cash flow is $-2k ($-20k/yr) — negative.
- To cash-flow at today's rent, offer at most $289k (51.0% below list).
- To meet the 1% rule (rent ≥ 1% of price), the offer needs to be $219k (62.7% below list).
- Recommended offer: $219k (62.7% below list) — sets the bar for 1% rule.
Location & tenants
- Location reads 83/100 on livability (#58 in WA, #1,036 nationally) — a professional / high-income tenant draw. Strengths: amenities A+, commute A+, health & safety A+; Watch: crime F, cost of living D-.
- Olympia School District (urban): math 66% / reading 75% proficiency, ranked #17 of 291 in WA (top 6%) — strong family-tenant draw, lease renewals of 3-5y typical.
- Zoned schools: Garfield Elementary School (351 students, 65% FRL); Capital High School (1,326 students, 38% FRL) — zoned schools average 51% FRL vs 25% district-wide (26 pts higher); higher-poverty schools than district average — tighter screening recommended.
- Market conditions: Rents rising (+3.2%/yr); 304 active listings in the ZIP; 27 comparable units currently listed for rent nearby; rentals at typical pace (median 21d on market — plan ~3-4 weeks tenant-placement turnaround); solid renter incomes; 1,222 units permitted in Thurston County in 2024 (508 in 5+ unit buildings).
Forward outlook
- In year one you build about $63k of equity ($4k loan paydown + $59k appreciation (10.0% local appreciation)).
- Thurston County population projected at +27% by 2050 — long-run rental-demand tailwind backs the buy-and-hold thesis.
- By year 2, paydown + projected appreciation supports a ~$101k cash-out refi (75% LTV) — recoverable capital for the next deal without selling this one.
Negotiation context
- It's been on market 34 days — a 3% lower offer ($571k) is reasonable based on typical stale-listing flexibility.
- 4 sale attempts since 23y ago with the ask held roughly flat each time — persistent listings suggest the price (not the market) is what's stuck; bring a comps-based counter.
- Current owner paid $335k; list at $589k implies a 76% gain — meaningful room to come down on a strong offer.
Risks & watch-outs
- Watch-outs: built in 1934 — expect roof / HVAC / electrical / plumbing capex.
Questions for the listing agent
- What do current leases actually rent for vs. the listed asking? Can we see a recent rent roll and the last 12 months of T-12 income?
- It's been on market 34 days. Have you received any prior offers? Is the seller open to a 63% concession, seller financing, or rate buy-down credit?
- Built in 1934 — when were the roof, HVAC, electrical panel, plumbing, and water heater last replaced?
- Is there a deadline driving the sale (1031 exchange, divorce, estate, relocation)? That informs how much negotiation room exists.
- Schools are A-rated — typically a magnet for longer-tenancy family renters. What's the average tenant stay here, and is there a school-zone premium baked into asking?
- Crime grade is F in this area — have there been break-ins, vandalism, or insurance claims at this property in the last 3 years? What carrier currently insures it and at what premium?
- The area grade is low — what's the realistic commute time and amenity access for the typical tenant pool here? Any planned neighborhood developments (good or bad) we should know about?
- What's the average days-on-market for RENTAL listings here right now (not sales)? A rising rental-DOM trend means longer vacancies and softer asking-rent achievability than the comps imply.
- What's the recent tenant-quality profile in this submarket — average credit score on applications, eviction rate, late-payment / NSF rate, and stable-employment percentage? A property-management company in the area should have these aggregated.
- How much new for-sale + rental construction is in the pipeline within 1–3 miles? Heavy new supply typically softens prices + rents 12–24 months out; constrained supply supports both.
Investment metrics
- 1% rule
- 0.37% ✗
- Cap rate
- 2.83%
- Cash-on-cash
- -12.37%
- DSCR
- 0.45
- GRM
- 22.4
CMA / ARV
- ARV (median comp)
- $627,064
- List price
- $589,000
- Delta
- -6.07%
- Verdict
- FAIR
- Comps
- 20 within 1.0 mi
Show comp detail 12 sales within ~0.75 mi
| Address | Dist | Beds/Ba | Sqft | Sold | Price | $/sf | Match |
|---|---|---|---|---|---|---|---|
| 1108 Brawne Ave NW | 0.02mi | 2/2.0 (-1) | 1,368 (-6%) | 12mo | $440,000 | $322 | 74 |
| 1505 Dickinson Ave NW | 0.23mi | 3/2.0 | 1,250 (-14%) | 1mo | $555,000 | $444 | 65 |
| 1818 Madison Ave NW | 0.44mi | 3/2.0 | 1,336 (-8%) | 9mo | $538,900 | $403 | 58 |
| 1805 Garfield Ave NW | 0.56mi | 3/2.0 | 1,508 (+4%) | 16mo | $495,000 | $328 | 54 |
| 1956 Orchard Dr NW | 0.74mi | 3/1.5 | 1,451 (-0%) | 12mo | $515,000 | $355 | 54 |
| 103 Cushing St NW | 0.73mi | 3/2.0 | 1,433 (-1%) | 16mo | $500,000 | $349 | 51 |
| 1917 Giles Ave NW | 0.44mi | 3/2.5 | 1,608 (+11%) | 12mo | $614,500 | $382 | 49 |
| 222 Milroy St NW | 0.56mi | 3/1.0 | 1,576 (+8%) | 10mo | $475,000 | $301 | 47 |
| 1421 Thomas St NW | 0.41mi | 3/2.0 | 1,660 (+14%) | 14mo | $530,000 | $319 | 46 |
| 303 Decatur St NW | 0.51mi | 2/1.0 (-1) | 1,290 (-11%) | 8mo | $400,000 | $310 | 42 |
| 221 Thomas St N | 0.52mi | 2/1.0 (-1) | 1,288 (-11%) | 12mo | $449,000 | $349 | 38 |
| 2117 Conger Ave NW | 0.55mi | 3/1.0 | 1,296 (-11%) | 18mo | $410,000 | $316 | 38 |
Match score weights: distance 35% · size 25% · config 20% · recency 20%. Top-matched comps best support the ARV.
Projected returns pro-forma
10.0% appreciation · 3.16% rent growth · sell at horizon
- IRR
- 15.6%
- Equity multiple
- 2.29×
- Total profit
- $212,464
- Equity at exit
- $530,618
- IRR
- 15.2%
- Equity multiple
- 5.31×
- Total profit
- $710,864
- Equity at exit
- $1,144,297
Cash invested: $164,920 (down + closing). Projections, not guarantees.
Landlord ↔ Tenant lean methodology
- Overall (STATE)
- 28 Tenant-Leaning
- State Washington
- 28 Tenant-Leaning · D+8
- County
- — inherits STATE
- City
- — inherits STATE
ZIP-level market 98502
- Home prices YoY
- 1.8%
- Rents YoY
- 3.2%
- Active inventory
- 304
- Price-to-rent
- 22.4×
Monthly cashflow live
- Estimated rent
- $2,195 high interval (Pro) →
- Mortgage (P&I)
- −$3,089
- Tax from tax record
- −$100 /mo · $1,202/yr
- Insurance
- −$245
- HOA
- −$0
- Vacancy / Maint / Mgmt
- −$461
- Net cashflow
- $-1,701
Break-even live
UW: 25.0% down · 7.5% · 30yr · 1.5% tax · 5.0% vac · 8.0% maint · 8.0% mgmt
Financing live
Cash to close
- Down payment
- $147,250
- Closing costs
- $17,670
- Reserves months
- —
- Total cash needed
- —
Loan-product check · same deal, 3 products live
Conventional
25% down · 7.5% · 30yr
- Down + closing
- —
- Monthly P&I
- —
- Monthly cashflow
- —
- DSCR
- —
- Eligible?
- —
Personal DTI + credit; lowest rate.
DSCR
20% down · 8.5% · 30yr
- Down + closing
- —
- Monthly P&I
- —
- Monthly cashflow
- —
- DSCR
- —
- Eligible?
- —
No personal income docs; deal must DSCR.
Hard money
10% down · 12.0% · 12mo
- Down + closing
- —
- Monthly P&I
- —
- Monthly cashflow
- —
- DSCR
- —
- Eligible?
- —
Short-term bridge; refi at stabilization.
Rent comps 27 comps
| Address | Beds | Baths | Sqft | Rent | $/sqft | DOM | Units | Dist |
|---|---|---|---|---|---|---|---|---|
| 1626 Madison Ave NW Olympia, WA | 2.0 | 2.0 | 1064 | $2,100 | $1.97 | 13d | 1 | 0.35mi |
| 2137 Conger Ave NW Unit C Olympia, WA | 3.0 | 2.0 | 1248 | $1,895 | $1.52 | 43d | 1 | 0.58mi |
| 2137 Conger Ave NW Unit A Olympia, WA | 3.0 | 2.0 | 1248 | $1,995 | $1.60 | 43d | 1 | 0.58mi |
| 125 Decatur St NW Olympia, WA | 2.0 | 1.0 | 980 | $1,900 | $1.94 | 21d | 1 | 0.63mi |
| 121 Decatur St NW Olympia, WA | 2.0 | 1.0 | 1000 | $1,695 | $1.70 | 21d | 1 | 0.64mi |
| 120 Water St NW Unit 412 Olympia, WA | 2.0 | 2.0 | 875 | $3,100 | $3.54 | 43d | 1 | 0.78mi |
| 410 5th Avenue SW Olympia, WA | 2.0 | 1.0 | 687 | $5,150 | $7.50 | 13d | 18 | 0.79mi |
| 600 Black Lake Blvd SW Olympia, WA | 1.0–2.0 | 1.0 | 851 | $1,600 | $1.88 | 13d | 23 | 0.83mi |
| 300 Kenyon St NW Olympia, WA | 1.0–2.0 | 1.0–2.0 | 878 | $1,995 | $2.27 | 13d | 6 | 0.83mi |
| 123 4th Ave W Unit 701 Olympia, WA | 2.0 | 1.0 | 1022 | $2,050 | $2.01 | 13d | 1 | 0.85mi |
| 1829 E End St NW Unit B Olympia, WA | 2.0 | 1.0 | 1100 | $2,100 | $1.91 | 43d | 1 | 0.91mi |
| 2800 Limited Ln NW Olympia, WA | 1.0–2.0 | 1.0–2.0 | 775 | $1,503 | $1.94 | 13d | 4 | 0.97mi |
| 2006 Burbank Ave NW Unit NA Olympia, WA | 4.0 | 3.0 | 1750 | $2,650 | $1.51 | 43d | 1 | 0.97mi |
| 2010 8th Ct SW Olympia, WA | 2.0 | 2.0 | 1072 | $2,295 | $2.14 | 21d | 1 | 0.99mi |
| 510 State Ave NE Olympia, WA | 2.0 | 1.0–2.0 | 706 | $2,100 | $2.97 | 13d | 6 | 1.05mi |
| 1000 Fern St SW Olympia, WA | 1.0–2.0 | 1.0–2.0 | 892 | $2,281 | $2.56 | 13d | 8 | 1.12mi |
| 1009 Columbia St SW Olympia, WA | 2.0 | 1.0 | 1150 | $2,195 | $1.91 | 13d | 1 | 1.14mi |
| 330 E Bay Dr NE Unit 330 Olympia, WA | 2.0 | 2.5 | 1360 | $2,450 | $1.80 | 43d | 1 | 1.14mi |
| 715 Adams St SE Olympia, WA | 2.0 | 1.0 | 900 | $1,575 | $1.75 | 21d | 1 | 1.15mi |
| 2031 Berry St NE Olympia, WA | 2.0 | 3.0 | 1510 | $2,595 | $1.72 | 21d | 1 | 1.22mi |
| 215 10th Ave SE Olympia, WA | 2.0 | 1.0 | 900 | $1,600 | $1.78 | 21d | 1 | 1.23mi |
| 1220 Fern St SW Olympia, WA | 2.0 | 2.0 | 900 | $1,850 | $2.06 | 43d | 2 | 1.26mi |
| 1314 Quince St NE Olympia, WA | 2.0 | 1.0 | 1079 | $2,200 | $2.04 | 43d | 1 | 1.27mi |
| 401 Union Ave SE Olympia, WA | 2.0 | 1.0–2.0 | 712 | $2,250 | $3.16 | 13d | 27 | 1.32mi |
| 1721 Quince St NE #1719 Olympia, WA | 3.0 | 2.5 | 1315 | $2,600 | $1.98 | 43d | 1 | 1.33mi |
| 1309 Fern St SW Olympia, WA | 1.0–3.0 | 1.0–2.0 | 802 | $2,206 | $2.75 | 13d | 2 | 1.38mi |
| 1106 5th Ave SE Unit C Olympia, WA | 2.0 | 1.5 | 984 | $1,800 | $1.83 | 43d | 1 | 1.42mi |
Listing history 26 events
-
2026-06-18days on market $589,000 Active 34 DOM
-
2026-06-17days on market $589,000 Active 33 DOM
-
2026-06-16days on market $589,000 Active 32 DOM
-
2026-06-15days on market $589,000 Active 31 DOM
-
2026-06-14days on market $589,000 Active 29 DOM
-
2026-06-13days on market $589,000 Active 28 DOM
-
2026-06-10days on market $589,000 Active 26 DOM
-
2026-06-09days on market $589,000 Active 25 DOM
-
2026-06-08days on market $589,000 Active 24 DOM
-
2026-06-07days on market $589,000 Active 23 DOM
-
2026-06-05days on market $589,000 Active 20 DOM
-
2026-06-02days on market $589,000 Active 18 DOM
-
2026-06-01days on market $589,000 Active 17 DOM
-
2026-05-31days on market $589,000 Active 16 DOM
-
2026-05-30days on market $589,000 Active 15 DOM
-
2026-05-15$589,000 Active
-
2019-07-24soldstatus $335,000 Sold
-
2019-07-24soldstatus $335,000
-
2019-06-18status Pending
-
2019-06-15$325,000 Active
-
2005-06-29soldstatus $256,000
-
2005-06-28soldstatus $256,000
-
2005-05-04$257,000
-
2003-04-24soldstatus $182,000
-
2003-04-22soldstatus $182,000
-
2003-02-18$185,000
ⓘ Source: listings_history table (triggers on properties + properties_extension) + one-shot
backfill from property_details.listing_events for pre-trigger history.
Tax reassessment forecast WA · Resets to sale price
- Current annual tax
- $1,202 · $100/mo
- Projected year-2 tax
- $5,772 · $481/mo
- Expected delta
- +$4,570/yr (+$381/mo · 380.3%)
ⓘ Screening estimate from a state-policy table — verify with the county assessor before closing.
Climate risk First Street
- Flood 1/10 Low FEMA zone X (unshaded) · 0% chance over 30 yrs
- Wildfire 1/10 Low
- Heat 3/10 Moderate 7 d/yr ≥89°F today · 14 d/yr by 30 yrs out
- Wind 1/10 Low
- Air quality 6/10 Major 6 unhealthy d/yr today · 7 by 30 yrs out
Nearby sold comps map
Loading sold comps map…
Walkable amenities ~0.75 mi
Loading nearby amenities…
Taxation est. · year 1
- Rental income
- $26,334
- − Mortgage interest
- −$32,993
- − Property taxes
- −$1,202
- − Insurance
- −$2,945
- − Repairs & maintenance
- −$2,107
- − Management
- −$2,107
- − Depreciation
- −$17,135
- Taxable loss
- −$32,154
- Est. tax savings @ 24.0%
- +$7,717
- After-tax cash flow
- $-12,691/yr
For passive investors: Depreciation is non-cash, so a rental often shows a tax loss while cash-flowing — sheltering income. Rental losses are passive: they offset passive income freely, and up to $25,000/yr can offset ordinary (W-2) income if you actively participate and your MAGI is under $100k (phasing out to $0 by $150k); unused losses carry forward. On sale, claimed depreciation is recaptured at up to 25%, and gains may owe capital-gains tax (a 1031 exchange can defer both). Figures are a year-1 estimate at your 24.0% rate — not tax advice; consult a CPA.
Schools (NCES district)
- District
- Olympia School District
- NCES district ID
- 5306180
- Math proficiency
- 66% ▼ -2.00%
- Reading proficiency
- 75% ▼ -2.00%
- Median HH income
- $63,852
- Composite
- 62.27/100
- National rank
- #1438
- State rank
- #17 of 291 in WA
Livability — Olympia
- Score
- 83/100
- State rank
- #58
- US rank
- #1036
Category grades
Schools grade is shown separately in the Schools card above.
Census & demographics
- Census place
- Olympia, WA
- County
- Thurston County · 269,345 people
- City population
- 98,428
- Metro
- Olympia-Lacey-Tumwater, WA
- Population (ZIP)
- 35,398
- Household income
- $92,207
- Rent vs Own
- Severe rent burden
- 1811.0
Population outlook (Thurston County) Hauer SSP2
- Today (2025)
- 308,239 people
- By 2030
- 326,483 · +5.9%
- By 2040
- 359,890 · +16.8%
- By 2050
- 391,800 · +27.1%
- By 2075
- 468,024 · +51.8%
- By 2100
- 519,890 · +68.7%
Race, ethnicity, and origin ACS 2023
- Neighborhood character
- Predominantly White (71%)
- Race & ethnicity
- White 71% Two or more races 13% Hispanic / Latino 11% Asian 6% Black 3% Native American 1%
- Hispanic origin (detail)
- Mexican 3% Puerto Rican 4%
- Common ancestry
- Italian 5% Portuguese 4% Iranian 3%
- Foreign-born
- 8% · Vietnam, Canada, China
- Languages at home
- 90% English-only · Spanish 3% Vietnamese 2% Other Asian/Pacific 1%
Political lean MEDSL · Thurston
- 2024 margin
- Strong D (+20.4) · D 58.5% · R 38.1% · Other 3.5%
- 2008→2024 swing
- -1.3pp toward R · 2008: 21.7pp · 2024: 20.4pp
- All cycles
- 2024: D+20.4 2020: D+18.6 2016: D+15.4 2012: D+19.0 2008: D+21.7
Not yet ingested
- Civics
- —
Market trends
- HPI YoY
- ▲ 18.49%
- Current HPI
- 1056.49
- Rent YoY
- ▲ 3.16%
- Metro
- Olympia-Lacey-Tumwater, WA
- State GDP YoY
- ▲ 4.65%
- F500 in state
- 22
Industry mix (Fortune 500 HQ in WA)
| Industry | F500 HQs | Revenue |
|---|---|---|
| Retail | 2 | $269B |
|
||
| Technology / Retail | 1 | $638B |
|
||
| Technology | 1 | $245B |
|
||
| Telecommunications | 1 | $38B |
|
||
| Food / Beverage | 1 | $36B |
|
||
| Automotive / Trucks | 1 | $34B |
|
||
Price history
+218.4% since first listed11 events — show timeline
- 2026-05-15 Listed $589,000 NWMLS as Distributed by MLS Grid
- 2019-07-24 Sold (Public Records) $335,000 Public Records
- 2019-07-24 Sold (MLS) $335,000 NWMLS as Distributed by MLS Grid
- 2019-06-18 Pending — NWMLS as Distributed by MLS Grid
- 2019-06-15 Listed $325,000 NWMLS as Distributed by MLS Grid
- 2005-06-29 Sold (MLS) $256,000 NWMLS as Distributed by MLS Grid
- 2005-06-28 Sold (Public Records) $256,000 Public Records
- 2005-05-04 Listed $257,000 NWMLS as Distributed by MLS Grid
- 2003-04-24 Sold (MLS) $182,000 NWMLS as Distributed by MLS Grid
- 2003-04-22 Sold (Public Records) $182,000 Public Records
- 2003-02-18 Listed $185,000 NWMLS as Distributed by MLS Grid
Property tax history
-4.5%/yrLatest (2026): $1,202 · -3.6% YoY. Source: county tax records.
Cash-flow waterfall
monthlySold comps — $/sqft
last 12 mo · ≤1 miLoading sold comps…