13 Liberty WH St · Newburgh, NY
Flood risk 1/10 · Minimal
- FEMA flood zone
- X (unshaded)
- Chance of flooding over 30 yrs
- 0.0%
- Est. flood insurance / yr
- $473 – $860
Fire risk 1/10 · Minimal
- Est. fire insurance / yr
- $691 – $1,283
Heat risk 5/10 · Moderate
- Hot days now (above 100°F)
- 7 days/yr
- Hot days in 30 yrs
- 16 days/yr
Wind risk 4/10 · Minor
- Chance of severe wind over 30 yrs
- 13.0%
Air-quality risk 3/10 · Minor
- Unhealthy air days now
- 2 days/yr
- Unhealthy air days in 30 yrs
- 3 days/yr
Risk factors via First Street. Map © Google.
Why this score? — see what drove the B- grade
The composite is a weighted blend of 9 inputs, each scored 0–100. Each bar is that input's sub-score; the figure is the points it added to the 100-point composite (weight × sub-score).
- Cash flow +30.0/30.0
- 1% rule +10.0/10.0
- DSCR +10.0/10.0
- ARV discount +7.5/15.0
- Schools +3.5/10.0
- Livability +3.1/5.0
- Rent growth +2.7/5.0
- Condition / age +1.0/5.0
- Appreciation +0.0/10.0
$159,900
🖨 Deal sheet 📄 Offer letter ✓ Due diligence
Listing remarks MLS
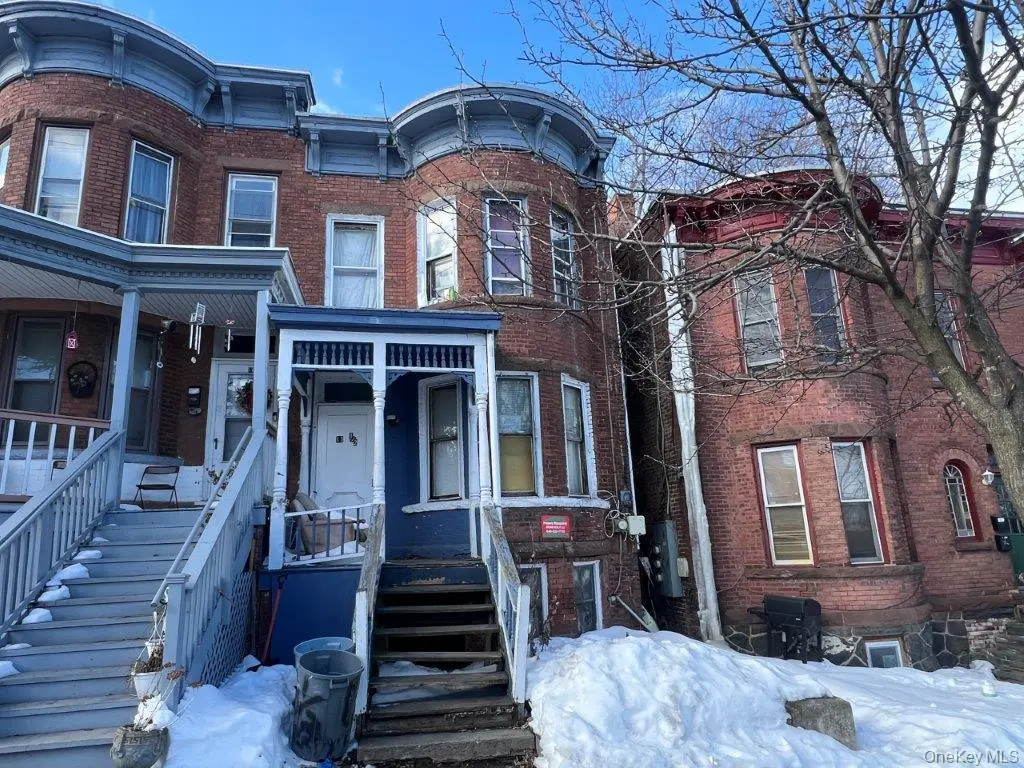
Three bedroom, one bathroom single family home in the Historic District of Newburgh. Brick walkup townhouse style home. Close to shopping, schools and amenities. Sold as-is. Buyer to pay NYS and any local transfer taxes. Cash offers with proof of funds. Please see agent remarks for offer presentation remarks. Property is occupied, no interior access.
Key facts
- Close to schools
- Close to amenities
- Close to shopping
Tags
Neighborhood map
What this means for you Summary
Snapshot
- This is a 3-bed/1.0-bath single-family listed at $160k. Condition is rated poor.
Deal economics
- At list price, monthly cash flow is $1k ($14k/yr) — positive.
- The deal already cash-flows at list — no discount required.
- Meets the 1% rule at list price ($3k rent vs $160k).
- Recommended offer: $146k (9.0% below list) — sets the bar for market timing.
- Cap rate 15.2% vs local median 4.4% in Newburgh — top-decile yield for the area; either an underpriced asset or a hidden risk that comps aren't pricing in. Stress-test before assuming the spread holds.
Location & tenants
- Location reads 62/100 on livability (#878 in NY) — a middle-class / working-renter tenant base. Strengths: health & safety A+, housing B+, cost of living B; Watch: employment D+, schools D, crime F.
- Newburgh City School District (suburban): math 33% / reading 48% proficiency, ranked #500 of 590 in NY (top 85%) — families likely to look elsewhere, expect single-tenant / working-renter base with shorter leases; 61% free/reduced lunch — lower-income household profile, screen leases tightly.
- Market conditions: Rents flat; 383 active listings in the ZIP; 8 comparable units currently listed for rent nearby; rentals at typical pace (median 24d on market — plan ~3-4 weeks tenant-placement turnaround); solid renter incomes; 1,746 units permitted in Orange County in 2024 (1,265 in 5+ unit buildings).
- This rent runs 41% of the median local income ($86k/yr) — at the standard rent-burdened threshold; future hikes will face affordability resistance.
Forward outlook
- Local home prices are declining (-3.0%/yr); year-one equity from $1k of loan paydown is wiped out by about $5k of value loss. Plan a longer hold.
- At projected returns (-3.0% appreciation + 0.6% rent growth), your $45k cash investment doubles in ~5 years — after that, you're playing with house money.
Negotiation context
- It's been on market 104 days — a 9% lower offer ($146k) is reasonable based on typical stale-listing flexibility.
Risks & watch-outs
- Watch-outs: built in 1890 — expect roof / HVAC / electrical / plumbing capex.
- Climate carrying-cost: extreme-heat days projected 7→16/yr by 2055 (HVAC capex compounding) — expect insurance premiums to compound above CPI over the hold.
Questions for the listing agent
- It's been on market 104 days. Have you received any prior offers? Is the seller open to a 9% concession, seller financing, or rate buy-down credit?
- Have any recent inspections been done? Can we get a copy of the seller's disclosures and any deferred-maintenance estimates?
- Built in 1890 — when were the roof, HVAC, electrical panel, plumbing, and water heater last replaced?
- Why hasn't it sold? Are there any deal-killer items the seller is aware of (foundation, flood, title, zoning, code violations)?
- Is there a deadline driving the sale (1031 exchange, divorce, estate, relocation)? That informs how much negotiation room exists.
- Schools are D-rated, which usually means shorter tenancies and higher turnover. Who's the typical renter profile here, and what's been the actual vacancy rate?
- Crime grade is F in this area — have there been break-ins, vandalism, or insurance claims at this property in the last 3 years? What carrier currently insures it and at what premium?
- What's the average days-on-market for RENTAL listings here right now (not sales)? A rising rental-DOM trend means longer vacancies and softer asking-rent achievability than the comps imply.
- What's the recent tenant-quality profile in this submarket — average credit score on applications, eviction rate, late-payment / NSF rate, and stable-employment percentage? A property-management company in the area should have these aggregated.
- How much new for-sale + rental construction is in the pipeline within 1–3 miles? Heavy new supply typically softens prices + rents 12–24 months out; constrained supply supports both.
Investment metrics
- 1% rule
- 1.82% ✓
- Cap rate
- 15.24%
- Cash-on-cash
- 31.96%
- DSCR
- 2.42
- GRM
- 4.6
CMA / ARV
- ARV (median comp)
- $353,420
- List price
- $159,900
- Delta
- -54.76%
- Verdict
- UNDERPRICED
- Comps
- 20 within 1.0 mi
Show comp detail 9 sales within ~0.75 mi
| Address | Dist | Beds/Ba | Sqft | Sold | Price | $/sf | Match |
|---|---|---|---|---|---|---|---|
| 16 Henry Ave | 0.16mi | 4/2.0 (+1) | 1,976 (+5%) | 12mo | $470,000 | $238 | 65 |
| 49 Overlook Pl | 0.07mi | 4/3.0 (+1) | 2,100 (+11%) | 7mo | $375,000 | $179 | 59 |
| 35 Carpenter Ave | 0.66mi | 2/2.5 (-1) | 1,852 (-2%) | 2mo | $225,000 | $121 | 54 |
| 99 Courtney Ave | 0.19mi | 2/2.0 (-1) | 1,764 (-7%) | 22mo | $175,000 | $99 | 54 |
| 21 E Parmenter St | 0.25mi | 3/3.0 | 2,046 (+8%) | 19mo | $305,000 | $149 | 51 |
| 38 E Parmenter St | 0.28mi | 3/2.5 | 1,608 (-15%) | 11mo | $280,000 | $174 | 47 |
| 115 Chestnut Dr | 0.69mi | 3/2.0 | 1,906 (+1%) | 20mo | $500,000 | $262 | 45 |
| 291 Walsh Ave | 0.59mi | 4/2.5 (+1) | 1,800 (-5%) | 11mo | $430,000 | $239 | 44 |
| 2 Primavera Dr | 0.67mi | 4/3.0 (+1) | 2,102 (+11%) | 16mo | $585,000 | $278 | 24 |
Match score weights: distance 35% · size 25% · config 20% · recency 20%. Top-matched comps best support the ARV.
Projected returns pro-forma
-3.0% appreciation · 0.63% rent growth · sell at horizon
- IRR
- 24.2%
- Equity multiple
- 1.97×
- Total profit
- $43,311
- Equity at exit
- $23,842
- IRR
- 30.5%
- Equity multiple
- 3.44×
- Total profit
- $109,182
- Equity at exit
- $13,825
Cash invested: $44,772 (down + closing). Projections, not guarantees.
Landlord ↔ Tenant lean methodology
- Overall (STATE)
- 15 Strongly Tenant-Friendly
- State New York
- 15 Strongly Tenant-Friendly · D+10
- County
- — inherits STATE
- City
- — inherits STATE
ZIP-level market 12550
- Home prices YoY
- -33.3%
- Rents YoY
- 0.6%
- Active inventory
- 383
- Price-to-rent
- 4.6×
Monthly cashflow live
- Estimated rent
- $2,908 high interval (Pro) →
- Mortgage (P&I)
- −$839
- Tax est. 1.5%
- −$200 /mo · $2,398/yr
- Insurance
- −$67
- HOA
- −$0
- Vacancy / Maint / Mgmt
- −$611
- Net cashflow
- $1,193
Break-even live
UW: 25.0% down · 7.5% · 30yr · 1.5% tax · 5.0% vac · 8.0% maint · 8.0% mgmt
Financing live
Cash to close
- Down payment
- $39,975
- Closing costs
- $4,797
- Reserves months
- —
- Total cash needed
- —
Loan-product check · same deal, 3 products live
Conventional
25% down · 7.5% · 30yr
- Down + closing
- —
- Monthly P&I
- —
- Monthly cashflow
- —
- DSCR
- —
- Eligible?
- —
Personal DTI + credit; lowest rate.
DSCR
20% down · 8.5% · 30yr
- Down + closing
- —
- Monthly P&I
- —
- Monthly cashflow
- —
- DSCR
- —
- Eligible?
- —
No personal income docs; deal must DSCR.
Hard money
10% down · 12.0% · 12mo
- Down + closing
- —
- Monthly P&I
- —
- Monthly cashflow
- —
- DSCR
- —
- Eligible?
- —
Short-term bridge; refi at stabilization.
Rent comps 8 comps
| Address | Beds | Baths | Sqft | Rent | $/sqft | DOM | Units | Dist |
|---|---|---|---|---|---|---|---|---|
| 81 Liberty Street Washington Hts Unit 2 Newburgh, NY | 3.0 | 1.0 | 1362 | $2,950 | $2.17 | 44d | 1 | 0.20mi |
| 4 Grand St Unit 3 Newburgh, NY | 4.0 | 2.0 | 1560 | $3,925 | $2.52 | 23d | 1 | 0.33mi |
| 160 N Miller St #1 Newburgh, NY | 4.0 | 1.0 | 1600 | $2,500 | $1.56 | 44d | 1 | 0.87mi |
| 457 1st St Newburgh, NY | 3.0 | 1.0 | 1680 | $2,950 | $1.76 | 44d | 1 | 1.05mi |
| 4 Riverview Ave Unit 1 New Windsor, NY | 2.0 | 2.5 | 1992 | $1,850 | $0.93 | 14d | 1 | 1.17mi |
| 317 Grand St Unit 1-1 Newburgh, NY | 2.0 | 2.0 | 1400 | $2,200 | $1.57 | 14d | 1 | 1.18mi |
| 171 West St Newburgh, NY | 3.0 | 1.5 | 1299 | $2,800 | $2.16 | 23d | 1 | 1.34mi |
| 1000 Copper Ct New Windsor, NY | 2.0 | 2.0 | 1388 | $2,600 | $1.87 | 21d | 1 | 1.47mi |
Listing history 17 events
-
2026-06-18days on market $159,900 Active 104 DOM
-
2026-06-17days on market $159,900 Active 103 DOM
-
2026-06-16days on market $159,900 Active 102 DOM
-
2026-06-15days on market $159,900 Active 101 DOM
-
2026-06-14days on market $159,900 Active 99 DOM
-
2026-06-13days on market $159,900 Active 98 DOM
-
2026-06-10days on market $159,900 Active 96 DOM
-
2026-06-09days on market $159,900 Active 95 DOM
-
2026-06-08days on market $159,900 Active 94 DOM
-
2026-06-07days on market $159,900 Active 93 DOM
-
2026-06-03days on market $159,900 Active 89 DOM
-
2026-06-02days on market $159,900 Active 88 DOM
-
2026-06-01days on market $159,900 Active 87 DOM
-
2026-05-31days on market $159,900 Active 86 DOM
-
2026-05-30days on market $159,900 Active 85 DOM
-
2026-05-04price $159,900 361-char remark
Show marketing remark (361 chars)
Three bedroom, one bathroom single family home in the Historic District of Newburgh. Brick walkup townhouse style home. Close to shopping, schools and amenities. Sold as-is. Buyer to pay NYS and any local transfer taxes. Cash offers with proof of funds. Please see agent remarks for offer presentation remarks. Property is occupied, no interior access.
-
2026-03-06$169,900 Active 361-char remark
Show marketing remark (361 chars)
Three bedroom, one bathroom single family home in the Historic District of Newburgh. Brick walkup townhouse style home. Close to shopping, schools and amenities. Sold as-is. Buyer to pay NYS and any local transfer taxes. Cash offers with proof of funds. Please see agent remarks for offer presentation remarks. Property is occupied, no interior access.
ⓘ Source: listings_history table (triggers on properties + properties_extension) + one-shot
backfill from property_details.listing_events for pre-trigger history.
Climate risk First Street
- Flood 1/10 Low FEMA zone X (unshaded) · 0% chance over 30 yrs
- Wildfire 1/10 Low
- Heat 5/10 Major 7 d/yr ≥100°F today · 16 d/yr by 30 yrs out
- Wind 4/10 Moderate 13% chance of damaging wind over 30 yrs
- Air quality 3/10 Moderate 2 unhealthy d/yr today · 3 by 30 yrs out
Nearby sold comps map
Loading sold comps map…
Walkable amenities ~0.75 mi
Loading nearby amenities…
Taxation est. · year 1
- Rental income
- $34,900
- − Mortgage interest
- −$8,957
- − Property taxes
- −$2,398
- − Insurance
- −$800
- − Repairs & maintenance
- −$2,792
- − Management
- −$2,792
- − Depreciation
- −$4,652
- Taxable income
- $12,509
- Est. tax owed @ 24.0%
- −$3,002
- After-tax cash flow
- $11,308/yr
For passive investors: Depreciation is non-cash, so a rental often shows a tax loss while cash-flowing — sheltering income. Rental losses are passive: they offset passive income freely, and up to $25,000/yr can offset ordinary (W-2) income if you actively participate and your MAGI is under $100k (phasing out to $0 by $150k); unused losses carry forward. On sale, claimed depreciation is recaptured at up to 25%, and gains may owe capital-gains tax (a 1031 exchange can defer both). Figures are a year-1 estimate at your 24.0% rate — not tax advice; consult a CPA.
Condition & rehab AI · 4 photos
This property requires extensive repairs and maintenance, including exterior siding and roof replacement, to become move-in ready. Landscaping and interior updates would significantly increase its value.
Repairs flagged
- Major Exterior siding — Significant damage and wear
- Major Roof — Appears old and possibly leaking
Value-add opportunities
- Both Landscaping and exterior repairs — Improves curb appeal and property value
- Both Interior repairs and updates — Enhances living space and rental potential
Renovation cost estimate screening
| Repair item | Severity | Est. cost |
|---|---|---|
| Exterior siding · Significant damage and wear | Major | $15,000–50,000 |
| Roof · Appears old and possibly leaking | Major | $15,000–50,000 |
| Total estimated repair cost · 2 items | $30,000–100,000 |
Value-add ROI direction
- Both Landscaping and exterior repairs — Improves curb appeal and property value ↑
- Both Interior repairs and updates — Enhances living space and rental potential ↑
ⓘ Cost ranges are severity-bucket heuristics (US national rule-of-thumb). Get contractor quotes + a written scope before underwriting a rehab budget.
Schools (NCES district)
- District
- Newburgh City School District
- NCES district ID
- 3620700
- Math proficiency
- 33% ▼ -8.00%
- Reading proficiency
- 48% ▲ 10.00%
- Median HH income
- $56,387
- Composite
- 35.46/100
- National rank
- #4927
- State rank
- #500 of 590 in NY
Livability — Newburgh
- Score
- 62/100
- State rank
- #878
- US rank
- #17021
Category grades
Schools grade is shown separately in the Schools card above.
Census & demographics
- Census place
- Newburgh, NY
- County
- Orange County · 267,004 people
- City population
- 55,152
- Metro
- Poughkeepsie-Newburgh-Middletown, NY
- Population (ZIP)
- 55,152
- Household income
- $85,697
- Rent vs Own
- Severe rent burden
- 2412.0
Population outlook (Orange County) Hauer SSP2
- Today (2025)
- 379,830 people
- By 2030
- 378,955 · -0.2%
- By 2040
- 375,444 · -1.2%
- By 2050
- 369,311 · -2.8%
- By 2075
- 354,233 · -6.7%
- By 2100
- 318,150 · -16.2%
Race, ethnicity, and origin ACS 2023
- Neighborhood character
- Diverse neighborhood (Simpson 0.68)
- Race & ethnicity
- Hispanic / Latino 39% White 36% Black 20% Two or more races 12% Asian 2%
- Hispanic origin (detail)
- Mexican 14% Puerto Rican 10% Dominican 2%
- Common ancestry
- Romanian 2% Hispanic 1% Lithuanian 1%
- Foreign-born
- 18% · Canada, Dominican Republic
- Languages at home
- 64% English-only · Spanish 30% French/Haitian/Cajun 1% Other Indo-European 1%
Political lean MEDSL · Orange
- 2024 margin
- Lean R (+8.4) · D 45.8% · R 54.2%
- 2008→2024 swing
- -12.5pp toward R · 2008: 4.1pp · 2024: -8.4pp
- All cycles
- 2024: R+8.4 2020: R+0.2 2016: R+6.5 2012: D+5.2 2008: D+4.1
Not yet ingested
- Civics
- —
Market trends
- HPI YoY
- ▼ -151.93%
- Current HPI
- 304.1046
- Rent YoY
- ▲ 0.63%
- Metro
- Poughkeepsie-Newburgh-Middletown, NY
- State GDP YoY
- ▲ 2.60%
- F500 in state
- 92
Industry mix (Fortune 500 HQ in NY)
| Industry | F500 HQs | Revenue |
|---|---|---|
| Financial Services | 10 | $950B |
|
||
| Consumer Goods | 9 | $162B |
|
||
| Insurance | 4 | $225B |
|
||
| Telecommunications | 2 | $144B |
|
||
| Pharmaceuticals | 2 | $112B |
|
||
| Media / Entertainment | 2 | $69B |
|
||
Price history
-5.9% since first listed2 events — show timeline
- 2026-05-04 Price Changed $159,900 OneKey® MLS as Distributed by MLS Grid
- 2026-03-06 Listed $169,900 OneKey® MLS as Distributed by MLS Grid
Cash-flow waterfall
monthlySold comps — $/sqft
last 12 mo · ≤1 miLoading sold comps…