1013 Charing Cross · Cave Springs, AR
Flood risk 1/10 · Minimal
- FEMA flood zone
- X (unshaded)
- Chance of flooding over 30 yrs
- 0.0%
- Est. flood insurance / yr
- $507 – $1,088
Fire risk 4/10 · Minor
- Est. fire insurance / yr
- $1,499 – $2,785
Heat risk 5/10 · Moderate
- Hot days now (above 104°F)
- 7 days/yr
- Hot days in 30 yrs
- 21 days/yr
Wind risk 2/10 · Minimal
- Chance of severe wind over 30 yrs
- 2.0%
Air-quality risk 1/10 · Minimal
- Unhealthy air days now
- 0 days/yr
- Unhealthy air days in 30 yrs
- 0 days/yr
Risk factors via First Street. Map © Google.
Why this score? — see what drove the D grade
The composite is a weighted blend of 9 inputs, each scored 0–100. Each bar is that input's sub-score; the figure is the points it added to the 100-point composite (weight × sub-score).
- Appreciation +10.0/10.0
- ARV discount +9.5/15.0
- Cash flow +7.2/30.0
- Schools +5.2/10.0
- Livability +3.6/5.0
- Rent growth +2.5/5.0
- Condition / age +2.5/5.0
- 1% rule +1.5/10.0
- DSCR +1.4/10.0
$575,000
🖨 Deal sheet (PDF) 📄 Offer letter ✓ Due diligence
Listing remarks MLS
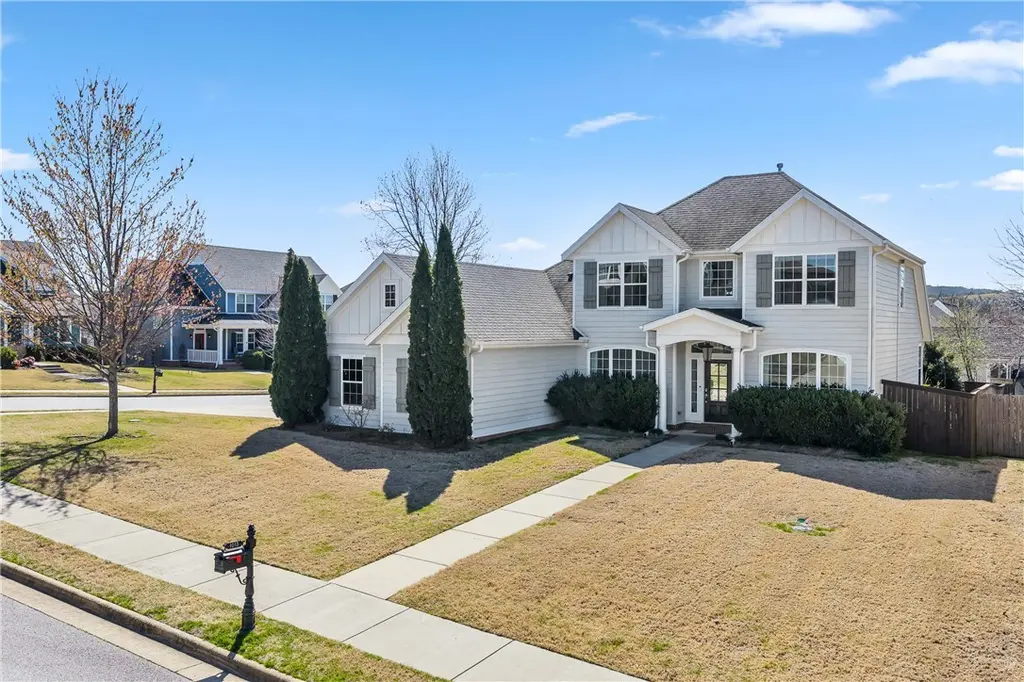
Welcome HOME to Hyde Park. This craftsman style home boasts 4 bedrooms + office/formal dining with an open concept floor plan. Living room features hardwood floors, gas log fireplace & vaulted ceiling with beams. Kitchen has beautiful white cabinets, SS appliances, gas cooktop, granite countertops & farmhouse sink. Great back yard with privacy fence and covered patio with a side load 3-car garage sitting on a large corner lot. Located in Bentonville school district. Awesome community with pool, playground and a garden.
Key facts
- Craftsman style home
- Gas log fireplace
- Farmhouse sink
Tags
Neighborhood map
What this means for you Summary
Snapshot
- This is a 4-bed/2.5-bath single-family listed at $575k.
Deal economics
- At list price, monthly cash flow is $-793 ($-10k/yr) — negative.
- To cash-flow at today's rent, offer at most $435k (24.4% below list).
- To meet the 1% rule (rent ≥ 1% of price), the offer needs to be $371k (35.4% below list).
- Recommended offer: $371k (35.4% below list) — sets the bar for 1% rule.
- Cap rate 4.6% vs local median 3.4% in Cave Springs — top-decile yield for the area; either an underpriced asset or a hidden risk that comps aren't pricing in. Stress-test before assuming the spread holds.
Location & tenants
- Location reads 71/100 on livability (#41 in AR) — a middle-class / working-renter tenant base. Strengths: crime A+, employment A+, housing A+; Watch: cost of living C-, schools D, amenities F.
- Bentonville School District (urban): math 59% / reading 59% proficiency, ranked #3 of 238 in AR (top 1%) — acceptable for families but not a draw, mixed tenant base, ~2y average lease.
- Market conditions: 112 active listings in the ZIP; 8 comparable units currently listed for rent nearby; rentals at typical pace (median 25d on market — plan ~3-4 weeks tenant-placement turnaround); 4,359 units permitted in Benton County in 2024 (402 in 5+ unit buildings).
Forward outlook
- In year one you build about $61k of equity ($4k loan paydown + $58k appreciation (10.0% local appreciation)).
- Benton County population projected at +56% by 2050 — long-run rental-demand tailwind backs the buy-and-hold thesis.
- By year 2, paydown + projected appreciation supports a ~$99k cash-out refi (75% LTV) — recoverable capital for the next deal without selling this one.
Negotiation context
- It's been on market 19 days — a 2% lower offer ($566k) is reasonable based on typical stale-listing flexibility.
- 3 sale attempts since 13y ago with the ask held roughly flat each time — persistent listings suggest the price (not the market) is what's stuck; bring a comps-based counter.
- Current owner paid $500k; 15% above their basis — modest negotiation headroom, anchor on the comps not their cost.
Risks & watch-outs
- Climate carrying-cost: extreme-heat days projected 7→21/yr by 2055 (HVAC capex compounding) — expect insurance premiums to compound above CPI over the hold.
Questions for the listing agent
- What do current leases actually rent for vs. the listed asking? Can we see a recent rent roll and the last 12 months of T-12 income?
- What does the HOA fee cover, when was the last increase, and are there any pending special assessments or reserve-fund shortfalls?
- Is there a deadline driving the sale (1031 exchange, divorce, estate, relocation)? That informs how much negotiation room exists.
- Schools are D-rated, which usually means shorter tenancies and higher turnover. Who's the typical renter profile here, and what's been the actual vacancy rate?
- The area grade is low — what's the realistic commute time and amenity access for the typical tenant pool here? Any planned neighborhood developments (good or bad) we should know about?
- What's the average days-on-market for RENTAL listings here right now (not sales)? A rising rental-DOM trend means longer vacancies and softer asking-rent achievability than the comps imply.
- What's the recent tenant-quality profile in this submarket — average credit score on applications, eviction rate, late-payment / NSF rate, and stable-employment percentage? A property-management company in the area should have these aggregated.
- How much new for-sale + rental construction is in the pipeline within 1–3 miles? Heavy new supply typically softens prices + rents 12–24 months out; constrained supply supports both.
Investment metrics
- 1% rule
- 0.65% ✗
- Cap rate
- 4.64%
- Cash-on-cash
- -5.91%
- DSCR
- 0.74
- GRM
- 12.9
CMA / ARV
- ARV (on-the-fly)
- $602,378
- Comps found
- 12
Show comp detail 12 sales within ~0.75 mi
| Address | Dist | Beds/Ba | Sqft | Sold | Price | $/sf | Match |
|---|---|---|---|---|---|---|---|
| 1013 Charing Cross | 0.00mi | 4/2.5 | 2,531 (0%) | 0mo | $570,000 | $225 | 100 |
| 807 Bellmara Cir | 0.10mi | 4/3.0 | 2,510 (-1%) | 2mo | $581,000 | $231 | 90 |
| 5900 S 67th St | 0.19mi | 4/3.0 | 2,473 (-2%) | 0mo | $560,000 | $226 | 85 |
| 906 Charing Cross | 0.16mi | 4/3.0 | 2,425 (-4%) | 2mo | $587,000 | $242 | 82 |
| 5605 S Chadwick Dr | 0.37mi | 4/2.5 | 2,650 (+5%) | 2mo | $689,500 | $260 | 73 |
| 816 Post Way | 0.53mi | 4/2.5 | 2,477 (-2%) | 0mo | $615,000 | $248 | 71 |
| 1010 Chancery Ln | 0.08mi | 4/3.5 | 2,857 (+13%) | 2mo | $679,000 | $238 | 69 |
| 6614 W Braebourne Dr | 0.35mi | 4/2.0 | 2,344 (-7%) | 1mo | $575,000 | $245 | 69 |
| 5701 S 66th St | 0.40mi | 3/2.5 (-1) | 2,228 (-12%) | 0mo | $510,000 | $229 | 56 |
| 6201 Tumbler Rdg | 0.73mi | 4/3.0 | 2,403 (-5%) | 1mo | $575,000 | $239 | 55 |
| 5601 65th St | 0.70mi | 4/3.5 | 2,718 (+7%) | 1mo | $595,000 | $219 | 51 |
| 1425 S Hampton Xing | 0.73mi | 4/2.5 | 2,264 (-10%) | 1mo | $529,000 | $234 | 48 |
Match score weights: distance 35% · size 25% · config 20% · recency 20%. Top-matched comps best support the ARV.
Projected returns pro-forma
10.0% appreciation · 3.0% rent growth · sell at horizon
- IRR
- 20.1%
- Equity multiple
- 2.63×
- Total profit
- $262,544
- Equity at exit
- $518,006
- IRR
- 18.4%
- Equity multiple
- 6.05×
- Total profit
- $812,688
- Equity at exit
- $1,117,099
Cash invested: $161,000 (down + closing). Projections, not guarantees.
Landlord ↔ Tenant lean methodology
- Overall (STATE)
- 92 Strongly Landlord-Friendly
- State Arkansas
- 92 Strongly Landlord-Friendly · R+14
- County
- — inherits STATE
- City
- — inherits STATE
ZIP-level market 72718
- Home prices YoY
- 14.1%
- Active inventory
- 112
- Price-to-rent
- 12.9×
Monthly cashflow live
- Estimated rent
- $3,715 high interval (Pro) →
- Mortgage (P&I)
- −$3,015
- Tax from tax record
- −$448 /mo · $5,374/yr
- Insurance
- −$240
- HOA
- −$25
- Vacancy / Maint / Mgmt
- −$780
- Net cashflow
- $-793
Break-even live
Sensitivity live
| Price | -10% $-468 | -5% $-630 | +0% $-793 | +5% $-956 | +10% $-1,119 |
|---|---|---|---|---|---|
| Rent | -10% $-1,087 | -5% $-940 | +0% $-793 | +5% $-647 | +10% $-500 |
| Rate | -1.0pp $-504 | -0.5pp $-647 | base $-793 | +0.5pp $-942 | +1.0pp $-1,094 |
UW: 25.0% down · 7.5% · 30yr · 1.5% tax · 5.0% vac · 8.0% maint · 8.0% mgmt
Financing live
Cash to close
- Down payment
- $143,750
- Closing costs
- $17,250
- Reserves months
- —
- Total cash needed
- —
Loan-product check · same deal, 3 products live
Conventional
25% down · 7.5% · 30yr
- Down + closing
- —
- Monthly P&I
- —
- Monthly cashflow
- —
- DSCR
- —
- Eligible?
- —
Personal DTI + credit; lowest rate.
DSCR
20% down · 8.5% · 30yr
- Down + closing
- —
- Monthly P&I
- —
- Monthly cashflow
- —
- DSCR
- —
- Eligible?
- —
No personal income docs; deal must DSCR.
Hard money
10% down · 12.0% · 12mo
- Down + closing
- —
- Monthly P&I
- —
- Monthly cashflow
- —
- DSCR
- —
- Eligible?
- —
Short-term bridge; refi at stabilization.
Rent comps 8 comps
| Address | Beds | Baths | Sqft | Rent | $/sqft | DOM | Units | Dist |
|---|---|---|---|---|---|---|---|---|
| 6502 W Hearth Falls Dr Unit 1221804P Rogers, AR | 4.0 | 2.5 | 2443 | $6,688 | $2.74 | 15d | 1 | 0.64mi |
| 6508 W Stone Lake Dr Unit 1221824P Rogers, AR | 4.0 | 2.5 | 2271 | $7,860 | $3.46 | 16d | 1 | 0.66mi |
| 5313 S Stone Bay Ct Rogers, AR | 4.0 | 3.0 | 2110 | $3,300 | $1.56 | 16d | 1 | 0.83mi |
| 5217 S 65th Pl Rogers, AR | 3.0 | 2.5 | 2055 | $2,400 | $1.17 | 25d | 1 | 0.90mi |
| 5217 S 65th Pl Rogers, AR | 3.0 | 2.5 | 2055 | $2,290 | $1.11 | 16d | 1 | 0.90mi |
| 6613 W Valley View Rd Rogers, AR | 4.0 | 2.5 | 2475 | $3,000 | $1.21 | 25d | 1 | 0.92mi |
| 6683 W Valley View Rd Rogers, AR | 4.0 | 2.5 | 2477 | $3,500 | $1.41 | 25d | 1 | 0.94mi |
| 6665 W Valley View Rd Rogers, AR | 3.0 | 2.0 | 1923 | $2,950 | $1.53 | 25d | 1 | 0.98mi |
HOA detail
- Monthly dues
- $25 · $300/yr
- Likely covers
- gaspool
Listing history 9 events
-
2026-04-08status Pending
-
2026-03-30price $575,000
-
2026-03-20$600,000 Active
-
2022-11-28soldstatus $500,000
-
2022-11-23soldstatus $500,000 Closed 536-char remark
Show marketing remark (536 chars)
Welcome HOME to Hyde Park. This craftsman style home boasts 4 bedrooms + office/formal dining with an open concept floor plan. Living room features hardwood floors, gas log fireplace & vaulted ceiling with beams. Kitchen has beautiful white cabinets, SS appliances, gas cooktop, granite countertops & farmhouse sink. Great back yard with privacy fence and covered patio with a side load 3-car garage sitting on a large corner lot. Located in Bentonville school district. Awesome community with pool, playground and a garden.
-
2022-10-16status Pending 536-char remark
Show marketing remark (536 chars)
Welcome HOME to Hyde Park. This craftsman style home boasts 4 bedrooms + office/formal dining with an open concept floor plan. Living room features hardwood floors, gas log fireplace & vaulted ceiling with beams. Kitchen has beautiful white cabinets, SS appliances, gas cooktop, granite countertops & farmhouse sink. Great back yard with privacy fence and covered patio with a side load 3-car garage sitting on a large corner lot. Located in Bentonville school district. Awesome community with pool, playground and a garden.
-
2022-10-14$500,000 Active 536-char remark
Show marketing remark (536 chars)
Welcome HOME to Hyde Park. This craftsman style home boasts 4 bedrooms + office/formal dining with an open concept floor plan. Living room features hardwood floors, gas log fireplace & vaulted ceiling with beams. Kitchen has beautiful white cabinets, SS appliances, gas cooktop, granite countertops & farmhouse sink. Great back yard with privacy fence and covered patio with a side load 3-car garage sitting on a large corner lot. Located in Bentonville school district. Awesome community with pool, playground and a garden.
-
2013-04-26soldstatus $275,000 470-char remark
Show marketing remark (470 chars)
Craftsman Styled Home with all the Bells and Whistles Included. 4 or 5 bedroom , Formal Dining and Large Kitchen nook . Partial Wood Floors , Trey Ceilings , granite Countertops , Tile Kitchens 3 car garage . Great BENTONVILLE Schools. Easy Access to Hwy, and Shopping , medical Facilities. All Financing options Available including Rural Development . Come By Today and Personalize /Pick Colors for you Interior and exterior. POOL <NATURE TRAIL AND PARK IN COMMUNITY
-
2013-01-07$272,900 470-char remark
Show marketing remark (470 chars)
Craftsman Styled Home with all the Bells and Whistles Included. 4 or 5 bedroom , Formal Dining and Large Kitchen nook . Partial Wood Floors , Trey Ceilings , granite Countertops , Tile Kitchens 3 car garage . Great BENTONVILLE Schools. Easy Access to Hwy, and Shopping , medical Facilities. All Financing options Available including Rural Development . Come By Today and Personalize /Pick Colors for you Interior and exterior. POOL <NATURE TRAIL AND PARK IN COMMUNITY
ⓘ Source: listings_history table (triggers on properties + properties_extension) + one-shot
backfill from property_details.listing_events for pre-trigger history.
Tax reassessment forecast AR · Resets to sale price
- Current annual tax
- $5,374 · $448/mo
- Projected year-2 tax
- $5,374 · $448/mo
- Expected delta
- $0/yr ($0/mo · 0.0%)
ⓘ Screening estimate from a state-policy table — verify with the county assessor before closing.
Climate risk First Street
- Flood 1/10 Low FEMA zone X (unshaded) · 0% chance over 30 yrs
- Wildfire 4/10 Moderate
- Heat 5/10 Major 7 d/yr ≥104°F today · 21 d/yr by 30 yrs out
- Wind 2/10 Low 2% chance of damaging wind over 30 yrs
- Air quality 1/10 Low 0 unhealthy d/yr today · 0 by 30 yrs out
Nearby sold comps map
Loading sold comps map…
Walkable amenities ~0.75 mi
Loading nearby amenities…
Taxation est. · year 1
- Rental income
- $44,575
- − Mortgage interest
- −$32,209
- − Property taxes
- −$5,374
- − Insurance
- −$2,875
- − Repairs & maintenance
- −$3,566
- − Management
- −$3,566
- − HOA
- −$300
- − Depreciation
- −$16,727
- Taxable loss
- −$20,042
- Est. tax savings @ 24.0%
- +$4,810
- After-tax cash flow
- $-4,709/yr
For passive investors: Depreciation is non-cash, so a rental often shows a tax loss while cash-flowing — sheltering income. Rental losses are passive: they offset passive income freely, and up to $25,000/yr can offset ordinary (W-2) income if you actively participate and your MAGI is under $100k (phasing out to $0 by $150k); unused losses carry forward. On sale, claimed depreciation is recaptured at up to 25%, and gains may owe capital-gains tax (a 1031 exchange can defer both). Figures are a year-1 estimate at your 24.0% rate — not tax advice; consult a CPA.
Schools (NCES district)
- District
- Bentonville School District
- NCES district ID
- 0503060
- Math proficiency
- 59% ▼ -8.00%
- Reading proficiency
- 59% ▼ -6.00%
- Median HH income
- $66,721
- Composite
- 51.85/100
- National rank
- #1661
- State rank
- #3 of 238 in AR
Livability — Cave Springs
- Score
- 71/100
- State rank
- #41
- US rank
- #6981
Category grades
Schools grade is shown separately in the Schools card above.
Census & demographics
- Census place
- Cave Springs, AR
- City population
- 5,528
- Population (ZIP)
- 5,528
Population outlook (Benton County) Hauer SSP2
- Today (2025)
- 318,683 people
- By 2030
- 353,481 · +10.9%
- By 2040
- 425,280 · +33.4%
- By 2050
- 497,239 · +56.0%
- By 2075
- 662,114 · +107.8%
- By 2100
- 776,431 · +143.6%
Race, ethnicity, and origin ACS 2023
- Neighborhood character
- Predominantly White (69%)
- Race & ethnicity
- White 69% Two or more races 25% Hispanic / Latino 7%
- Hispanic origin (detail)
- Mexican 5%
- Common ancestry
- Slovak 4% Romanian 3% Lithuanian 2%
- Foreign-born
- 3% · Canada
- Languages at home
- 92% English-only · Spanish 6% Other Asian/Pacific 2%
Political lean MEDSL · Benton
- 2024 margin
- Strong R (+27.0) · D 35.2% · R 62.1% · Other 2.7%
- 2008→2024 swing
- +9.6pp toward D · 2008: -36.5pp · 2024: -27.0pp
- All cycles
- 2024: R+27.0 2020: R+26.4 2016: R+34.9 2012: R+40.4 2008: R+36.5
Not yet ingested
- Civics
- —
Market trends
- HPI YoY
- ▲ 41.26%
- Current HPI
- 334.6594
- Rent YoY
- —
- Metro
- —
- State GDP YoY
- ▲ 3.80%
- F500 in state
- 10
Industry mix (Fortune 500 HQ in AR)
| Industry | F500 HQs | Revenue |
|---|---|---|
| Retail | 1 | $681B |
|
||
| Food / Agriculture | 1 | $53B |
|
||
| Retail / Energy | 1 | $22B |
|
||
| Transportation / Logistics | 1 | $12B |
|
||
| Energy | 1 | $4B |
|
||
Price history
+110.7% since first listed9 events — show timeline
- 2026-04-08 Pending — NWARMLS
- 2026-03-30 Price Changed $575,000 NWARMLS
- 2026-03-20 Listed $600,000 NWARMLS
- 2022-11-28 Sold (Public Records) $500,000 Public Records
- 2022-11-23 Sold (MLS) $500,000 NWARMLS
- 2022-10-16 Pending — NWARMLS
- 2022-10-14 Listed $500,000 NWARMLS
- 2013-04-26 Sold (MLS) $275,000 NWARMLS
- 2013-01-07 Listed $272,900 NWARMLS
Property tax history
+15.1%/yrLatest (2025): $5,374 · +8.3% YoY. Source: county tax records.
Cash-flow waterfall
monthlySold comps — $/sqft
last 12 mo · ≤1 miLoading sold comps…