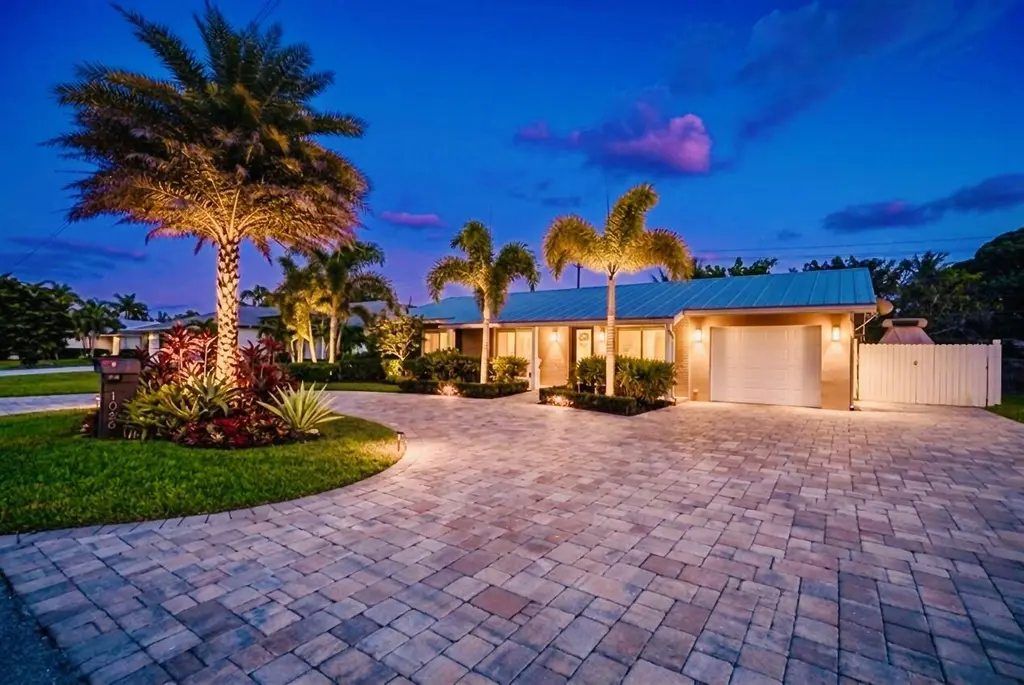
1066 SW 27th Pl · Boynton Beach, FL
Flood risk 4/10 · Minor
- FEMA flood zone
- X (unshaded)
- Chance of flooding over 30 yrs
- 0.24%
- Est. flood insurance / yr
- $507 – $1,088
Fire risk 1/10 · Minimal
- Est. fire insurance / yr
- $947 – $1,759
Heat risk 10/10 · Severe
- Hot days now (above 105°F)
- 7 days/yr
- Hot days in 30 yrs
- 26 days/yr
Wind risk 10/10 · Severe
- Chance of severe wind over 30 yrs
- 99.0%
Air-quality risk 2/10 · Minimal
- Unhealthy air days now
- 1 days/yr
- Unhealthy air days in 30 yrs
- 2 days/yr
Risk factors via First Street. Map © Google.
Why this score? — see what drove the D grade
The composite is a weighted blend of 9 inputs, each scored 0–100. Each bar is that input's sub-score; the figure is the points it added to the 100-point composite (weight × sub-score).
- Cash flow +13.5/30.0
- ARV discount +7.5/15.0
- Schools +4.3/10.0
- DSCR +4.1/10.0
- Livability +3.6/5.0
- 1% rule +2.7/10.0
- Rent growth +2.7/5.0
- Condition / age +2.5/5.0
- Appreciation +0.0/10.0
$790,000
🖨 Deal sheet (PDF) 📄 Offer letter ✓ Due diligence
Listing remarks
Experience the best of South Florida living in this beautifully updated single-family home, ideally located in a highly sought-after no-HOA community. Designed for both comfort and entertaining, this residence offers a seamless blend of modern upgrades and relaxed elegance. Enjoy the convenience of being just a short walk to Caloosa Park, with quick access to pristine beaches, upscale shopping, fine dining, and major highways. The home features a versatile layout, including a custom home office conversion within the garage space, easily reversible to suit your needs. A rare side driveway provides ample room for boat or RV parking. Step into your private outdoor oasis, complete with a fully
Key facts
- 8,400 sq ft lot
- 2 garage spots
- Pool
Property features AI
Finance
- Other: Private pool with above-ground spa; Pets allowed (cats and dogs OK)
Exterior
- Parking: Total parking for 8 vehicles; Attached 2-car garage with garage door opener; Covered parking for 2 vehicles; Circular driveway, paved driveway, paver block; Boat access/parking; Open parking
- Security: Owned security system; Motion detectors; Smoke detectors
- Utilities: Public water; Public sewer; Electricity connected; Cable available
- Home design: Single-family home; One story; Entry-level living area; North-facing
- Construction: CBS construction; Metal roof
- Exterior features: Covered, open and screened patios; Screened porch; Patio; Porch; Storage structure; Fenced backyard; Paved road access; Interior lot
Interior
- Kitchen: Dishwasher; Electric range; Microwave; Refrigerator; Garbage disposal; Electric water heater
- Bedrooms: 3 bedrooms on the main level
- Flooring: Carpet; Ceramic tile
- Bathrooms: 2 full bathrooms on the main level
- Heating & cooling: Central electric heating; Central air conditioning; Ceiling fans
- Interior features: Built-in features; Walk-in closets; Stacked bedroom layout; Pull-down attic stairs; Roman tub; French doors; Blinds
- Laundry & utility: Laundry closet inside on the main level; Washer hookup
Neighborhood map
What this means for you Summary
Snapshot
- This is a 3-bed/3.0-bath single-family listed at $790k.
Deal economics
- At list price, monthly cash flow is $27 ($328/yr) — positive.
- The deal already cash-flows at list — no discount required.
- To meet the 1% rule (rent ≥ 1% of price), the offer needs to be $609k (22.9% below list).
- Recommended offer: $609k (22.9% below list) — sets the bar for 1% rule.
- Cap rate 6.3% vs local median 4.3% in Boynton Beach — top-decile yield for the area; either an underpriced asset or a hidden risk that comps aren't pricing in. Stress-test before assuming the spread holds.
Location & tenants
- Location reads 72/100 on livability (#351 in FL) — a middle-class / working-renter tenant base. Strengths: housing A+, health & safety B+, cost of living B; Watch: amenities D+, crime D-, commute F.
- Palm Beach (suburban): math 46% / reading 53% proficiency, ranked #34 of 73 in FL (top 47%) — families likely to look elsewhere, expect single-tenant / working-renter base with shorter leases.
- Zoned schools: Crosspointe Elementary School (math 36% / reading 45%, grade F, #1,471 of 2,144 statewide, top 69%, 652 students, 75% FRL); Carver Middle School (math 22% / reading 34%, grade F, #486 of 571 statewide, top 86%, 732 students, 73% FRL); Atlantic High School (math 28% / reading 52%, grade F, #296 of 667 statewide, top 45%, 1,889 students, 59% FRL) — zoned schools average 69% FRL vs 52% district-wide (17 pts higher); higher-poverty schools than district average — tighter screening recommended.
- Zoned-school proficiency averages 36% at this address vs 50% district-wide (-13 pts) — the specific schools serving this property underperform the Palm Beach average; the district grade overstates school quality for this exact location.
- Market conditions: Rents flat; 232 active listings in the ZIP; 25 comparable units currently listed for rent nearby; rentals at typical pace (median 26d on market — plan ~3-4 weeks tenant-placement turnaround); 3,974 units permitted in Palm Beach County in 2024 (1,012 in 5+ unit buildings).
- At $6,090/mo this rent would consume 98% of the median local household income ($74k/yr) (locally 1417% of renters already pay >50% of income on rent) — very limited rent-growth headroom before tenants either downsize or default.
Forward outlook
- Local home prices are declining (-3.0%/yr); year-one equity from $5k of loan paydown is wiped out by about $24k of value loss. Plan a longer hold.
- Palm Beach County population projected at +30% by 2050 — long-run rental-demand tailwind backs the buy-and-hold thesis.
Negotiation context
- It's been on market 36 days — a 3% lower offer ($766k) is reasonable based on typical stale-listing flexibility.
- 2 sale attempts since 19y ago with the ask held roughly flat each time — persistent listings suggest the price (not the market) is what's stuck; bring a comps-based counter.
- Current owner paid $200k; list at $790k implies a 295% gain — meaningful room to come down on a strong offer.
Risks & watch-outs
- Climate carrying-cost: severe wind risk, 99% chance of damaging wind over 30y; extreme-heat days projected 7→26/yr by 2055 (HVAC capex compounding) — expect insurance premiums to compound above CPI over the hold.
Questions for the listing agent
- It's been on market 36 days. Have you received any prior offers? Is the seller open to a 23% concession, seller financing, or rate buy-down credit?
- Built in 1972 — when were the roof, HVAC, electrical panel, plumbing, and water heater last replaced?
- Is there a deadline driving the sale (1031 exchange, divorce, estate, relocation)? That informs how much negotiation room exists.
- Crime grade is D in this area — have there been break-ins, vandalism, or insurance claims at this property in the last 3 years? What carrier currently insures it and at what premium?
- The area grade is low — what's the realistic commute time and amenity access for the typical tenant pool here? Any planned neighborhood developments (good or bad) we should know about?
- What's the average days-on-market for RENTAL listings here right now (not sales)? A rising rental-DOM trend means longer vacancies and softer asking-rent achievability than the comps imply.
- What's the recent tenant-quality profile in this submarket — average credit score on applications, eviction rate, late-payment / NSF rate, and stable-employment percentage? A property-management company in the area should have these aggregated.
- How much new for-sale + rental construction is in the pipeline within 1–3 miles? Heavy new supply typically softens prices + rents 12–24 months out; constrained supply supports both.
Investment metrics
- 1% rule
- 0.77% ✗
- Cap rate
- 6.33%
- Cash-on-cash
- 0.15%
- DSCR
- 1.01
- GRM
- 10.8
CMA / ARV
No comps found within radius.
Projected returns pro-forma
-3.0% appreciation · 0.93% rent growth · sell at horizon
- IRR
- -18.2%
- Equity multiple
- 0.37×
- Total profit
- $-139,027
- Equity at exit
- $117,792
- IRR
- -14.5%
- Equity multiple
- 0.24×
- Total profit
- $-169,060
- Equity at exit
- $68,305
Cash invested: $221,200 (down + closing). Projections, not guarantees.
Landlord ↔ Tenant lean methodology
- Overall (STATE)
- 87 Strongly Landlord-Friendly
- State Florida
- 87 Strongly Landlord-Friendly · R+3
- County
- — inherits STATE
- City
- — inherits STATE
ZIP-level market 33426
- Rents YoY
- 0.9%
- Active inventory
- 232
- Price-to-rent
- 10.8×
Monthly cashflow live
- Estimated rent
- $6,090 high interval (Pro) →
- Mortgage (P&I)
- −$4,143
- Tax from tax record
- −$312 /mo · $3,743/yr
- Insurance
- −$329
- HOA
- −$0
- Vacancy / Maint / Mgmt
- −$1,279
- Net cashflow
- $27
Break-even live
Sensitivity live
| Price | -10% $474 | -5% $251 | +0% $27 | +5% $-196 | +10% $-420 |
|---|---|---|---|---|---|
| Rent | -10% $-454 | -5% $-213 | +0% $27 | +5% $268 | +10% $508 |
| Rate | -1.0pp $425 | -0.5pp $228 | base $27 | +0.5pp $-177 | +1.0pp $-386 |
UW: 25.0% down · 7.5% · 30yr · 1.5% tax · 5.0% vac · 8.0% maint · 8.0% mgmt
Financing live
Cash to close
- Down payment
- $197,500
- Closing costs
- $23,700
- Reserves months
- —
- Total cash needed
- —
Loan-product check · same deal, 3 products live
Conventional
25% down · 7.5% · 30yr
- Down + closing
- —
- Monthly P&I
- —
- Monthly cashflow
- —
- DSCR
- —
- Eligible?
- —
Personal DTI + credit; lowest rate.
DSCR
20% down · 8.5% · 30yr
- Down + closing
- —
- Monthly P&I
- —
- Monthly cashflow
- —
- DSCR
- —
- Eligible?
- —
No personal income docs; deal must DSCR.
Hard money
10% down · 12.0% · 12mo
- Down + closing
- —
- Monthly P&I
- —
- Monthly cashflow
- —
- DSCR
- —
- Eligible?
- —
Short-term bridge; refi at stabilization.
Rent comps 25 comps
| Address | Beds | Baths | Sqft | Rent | $/sqft | DOM | Units | Dist |
|---|---|---|---|---|---|---|---|---|
| 2866 SW 8th St Boynton Beach, FL | 3.0 | 3.0 | 1954 | $6,000 | $3.07 | 7d | 1 | 0.35mi |
| 2866 SW 8th St Boynton Beach, FL | 3.0 | 3.0 | 1954 | $6,000 | $3.07 | 26d | 1 | 0.35mi |
| 711 SW 27th Way Boynton Beach, FL | 3.0 | 3.0 | 1988 | $12,000 | $6.04 | 6d | 1 | 0.43mi |
| 2414 Venetian Way Boynton Beach, FL | 3.0 | 2.5 | 1990 | $3,200 | $1.61 | 1d | 1 | 0.51mi |
| 2414 Venetian Way Boynton Beach, FL | 3.0 | 2.5 | 1990 | $3,200 | $1.61 | 16d | 1 | 0.51mi |
| 937 SW 34th Ct Boynton Beach, FL | 4.0 | 3.5 | 3388 | $18,500 | $5.46 | 26d | 1 | 0.54mi |
| 5 Lake Eden Dr Boynton Beach, FL | 3.0 | 2.5 | 2841 | $5,700 | $2.01 | 26d | 1 | 0.72mi |
| 30 Beechdale Ln Boynton Beach, FL | 3.0 | 2.5 | 2226 | $3,300 | $1.48 | 24d | 1 | 0.73mi |
| 81 Nottingham Pl Boynton Beach, FL | 3.0 | 2.5 | 2209 | $3,500 | $1.58 | 19d | 1 | 0.79mi |
| 81 Nottingham Pl Boynton Beach, FL | 3.0 | 2.5 | 2209 | $3,500 | $1.58 | 24d | 1 | 0.79mi |
| 135 SE 28th Ct Boynton Beach, FL | 3.0 | 2.0 | 1890 | $7,900 | $4.18 | 26d | 1 | 0.85mi |
| 17 Country Lake Cir Boynton Beach, FL | 3.0 | 2.5 | 2312 | $4,250 | $1.84 | 26d | 1 | 0.88mi |
| 17 Country Lake Cir Boynton Beach, FL | 3.0 | 2.5 | 2312 | $4,250 | $1.84 | 24d | 1 | 0.88mi |
| 1801 Coastal Bay Blvd Boynton Beach, FL | 3.0 | 2.5 | 1978 | $3,500 | $1.77 | 26d | 1 | 1.27mi |
| 1801 Coastal Bay Blvd Unit 1801 Boynton Beach, FL | 3.0 | 2.5 | 1978 | $3,750 | $1.90 | 26d | 1 | 1.27mi |
| 3218 Palm Dr Delray Beach, FL | 3.0 | 3.0 | 2012 | $15,000 | $7.46 | 9d | 1 | 1.27mi |
| 3261 Estancia Ln Boynton Beach, FL | 3.0 | 3.5 | 2200 | $4,950 | $2.25 | 26d | 1 | 1.29mi |
| 6 NE 19th St Delray Beach, FL | 3.0 | 2.5 | 2393 | $10,000 | $4.18 | 26d | 1 | 1.29mi |
| 18 Bristol Ln Boynton Beach, FL | 3.0 | 3.0 | 3293 | $10,000 | $3.04 | 26d | 1 | 1.31mi |
| 2210 NE 3rd Ave Delray Beach, FL | 3.0 | 4.5 | 2300 | $10,000 | $4.35 | 5d | 1 | 1.33mi |
| 1507 Pine Ln Delray Beach, FL | 4.0 | 3.5 | 2660 | $18,000 | $6.77 | 26d | 1 | 1.38mi |
| 302 NW 16th St Delray Beach, FL | 4.0 | 3.0 | 2304 | $15,500 | $6.73 | 26d | 1 | 1.39mi |
| 3219 Karen Dr Delray Beach, FL | 4.0 | 3.0 | 2358 | $20,000 | $8.48 | 26d | 1 | 1.41mi |
| 3211 Karen Dr Delray Beach, FL | 2.0 | 2.5 | 1752 | $12,500 | $7.13 | 20d | 1 | 1.41mi |
| 18 NW 15th St Delray Beach, FL | 4.0 | 4.5 | 3640 | $25,000 | $6.87 | 26d | 1 | 1.48mi |
Listing history 13 events
-
2026-06-07statusdays on market $790,000 Pending 36 DOM
-
2026-06-04days on market $790,000 Active Under Contract 35 DOM
-
2026-06-03days on market $790,000 Active Under Contract 34 DOM
-
2026-06-02days on market $790,000 Active Under Contract 33 DOM
-
2026-06-01days on market $790,000 Active Under Contract 32 DOM
-
2026-05-31days on market $790,000 Active Under Contract 31 DOM
-
2026-05-06historical Active Under Contract
-
2026-04-30$790,000 Active
-
2007-08-26historical
-
2007-04-29$385,000
-
2002-09-04soldstatus $200,000
-
2001-02-01soldstatus $158,500
-
1986-04-01soldstatus $66,500
ⓘ Source: listings_history table (triggers on properties + properties_extension) + one-shot
backfill from property_details.listing_events for pre-trigger history.
Tax reassessment forecast FL · Resets to sale price
- Current annual tax
- $3,743 · $312/mo
- Projected year-2 tax
- $6,557 · $546/mo
- Expected delta
- +$2,814/yr (+$234/mo · 75.2%)
ⓘ Screening estimate from a state-policy table — verify with the county assessor before closing.
Climate risk First Street
- Flood 4/10 Moderate FEMA zone X (unshaded) · 24% chance over 30 yrs
- Wildfire 1/10 Low
- Heat 10/10 Extreme 7 d/yr ≥105°F today · 26 d/yr by 30 yrs out
- Wind 10/10 Extreme 99% chance of damaging wind over 30 yrs
- Air quality 2/10 Low 1 unhealthy d/yr today · 2 by 30 yrs out
Nearby sold comps map
Loading sold comps map…
Walkable amenities ~0.75 mi
Loading nearby amenities…
Taxation est. · year 1
- Rental income
- $73,082
- − Mortgage interest
- −$44,252
- − Property taxes
- −$3,743
- − Insurance
- −$3,950
- − Repairs & maintenance
- −$5,847
- − Management
- −$5,847
- − Depreciation
- −$22,982
- Taxable loss
- −$13,538
- Est. tax savings @ 24.0%
- +$3,249
- After-tax cash flow
- $3,577/yr
For passive investors: Depreciation is non-cash, so a rental often shows a tax loss while cash-flowing — sheltering income. Rental losses are passive: they offset passive income freely, and up to $25,000/yr can offset ordinary (W-2) income if you actively participate and your MAGI is under $100k (phasing out to $0 by $150k); unused losses carry forward. On sale, claimed depreciation is recaptured at up to 25%, and gains may owe capital-gains tax (a 1031 exchange can defer both). Figures are a year-1 estimate at your 24.0% rate — not tax advice; consult a CPA.
Schools (NCES district)
- District
- Palm Beach
- NCES district ID
- 1201500
- Math proficiency
- 46% ▼ -16.00%
- Reading proficiency
- 53% ▼ -4.00%
- Median HH income
- $53,943
- Composite
- 42.72/100
- National rank
- #3160
- State rank
- #34 of 73 in FL
Livability — Boynton Beach
- Score
- 72/100
- State rank
- #351
- US rank
- #6098
Category grades
Schools grade is shown separately in the Schools card above.
Census & demographics
- Census place
- Boynton Beach, FL
- County
- Palm Beach County · 1,438,312 people
- City population
- 148,060
- Metro
- Miami-Fort Lauderdale-Pompano Beach, FL
- Population (ZIP)
- 24,255
- Household income
- $74,223
- Rent vs Own
- Severe rent burden
- 1417.0
Population outlook (Palm Beach County) Hauer SSP2
- Today (2025)
- 1,637,487 people
- By 2030
- 1,743,255 · +6.5%
- By 2040
- 1,948,712 · +19.0%
- By 2050
- 2,132,979 · +30.3%
- By 2075
- 2,530,027 · +54.5%
- By 2100
- 2,706,979 · +65.3%
Race, ethnicity, and origin ACS 2023
- Neighborhood character
- Diverse neighborhood (Simpson 0.66)
- Race & ethnicity
- White 51% Black 23% Hispanic / Latino 17% Two or more races 14% Asian 4%
- Hispanic origin (detail)
- Puerto Rican 3% Cuban 2%
- Common ancestry
- Hispanic 9% Romanian 2% Lithuanian 2%
- Foreign-born
- 29% · Canada, Jamaica, Vietnam
- Languages at home
- 66% English-only · Spanish 16% French/Haitian/Cajun 11% Other Indo-European 5%
Political lean MEDSL · Palm Beach
- 2024 margin
- Toss-up / Even · D 50.0% · R 49.2%
- 2008→2024 swing
- -22.1pp toward R · 2008: 22.9pp · 2024: 0.8pp
- All cycles
- 2024: D+0.8 2020: D+12.8 2016: D+15.3 2012: D+17.0 2008: D+22.9
Not yet ingested
- Civics
- —
Market trends
- HPI YoY
- ▼ -205.96%
- Current HPI
- 335.3805
- Rent YoY
- ▲ 0.93%
- Metro
- Miami-Fort Lauderdale-Pompano Beach, FL
- State GDP YoY
- ▲ 3.28%
- F500 in state
- 36
Industry mix (Fortune 500 HQ in FL)
| Industry | F500 HQs | Revenue |
|---|---|---|
| Industrial Technology | 2 | $29B |
|
||
| Insurance | 2 | $17B |
|
||
| Retail | 1 | $60B |
|
||
| Technology Distribution | 1 | $58B |
|
||
| Homebuilding | 1 | $35B |
|
||
| Technology Manufacturing | 1 | $35B |
|
||
Price history
+1088.0% since first listed7 events — show timeline
- 2026-05-06 Contingent — Beaches MLS
- 2026-04-30 Listed $790,000 Beaches MLS
- 2007-08-26 Listing Removed — Beaches MLS
- 2007-04-29 Listed $385,000 Beaches MLS
- 2002-09-04 Sold (Public Records) $200,000 Public Records
- 2001-02-01 Sold (Public Records) $158,500 Public Records
- 1986-04-01 Sold (Public Records) $66,500 Public Records
Property tax history
+1.8%/yrLatest (2025): $3,743 · +3.1% YoY. Source: county tax records.
Cash-flow waterfall
monthlySold comps — $/sqft
last 12 mo · ≤1 miLoading sold comps…