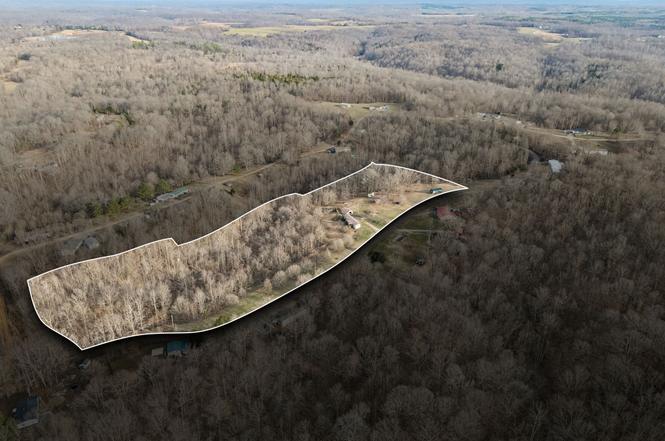
155 Big Ridge Rd · Cumberland City, TN
Flood risk 1/10 · Minimal
- FEMA flood zone
- X (unshaded)
- Chance of flooding over 30 yrs
- 0.0%
- Est. flood insurance / yr
- $507 – $1,088
Fire risk 4/10 · Minor
- Est. fire insurance / yr
- $949 – $1,763
Heat risk 5/10 · Moderate
- Hot days now (above 106°F)
- 7 days/yr
- Hot days in 30 yrs
- 20 days/yr
Wind risk 4/10 · Minor
- Chance of severe wind over 30 yrs
- 8.0%
Air-quality risk 2/10 · Minimal
- Unhealthy air days now
- 0 days/yr
- Unhealthy air days in 30 yrs
- 1 days/yr
Risk factors via First Street. Map © Google.
Why this score? — see what drove the C- grade
The composite is a weighted blend of 9 inputs, each scored 0–100. Each bar is that input's sub-score; the figure is the points it added to the 100-point composite (weight × sub-score).
- Cash flow +19.7/30.0
- ARV discount +7.5/15.0
- DSCR +6.2/10.0
- 1% rule +5.2/10.0
- Appreciation +3.9/10.0
- Schools +3.0/10.0
- Livability +2.6/5.0
- Rent growth +2.5/5.0
- Condition / age +2.5/5.0
$125,000
🖨 Deal sheet (PDF) 📄 Offer letter ✓ Due diligence
Listing remarks
Discover the perfect blend of privacy, natural beauty, and opportunity with this stunning 7 acre unrestricted property in Indian Mound, Tennessee. Nestled in the heart of Stewart County, this expansive tract offers the ideal setting for your dream home, weekend retreat, or investment opportunity. Enjoy peaceful country living with plenty of room to build, explore, and create your own private oasis. The property features gently rolling terrain, mature trees, and open space—perfect for a homesite, recreational use, or small hobby farm. With abundant wildlife and scenic surroundings, you'll love the tranquility and charm this land provides. Conveniently located just minutes from downtown
Key facts
- Open space
- 7 acre property
- Abundant wildlife
Tags
Property features AI
Finance
- HOA & community: Pets allowed
Exterior
- Parking: Detached parking; Carport with space for 2 vehicles; 2 covered parking spaces (2 total parking spaces)
- Utilities: Well water; Septic tank
- Home design: Residential mobile home; One story
- Construction: Vinyl siding construction; Existing (previously built)
- Exterior features: Cleared, level and private lot
Interior
- Kitchen: Built-in electric oven; Built-in electric range; Refrigerator
- Bedrooms: 4 bedrooms (all on the main level)
- Flooring: Carpet flooring
- Bathrooms: 2 full bathrooms
- Heating & cooling: Central heating; Central air conditioning
- Interior features: Built-in electric oven; Built-in electric range; Refrigerator
Neighborhood map
What this means for you Summary
Snapshot
- This is a 4-bed/2.0-bath manufactured listed at $125k.
Deal economics
- At list price, monthly cash flow is $146 ($2k/yr) — positive.
- The deal already cash-flows at list — no discount required.
- Meets the 1% rule at list price ($1k rent vs $125k).
- Recommended offer: $114k (9.0% below list) — sets the bar for market timing.
- Cap rate 7.7% vs local median 2.6% in Cumberland City — top-decile yield for the area; either an underpriced asset or a hidden risk that comps aren't pricing in. Stress-test before assuming the spread holds.
Location & tenants
- Location reads 51/100 on livability (#409 in TN) — a working-class tenant base; expect higher turnover. Strengths: cost of living A+, housing A-; Watch: crime F, amenities F, commute F.
- Stewart County (rural): math 36% / reading 35% proficiency, ranked #30 of 139 in TN (top 22%) — families likely to look elsewhere, expect single-tenant / working-renter base with shorter leases.
- Zoned schools: North Stewart Elementary (math 47% / reading 42%, grade F, #164 of 952 statewide, top 19%, 432 students, 0% FRL); Stewart Co High School (math 2% / reading 32%, grade F, #215 of 332 statewide, top 67%, 627 students, 0% FRL) — zoned schools average 0% FRL vs 50% district-wide (50 pts lower); this property's tenant base skews higher-income than the district average.
- Market conditions: 59 active listings in the ZIP; 15 units permitted in Stewart County in 2024 (0 in 5+ unit buildings).
Forward outlook
- Local home prices are declining (-2.1%/yr); year-one equity from $864 of loan paydown is wiped out by about $3k of value loss. Plan a longer hold.
- Stewart County population projected at -12% by 2050 — secular population decline; favor cash flow + early exit over multi-decade hold.
Negotiation context
- It's been on market 108 days — a 9% lower offer ($114k) is reasonable based on typical stale-listing flexibility.
- 3 sale attempts since 11y ago; this cycle's ask has dropped $30k (19%) from the opening price — seller is motivated, your offer sets the floor, not the list.
- Current owner paid $12k; list at $125k implies a 942% gain — meaningful room to come down on a strong offer.
Risks & watch-outs
- Climate carrying-cost: extreme-heat days projected 7→20/yr by 2055 (HVAC capex compounding) — expect insurance premiums to compound above CPI over the hold.
Questions for the listing agent
- It's been on market 108 days. Have you received any prior offers? Is the seller open to a 9% concession, seller financing, or rate buy-down credit?
- Why hasn't it sold? Are there any deal-killer items the seller is aware of (foundation, flood, title, zoning, code violations)?
- Is there a deadline driving the sale (1031 exchange, divorce, estate, relocation)? That informs how much negotiation room exists.
- Schools are F-rated, which usually means shorter tenancies and higher turnover. Who's the typical renter profile here, and what's been the actual vacancy rate?
- Crime grade is F in this area — have there been break-ins, vandalism, or insurance claims at this property in the last 3 years? What carrier currently insures it and at what premium?
- What's the average days-on-market for RENTAL listings here right now (not sales)? A rising rental-DOM trend means longer vacancies and softer asking-rent achievability than the comps imply.
- What's the recent tenant-quality profile in this submarket — average credit score on applications, eviction rate, late-payment / NSF rate, and stable-employment percentage? A property-management company in the area should have these aggregated.
- How much new for-sale + rental construction is in the pipeline within 1–3 miles? Heavy new supply typically softens prices + rents 12–24 months out; constrained supply supports both.
Investment metrics
- 1% rule
- 1.02% ✓
- Cap rate
- 7.69%
- Cash-on-cash
- 5.00%
- DSCR
- 1.22
- GRM
- 8.1
CMA / ARV
No comps found within radius.
Projected returns pro-forma
-2.15% appreciation · 3.0% rent growth · sell at horizon
- IRR
- -4.6%
- Equity multiple
- 0.82×
- Total profit
- $-6,449
- Equity at exit
- $23,416
- IRR
- 3.6%
- Equity multiple
- 1.30×
- Total profit
- $10,408
- Equity at exit
- $19,196
Cash invested: $35,000 (down + closing). Projections, not guarantees.
Landlord ↔ Tenant lean methodology
- Overall (STATE)
- 87 Strongly Landlord-Friendly
- State Tennessee
- 87 Strongly Landlord-Friendly · R+13
- County
- — inherits STATE
- City
- — inherits STATE
ZIP-level market 37079
- Home prices YoY
- -0.7%
- Active inventory
- 59
- Price-to-rent
- 8.1×
Monthly cashflow live
- Estimated rent
- $1,278 medium interval (Pro) →
- Mortgage (P&I)
- −$656
- Tax est. 1.5%
- −$156 /mo · $1,875/yr
- Insurance
- −$52
- HOA
- −$0
- Vacancy / Maint / Mgmt
- −$268
- Net cashflow
- $146
Break-even live
Sensitivity live
| Price | -10% $232 | -5% $189 | +0% $146 | +5% $103 | +10% $60 |
|---|---|---|---|---|---|
| Rent | -10% $45 | -5% $95 | +0% $146 | +5% $196 | +10% $247 |
| Rate | -1.0pp $209 | -0.5pp $178 | base $146 | +0.5pp $114 | +1.0pp $81 |
UW: 25.0% down · 7.5% · 30yr · 1.5% tax · 5.0% vac · 8.0% maint · 8.0% mgmt
Financing live
Cash to close
- Down payment
- $31,250
- Closing costs
- $3,750
- Reserves months
- —
- Total cash needed
- —
Loan-product check · same deal, 3 products live
Conventional
25% down · 7.5% · 30yr
- Down + closing
- —
- Monthly P&I
- —
- Monthly cashflow
- —
- DSCR
- —
- Eligible?
- —
Personal DTI + credit; lowest rate.
DSCR
20% down · 8.5% · 30yr
- Down + closing
- —
- Monthly P&I
- —
- Monthly cashflow
- —
- DSCR
- —
- Eligible?
- —
No personal income docs; deal must DSCR.
Hard money
10% down · 12.0% · 12mo
- Down + closing
- —
- Monthly P&I
- —
- Monthly cashflow
- —
- DSCR
- —
- Eligible?
- —
Short-term bridge; refi at stabilization.
Listing history 26 events
-
2026-06-21days on market $125,000 Active 108 DOM
-
2026-06-18days on market $125,000 Active 106 DOM
-
2026-06-17days on market $125,000 Active 105 DOM
-
2026-06-16days on market $125,000 Active 104 DOM
-
2026-06-15days on market $125,000 Active 103 DOM
-
2026-06-13days on market $125,000 Active 101 DOM
-
2026-06-12days on market $125,000 Active 100 DOM
-
2026-06-09days on market $125,000 Active 97 DOM
-
2026-06-08days on market $125,000 Active 96 DOM
-
2026-06-08days on market $125,000 Active 95 DOM
-
2026-06-07days on market $125,000 Active 94 DOM
-
2026-06-03days on market $125,000 Active 91 DOM
-
2026-06-02days on market $125,000 Active 90 DOM
-
2026-06-01days on market $125,000 Active 89 DOM
-
2026-05-31days on market $125,000 Active 88 DOM
-
2026-03-05$155,000 Active
-
2018-08-11historical
-
2018-06-18price $120,000
-
2018-06-11$130,000 Active
-
2016-10-04soldstatus $12,000
-
2015-10-23soldstatus $80,000
-
2015-10-15historical
-
2015-10-15status Pending
-
2015-09-28historical Contingent - Financing
-
2015-09-05$95,000 Active
-
2001-04-09soldstatus $14,000
ⓘ Source: listings_history table (triggers on properties + properties_extension) + one-shot
backfill from property_details.listing_events for pre-trigger history.
Climate risk First Street
- Flood 1/10 Low FEMA zone X (unshaded) · 0% chance over 30 yrs
- Wildfire 4/10 Moderate
- Heat 5/10 Major 7 d/yr ≥106°F today · 20 d/yr by 30 yrs out
- Wind 4/10 Moderate 8% chance of damaging wind over 30 yrs
- Air quality 2/10 Low 0 unhealthy d/yr today · 1 by 30 yrs out
Nearby sold comps map
Loading sold comps map…
Walkable amenities ~0.75 mi
Loading nearby amenities…
Taxation est. · year 1
- Rental income
- $15,339
- − Mortgage interest
- −$7,002
- − Property taxes
- −$1,875
- − Insurance
- −$625
- − Repairs & maintenance
- −$1,227
- − Management
- −$1,227
- − Depreciation
- −$3,636
- Taxable loss
- −$254
- Est. tax savings @ 24.0%
- +$61
- After-tax cash flow
- $1,812/yr
For passive investors: Depreciation is non-cash, so a rental often shows a tax loss while cash-flowing — sheltering income. Rental losses are passive: they offset passive income freely, and up to $25,000/yr can offset ordinary (W-2) income if you actively participate and your MAGI is under $100k (phasing out to $0 by $150k); unused losses carry forward. On sale, claimed depreciation is recaptured at up to 25%, and gains may owe capital-gains tax (a 1031 exchange can defer both). Figures are a year-1 estimate at your 24.0% rate — not tax advice; consult a CPA.
Schools (NCES district)
- District
- Stewart County
- NCES district ID
- 4703960
- Math proficiency
- 36% ▼ -4.00%
- Reading proficiency
- 35% ▼ -5.00%
- Median HH income
- $41,035
- Composite
- 29.92/100
- National rank
- #6383
- State rank
- #30 of 139 in TN
Livability — Cumberland City
- Score
- 51/100
- State rank
- #409
- US rank
- #25436
Category grades
Schools grade is shown separately in the Schools card above.
Census & demographics
- City population
- 2,028
- Population (ZIP)
- 2,770
Population outlook (Stewart County) Hauer SSP2
- Today (2025)
- 13,019 people
- By 2030
- 12,780 · -1.8%
- By 2040
- 12,152 · -6.7%
- By 2050
- 11,484 · -11.8%
- By 2075
- 10,249 · -21.3%
- By 2100
- 9,338 · -28.3%
Race, ethnicity, and origin ACS 2023
- Neighborhood character
- Predominantly White (90%)
- Race & ethnicity
- White 90% Two or more races 6% Black 4% Hispanic / Latino 1%
- Common ancestry
- Serbian 3% Lithuanian 2% Iranian 1%
- Foreign-born
- 0%
- Languages at home
- 98% English-only · Spanish 2%
Political lean MEDSL · Stewart
- 2024 margin
- Solid R (+63.9) · D 17.5% · R 81.4% · Other 1.1%
- 2008→2024 swing
- -55.1pp toward R · 2008: -8.8pp · 2024: -63.9pp
- All cycles
- 2024: R+63.9 2020: R+59.0 2016: R+50.0 2012: R+17.5 2008: R+8.8
Not yet ingested
- Civics
- —
Market trends
- HPI YoY
- ▼ -2.15%
- Current HPI
- 290.1436
- Rent YoY
- —
- Metro
- —
- State GDP YoY
- ▲ 2.78%
- F500 in state
- 22
Industry mix (Fortune 500 HQ in TN)
| Industry | F500 HQs | Revenue |
|---|---|---|
| Healthcare | 3 | $91B |
|
||
| Retail | 3 | $72B |
|
||
| Transportation / Logistics | 1 | $88B |
|
||
| Paper / Packaging | 1 | $19B |
|
||
| Insurance | 1 | $13B |
|
||
| Energy | 1 | $12B |
|
||
Price history
+1007.1% since first listed11 events — show timeline
- 2026-03-05 Listed $155,000 REALTRACS as Distributed by MLS Grid
- 2018-08-11 Listing Removed — REALTRACS as Distributed by MLS Grid
- 2018-06-18 Price Changed $120,000 REALTRACS as Distributed by MLS Grid
- 2018-06-11 Listed $130,000 REALTRACS as Distributed by MLS Grid
- 2016-10-04 Sold (Public Records) $12,000 Public Records
- 2015-10-23 Sold (Public Records) $80,000 Public Records
- 2015-10-15 Listing Removed — REALTRACS as Distributed by MLS Grid
- 2015-10-15 Pending — REALTRACS as Distributed by MLS Grid
- 2015-09-28 Contingent — REALTRACS as Distributed by MLS Grid
- 2015-09-05 Listed $95,000 REALTRACS as Distributed by MLS Grid
- 2001-04-09 Sold (Public Records) $14,000 Public Records
Property tax history
-4.7%/yrLatest (2025): $233 · +0.0% YoY. Source: county tax records.
Cash-flow waterfall
monthlySold comps — $/sqft
last 12 mo · ≤1 miLoading sold comps…