6111 Sinclair · San Antonio, TX
Flood risk 1/10 · Minimal
- FEMA flood zone
- X (unshaded)
- Chance of flooding over 30 yrs
- 0.0%
- Est. flood insurance / yr
- $507 – $1,088
Fire risk 4/10 · Minor
- Est. fire insurance / yr
- $1,222 – $2,270
Heat risk 8/10 · Major
- Hot days now (above 110°F)
- 7 days/yr
- Hot days in 30 yrs
- 23 days/yr
Wind risk 8/10 · Major
- Chance of severe wind over 30 yrs
- 80.0%
Air-quality risk 2/10 · Minimal
- Unhealthy air days now
- 0 days/yr
- Unhealthy air days in 30 yrs
- 2 days/yr
Risk factors via First Street. Map © Google.
Why this score? — see what drove the D- grade
The composite is a weighted blend of 9 inputs, each scored 0–100. Each bar is that input's sub-score; the figure is the points it added to the 100-point composite (weight × sub-score).
- ARV discount +11.2/15.0
- Cash flow +10.0/30.0
- Livability +4.0/5.0
- 1% rule +3.6/10.0
- Rent growth +3.6/5.0
- DSCR +2.9/10.0
- Condition / age +2.5/5.0
- Schools +1.9/10.0
- Appreciation +0.0/10.0
$199,999
🖨 Deal sheet (PDF) 📄 Offer letter ✓ Due diligence
Listing remarks MLS
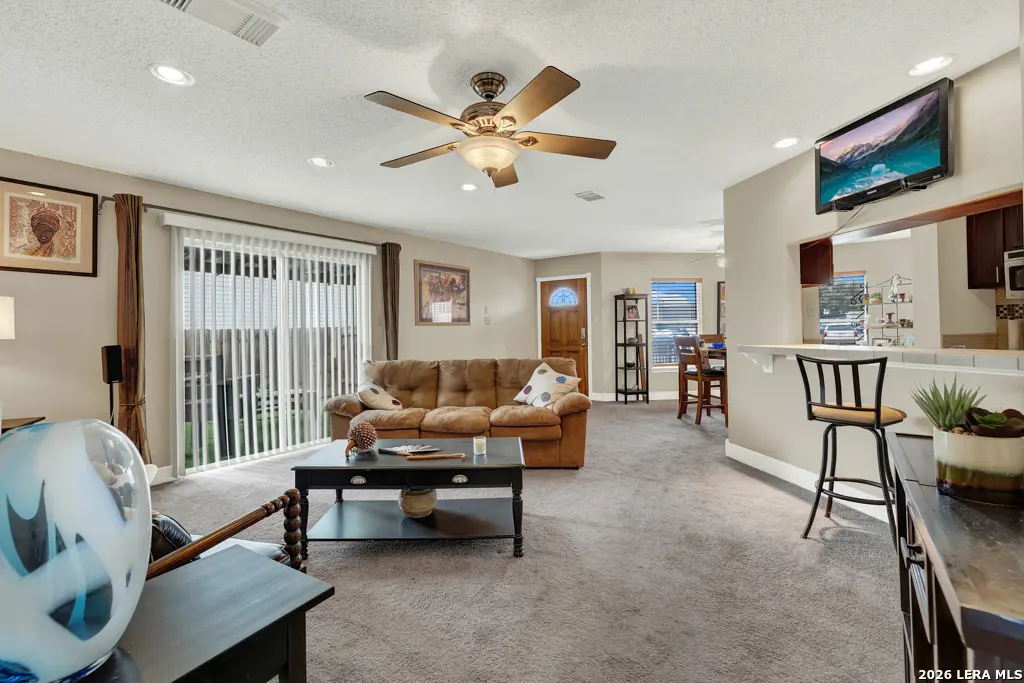
NEW LOW PRICE!! Welcome to 6111 Sinclair in San Antonio's established Lakeside community-a well-cared-for 3-bedroom, 2-bath home offering 1,305 square feet of comfortable living in a location that makes everyday life easier. Step inside to a functional layout designed for both comfort and connection. The primary suite is tucked privately at the back of the home, creating a quiet space to unwind, while the secondary bedrooms are positioned up front-ideal for kids, guests, or a home office. The living and dining areas flow naturally into the kitchen, making it easy to stay connected whether you're cooking, hosting, or spending time together. A large pantry and dedicated utility room add the kind of storage and organization families truly appreciate. Each bedroom offers generous space, making this home a great fit for first-time buyers, growing families, or those needing extra flexibility for work-from-home or guests. The home has been well maintained and is move-in ready, with the opportunity to add your own personal touches over time. Step outside to a covered patio overlooking a level, fenced backyard-perfect for kids, pets, weekend BBQs, or relaxing evenings. A storage shed adds extra functionality, and being directly across from Sinclair Elementary makes daily routines even more convenient. Location is key, and this home delivers. With quick access to Loop 410, commuting to downtown San Antonio, Fort Sam Houston, and Randolph Air Force Base is simple. Plus, you're just minutes from Calaveras Lake and Braunig Lake for fishing, boating, and outdoor fun. Whether you're looking for your first home, a place to grow, or an investment opportunity in a high-demand area, 6111 Sinclair offers comfort, convenience, and long-term value.
Key facts
- Primary suite
- Covered patio
- Storage shed
Tags
Neighborhood map
What this means for you Summary
Snapshot
- This is a 3-bed/2.0-bath single-family listed at $200k.
Deal economics
- At list price, monthly cash flow is $-119 ($-1k/yr) — negative.
- To cash-flow at today's rent, offer at most $179k (10.5% below list).
- To meet the 1% rule (rent ≥ 1% of price), the offer needs to be $172k (13.9% below list).
- Recommended offer: $172k (13.9% below list) — sets the bar for 1% rule.
- Cap rate 5.6% vs local median 3.8% in San Antonio — top-decile yield for the area; either an underpriced asset or a hidden risk that comps aren't pricing in. Stress-test before assuming the spread holds.
Location & tenants
- Location reads 80/100 on livability (#31 in TX, #1,616 nationally) — a professional / high-income tenant draw. Strengths: amenities A+, commute A+, cost of living A+; Watch: crime F.
- East Central ISD (rural): math 16% / reading 25% proficiency, ranked #758 of 826 in TX (top 92%) — low school quality limits family demand, transient renter base, plan for 1-2y turnover; 61% free/reduced lunch — lower-income household profile, screen leases tightly.
- Zoned schools: Sinclair El (math 13% / reading 20%, grade F, #3,946 of 4,322 statewide, top 92%, 721 students, 71% FRL); Legacy Middle (math 13% / reading 24%, grade F, #1,478 of 1,662 statewide, top 90%, 1,137 students, 58% FRL); East Central H S (math 21% / reading 28%, grade F, #1,264 of 1,632 statewide, top 82%, 3,252 students, 52% FRL) — zoned schools at 60% FRL track the district average.
- Market conditions: Rents rising fast (+4.3%/yr); 444 active listings in the ZIP; 40 comparable units currently listed for rent nearby; rentals at typical pace (median 26d on market — plan ~3-4 weeks tenant-placement turnaround); 8,308 units permitted in Bexar County in 2024 (2,506 in 5+ unit buildings).
- This rent runs 31% of the median local income ($66k/yr) — at the standard rent-burdened threshold; future hikes will face affordability resistance.
Forward outlook
- Local home prices are declining (-3.0%/yr); year-one equity from $1k of loan paydown is wiped out by about $6k of value loss. Plan a longer hold.
- Bexar County population projected at +50% by 2050 — long-run rental-demand tailwind backs the buy-and-hold thesis.
Negotiation context
- It's been on market 110 days — a 9% lower offer ($182k) is reasonable based on typical stale-listing flexibility.
- 4 sale attempts since 9y ago with the ask held roughly flat each time — persistent listings suggest the price (not the market) is what's stuck; bring a comps-based counter.
Risks & watch-outs
- Climate carrying-cost: severe wind risk, 80% chance of damaging wind over 30y; extreme-heat days projected 7→23/yr by 2055 (HVAC capex compounding) — expect insurance premiums to compound above CPI over the hold.
Questions for the listing agent
- What do current leases actually rent for vs. the listed asking? Can we see a recent rent roll and the last 12 months of T-12 income?
- It's been on market 110 days. Have you received any prior offers? Is the seller open to a 14% concession, seller financing, or rate buy-down credit?
- Why hasn't it sold? Are there any deal-killer items the seller is aware of (foundation, flood, title, zoning, code violations)?
- Is there a deadline driving the sale (1031 exchange, divorce, estate, relocation)? That informs how much negotiation room exists.
- Crime grade is F in this area — have there been break-ins, vandalism, or insurance claims at this property in the last 3 years? What carrier currently insures it and at what premium?
- The area grade is low — what's the realistic commute time and amenity access for the typical tenant pool here? Any planned neighborhood developments (good or bad) we should know about?
- What's the average days-on-market for RENTAL listings here right now (not sales)? A rising rental-DOM trend means longer vacancies and softer asking-rent achievability than the comps imply.
- What's the recent tenant-quality profile in this submarket — average credit score on applications, eviction rate, late-payment / NSF rate, and stable-employment percentage? A property-management company in the area should have these aggregated.
- How much new for-sale + rental construction is in the pipeline within 1–3 miles? Heavy new supply typically softens prices + rents 12–24 months out; constrained supply supports both.
Investment metrics
- 1% rule
- 0.86% ✗
- Cap rate
- 5.58%
- Cash-on-cash
- -2.56%
- DSCR
- 0.89
- GRM
- 9.7
CMA / ARV
- ARV (median comp)
- $217,871
- List price
- $199,999
- Delta
- -8.20%
- Verdict
- FAIR
- Comps
- 20 within 1.0 mi
Show comp detail 12 sales within ~0.75 mi
| Address | Dist | Beds/Ba | Sqft | Sold | Price | $/sf | Match |
|---|---|---|---|---|---|---|---|
| 3831 Southton | 0.04mi | 3/2.5 | 1,415 (+8%) | 1mo | $190,000 | $134 | 81 |
| 6002 Blind | 0.23mi | 3/2.0 | 1,232 (-6%) | 2mo | $100,000 | $81 | 79 |
| 3530 Horizon Lk | 0.39mi | 3/2.0 | 1,272 (-2%) | 2mo | $185,000 | $145 | 76 |
| 6127 Southern Vis | 0.15mi | 3/2.5 | 1,415 (+8%) | 1mo | $189,900 | $134 | 76 |
| 5527 Rosillo Hl | 0.62mi | 3/2.0 | 1,310 (+0%) | 1mo | $189,900 | $145 | 69 |
| 4615 Flying Hooves | 0.66mi | 3/2.5 | 1,286 (-2%) | 0mo | $199,990 | $156 | 64 |
| 4631 Flying Hooves | 0.69mi | 3/2.5 | 1,286 (-2%) | 2mo | $214,990 | $167 | 62 |
| 3571 Glacier Lk | 0.45mi | 3/2.0 | 1,436 (+10%) | 2mo | $125,000 | $87 | 60 |
| 5954 Celestite Bnd | 0.59mi | 4/2.0 (+1) | 1,359 (+4%) | 1mo | $236,000 | $174 | 60 |
| 5962 Celestite Bnd | 0.59mi | 3/2.0 | 1,190 (-9%) | 1mo | $225,000 | $189 | 57 |
| 4722 Beryl Loop | 0.54mi | 3/2.5 | 1,419 (+9%) | 2mo | $245,095 | $173 | 57 |
| 3551 Lake Tahoe | 0.49mi | 3/2.0 | 1,131 (-13%) | 2mo | $180,000 | $159 | 54 |
Match score weights: distance 35% · size 25% · config 20% · recency 20%. Top-matched comps best support the ARV.
Projected returns pro-forma
-3.0% appreciation · 4.35% rent growth · sell at horizon
- IRR
- -18.9%
- Equity multiple
- 0.33×
- Total profit
- $-37,552
- Equity at exit
- $29,821
- IRR
- -8.7%
- Equity multiple
- 0.43×
- Total profit
- $-32,135
- Equity at exit
- $17,292
Cash invested: $56,000 (down + closing). Projections, not guarantees.
Landlord ↔ Tenant lean methodology
- Overall (STATE)
- 87 Strongly Landlord-Friendly
- State Texas
- 87 Strongly Landlord-Friendly · R+5
- County
- — inherits STATE
- City
- — inherits STATE
ZIP-level market 78222
- Home prices YoY
- -4.8%
- Rents YoY
- 4.3%
- Active inventory
- 444
- Price-to-rent
- 9.7×
Monthly cashflow live
- Estimated rent
- $1,723 high interval (Pro) →
- Mortgage (P&I)
- −$1,049
- Tax from tax record
- −$348 /mo · $4,178/yr
- Insurance
- −$83
- HOA
- −$0
- Vacancy / Maint / Mgmt
- −$362
- Net cashflow
- $-119
Break-even live
Sensitivity live
| Price | -10% $-6 | -5% $-63 | +0% $-119 | +5% $-176 | +10% $-233 |
|---|---|---|---|---|---|
| Rent | -10% $-255 | -5% $-187 | +0% $-119 | +5% $-51 | +10% $17 |
| Rate | -1.0pp $-19 | -0.5pp $-68 | base $-119 | +0.5pp $-171 | +1.0pp $-224 |
UW: 25.0% down · 7.5% · 30yr · 1.5% tax · 5.0% vac · 8.0% maint · 8.0% mgmt
Financing live
Cash to close
- Down payment
- $50,000
- Closing costs
- $6,000
- Reserves months
- —
- Total cash needed
- —
Loan-product check · same deal, 3 products live
Conventional
25% down · 7.5% · 30yr
- Down + closing
- —
- Monthly P&I
- —
- Monthly cashflow
- —
- DSCR
- —
- Eligible?
- —
Personal DTI + credit; lowest rate.
DSCR
20% down · 8.5% · 30yr
- Down + closing
- —
- Monthly P&I
- —
- Monthly cashflow
- —
- DSCR
- —
- Eligible?
- —
No personal income docs; deal must DSCR.
Hard money
10% down · 12.0% · 12mo
- Down + closing
- —
- Monthly P&I
- —
- Monthly cashflow
- —
- DSCR
- —
- Eligible?
- —
Short-term bridge; refi at stabilization.
Rent comps 40 comps
| Address | Beds | Baths | Sqft | Rent | $/sqft | DOM | Units | Dist |
|---|---|---|---|---|---|---|---|---|
| 6119 Southern Vis San Antonio, TX | 3.0 | 2.5 | 1246 | $1,685 | $1.35 | 26d | 1 | 0.15mi |
| 6115 Southern Vis San Antonio, TX | 3.0 | 2.0 | 1415 | $1,509 | $1.07 | 5d | 1 | 0.15mi |
| 5910 Sandy Lake St San Antonio, TX | 3.0 | 2.0 | 1389 | $2,100 | $1.51 | 46d | 1 | 0.27mi |
| 6023 Lake Victoria St San Antonio, TX | 3.0 | 2.0 | 1368 | $1,575 | $1.15 | 14d | 1 | 0.29mi |
| 2911 Lakebriar St San Antonio, TX | 4.0 | 2.0 | 1440 | $1,695 | $1.18 | 5d | 1 | 0.34mi |
| 2911 Lakebriar St San Antonio, TX | 4.0 | 2.0 | 1440 | $1,695 | $1.18 | 24d | 1 | 0.34mi |
| 6123 Flower Mdw San Antonio, TX | 4.0 | 2.0 | 1800 | $1,795 | $1.00 | 46d | 1 | 0.35mi |
| 6223 Still Mdw San Antonio, TX | 3.0 | 2.0 | 1330 | $1,650 | $1.24 | 6d | 1 | 0.35mi |
| 3535 Honey Mdw San Antonio, TX | 3.0 | 2.5 | 1438 | $1,400 | $0.97 | 18d | 1 | 0.36mi |
| 6323 Sinclair Rd San Antonio, TX | 3.0 | 2.0 | 1556 | $1,510 | $0.97 | 26d | 1 | 0.36mi |
| 2951 Lavender Mdw San Antonio, TX | 3.0 | 2.5 | 1246 | $1,530 | $1.23 | 14d | 1 | 0.37mi |
| 3510 Bottomless Lk San Antonio, TX | 2.0 | 2.0 | 1068 | $1,150 | $1.08 | 46d | 1 | 0.37mi |
| 6230 Lake Victoria St San Antonio, TX | 3.0 | 2.0 | 1205 | $1,465 | $1.22 | 5d | 1 | 0.38mi |
| 6307 Sloane Cv San Antonio, TX | 3.0 | 2.5 | 1416 | $1,460 | $1.03 | 0d | 1 | 0.39mi |
| 6147 Still Mdw San Antonio, TX | 3.0 | 2.0 | 1556 | $1,459 | $0.94 | 5d | 1 | 0.40mi |
| 2906 Lavender Mdw San Antonio, TX | 3.0 | 2.5 | 1246 | $1,495 | $1.20 | 4d | 1 | 0.44mi |
| 3239 Begonia Bnd San Antonio, TX | 3.0 | 2.0 | 1552 | $1,435 | $0.92 | 26d | 1 | 0.46mi |
| 3219 Begonia Bnd San Antonio, TX | 3.0 | 2.0 | 1552 | $1,500 | $0.97 | 6d | 1 | 0.47mi |
| 3155 Begonia Bnd San Antonio, TX | 3.0 | 2.0 | 1552 | $1,495 | $0.96 | 14d | 1 | 0.51mi |
| 4734 Shale Cv San Antonio, TX | 3.0 | 2.0 | 1247 | $1,725 | $1.38 | 26d | 1 | 0.54mi |
| 3131 Rosalind Way San Antonio, TX | 3.0 | 2.5 | 1247 | $1,650 | $1.32 | 26d | 1 | 0.55mi |
| 2610 Lakebriar St San Antonio, TX | 3.0 | 2.0 | 1724 | $1,675 | $0.97 | 46d | 1 | 0.56mi |
| 6119 Lakefront St San Antonio, TX | 3.0 | 2.5 | 1246 | $1,495 | $1.20 | 46d | 1 | 0.57mi |
| 5962 Celestite Bnd San Antonio, TX | 3.0 | 2.0 | 1190 | $1,723 | $1.45 | 0d | 1 | 0.59mi |
| 6427 Woodcliff Bnd San Antonio, TX | 3.0 | 2.5 | 1247 | $1,440 | $1.15 | 13d | 1 | 0.59mi |
| 5334 Hickory Pl San Antonio, TX | 3.0 | 2.0 | 1401 | $1,650 | $1.18 | 46d | 1 | 0.62mi |
| 5322 Flying Hooves San Antonio, TX | 3.0 | 2.5 | 1604 | $1,900 | $1.18 | 0d | 1 | 0.62mi |
| 5322 Flying Hooves San Antonio, TX | 3.0 | 2.5 | 1604 | $1,900 | $1.18 | 22d | 1 | 0.62mi |
| 4910 Sandstone Way San Antonio, TX | 3.0 | 2.5 | 1849 | $1,750 | $0.95 | 24d | 1 | 0.65mi |
| 4910 Sandstone Way San Antonio, TX | 3.0 | 2.5 | 1850 | $1,750 | $0.95 | 5d | 1 | 0.65mi |
| 5227 Hickory Pl San Antonio, TX | 3.0 | 2.0 | 1199 | $1,700 | $1.42 | 26d | 1 | 0.72mi |
| 5011 Blue Rnch San Antonio, TX | 3.0 | 2.5 | 1529 | $1,740 | $1.14 | 46d | 1 | 0.76mi |
| 5011 Jade Xing San Antonio, TX | 3.0 | 2.5 | 1239 | $1,590 | $1.28 | 46d | 1 | 0.77mi |
| 4226 Toledo Mist San Antonio, TX | 2.0 | 2.5 | 944 | $1,600 | $1.69 | 26d | 1 | 0.77mi |
| 5015 Jade Xing San Antonio, TX | 4.0 | 2.5 | 1798 | $1,820 | $1.01 | 13d | 1 | 0.78mi |
| 5019 Jade Xing San Antonio, TX | 3.0 | 2.5 | 1272 | $1,500 | $1.18 | 26d | 1 | 0.78mi |
| 5102 Blue Rnch San Antonio, TX | 3.0 | 2.5 | 1272 | $1,615 | $1.27 | 26d | 1 | 0.79mi |
| 5107 Jade Xing San Antonio, TX | 3.0 | 2.5 | 1419 | $1,575 | $1.11 | 26d | 1 | 0.80mi |
| 5106 Blue Rnch San Antonio, TX | 4.0 | 2.5 | 1798 | $1,820 | $1.01 | 46d | 1 | 0.80mi |
| 5107 Blue Rnch San Antonio, TX | 3.0 | 2.5 | 1529 | $1,740 | $1.14 | 26d | 1 | 0.80mi |
Listing history 31 events
-
2026-06-21days on market $199,999 Active 110 DOM
-
2026-06-18days on market $199,999 Active 107 DOM
-
2026-06-17days on market $199,999 Active 106 DOM
-
2026-06-16days on market $199,999 Active 105 DOM
-
2026-06-15days on market $199,999 Active 104 DOM
-
2026-06-13days on market $199,999 Active 102 DOM
-
2026-06-09days on market $199,999 Active 98 DOM
-
2026-06-08days on market $199,999 Active 97 DOM
-
2026-06-07days on market $199,999 Active 96 DOM
-
2026-06-04days on market $199,999 Active 93 DOM
-
2026-06-03days on market $199,999 Active 92 DOM
-
2026-06-02days on market $199,999 Active 91 DOM
-
2026-06-01days on market $199,999 Active 90 DOM
-
2026-05-31days on market $199,999 Active 89 DOM
-
2026-05-19price $199,999 1772-char remark
Show marketing remark (1772 chars)
NEW LOW PRICE!! Welcome to 6111 Sinclair in San Antonio's established Lakeside community-a well-cared-for 3-bedroom, 2-bath home offering 1,305 square feet of comfortable living in a location that makes everyday life easier. Step inside to a functional layout designed for both comfort and connection. The primary suite is tucked privately at the back of the home, creating a quiet space to unwind, while the secondary bedrooms are positioned up front-ideal for kids, guests, or a home office. The living and dining areas flow naturally into the kitchen, making it easy to stay connected whether you're cooking, hosting, or spending time together. A large pantry and dedicated utility room add the kind of storage and organization families truly appreciate. Each bedroom offers generous space, making this home a great fit for first-time buyers, growing families, or those needing extra flexibility for work-from-home or guests. The home has been well maintained and is move-in ready, with the opportunity to add your own personal touches over time. Step outside to a covered patio overlooking a level, fenced backyard-perfect for kids, pets, weekend BBQs, or relaxing evenings. A storage shed adds extra functionality, and being directly across from Sinclair Elementary makes daily routines even more convenient. Location is key, and this home delivers. With quick access to Loop 410, commuting to downtown San Antonio, Fort Sam Houston, and Randolph Air Force Base is simple. Plus, you're just minutes from Calaveras Lake and Braunig Lake for fishing, boating, and outdoor fun. Whether you're looking for your first home, a place to grow, or an investment opportunity in a high-demand area, 6111 Sinclair offers comfort, convenience, and long-term value.
-
2026-03-03$209,999 New 1772-char remark
Show marketing remark (1772 chars)
NEW LOW PRICE!! Welcome to 6111 Sinclair in San Antonio's established Lakeside community-a well-cared-for 3-bedroom, 2-bath home offering 1,305 square feet of comfortable living in a location that makes everyday life easier. Step inside to a functional layout designed for both comfort and connection. The primary suite is tucked privately at the back of the home, creating a quiet space to unwind, while the secondary bedrooms are positioned up front-ideal for kids, guests, or a home office. The living and dining areas flow naturally into the kitchen, making it easy to stay connected whether you're cooking, hosting, or spending time together. A large pantry and dedicated utility room add the kind of storage and organization families truly appreciate. Each bedroom offers generous space, making this home a great fit for first-time buyers, growing families, or those needing extra flexibility for work-from-home or guests. The home has been well maintained and is move-in ready, with the opportunity to add your own personal touches over time. Step outside to a covered patio overlooking a level, fenced backyard-perfect for kids, pets, weekend BBQs, or relaxing evenings. A storage shed adds extra functionality, and being directly across from Sinclair Elementary makes daily routines even more convenient. Location is key, and this home delivers. With quick access to Loop 410, commuting to downtown San Antonio, Fort Sam Houston, and Randolph Air Force Base is simple. Plus, you're just minutes from Calaveras Lake and Braunig Lake for fishing, boating, and outdoor fun. Whether you're looking for your first home, a place to grow, or an investment opportunity in a high-demand area, 6111 Sinclair offers comfort, convenience, and long-term value.
-
2026-01-29historical
-
2026-01-06price $209,999
-
2025-11-20$214,999 New
-
2021-11-05soldstatus Sold
-
2021-11-05soldstatus
-
2021-11-04status Pending
-
2021-10-05historical Active Option
-
2021-09-23$192,500 New
-
2021-07-23soldstatus
-
2017-12-01soldstatus
-
2017-11-30soldstatus Sold
-
2017-10-31status Pending
-
2017-10-26price $132,500
-
2017-10-02$135,000 New
-
1997-06-01soldstatus
ⓘ Source: listings_history table (triggers on properties + properties_extension) + one-shot
backfill from property_details.listing_events for pre-trigger history.
Tax reassessment forecast TX · Resets to sale price
- Current annual tax
- $4,178 · $348/mo
- Projected year-2 tax
- $4,178 · $348/mo
- Expected delta
- $0/yr ($0/mo · 0.0%)
ⓘ Screening estimate from a state-policy table — verify with the county assessor before closing.
Climate risk First Street
- Flood 1/10 Low FEMA zone X (unshaded) · 0% chance over 30 yrs
- Wildfire 4/10 Moderate
- Heat 8/10 Severe 7 d/yr ≥110°F today · 23 d/yr by 30 yrs out
- Wind 8/10 Severe 80% chance of damaging wind over 30 yrs
- Air quality 2/10 Low 0 unhealthy d/yr today · 2 by 30 yrs out
Nearby sold comps map
Loading sold comps map…
Walkable amenities ~0.75 mi
Loading nearby amenities…
Taxation est. · year 1
- Rental income
- $20,673
- − Mortgage interest
- −$11,203
- − Property taxes
- −$4,178
- − Insurance
- −$1,000
- − Repairs & maintenance
- −$1,654
- − Management
- −$1,654
- − Depreciation
- −$5,818
- Taxable loss
- −$4,834
- Est. tax savings @ 24.0%
- +$1,160
- After-tax cash flow
- $-272/yr
For passive investors: Depreciation is non-cash, so a rental often shows a tax loss while cash-flowing — sheltering income. Rental losses are passive: they offset passive income freely, and up to $25,000/yr can offset ordinary (W-2) income if you actively participate and your MAGI is under $100k (phasing out to $0 by $150k); unused losses carry forward. On sale, claimed depreciation is recaptured at up to 25%, and gains may owe capital-gains tax (a 1031 exchange can defer both). Figures are a year-1 estimate at your 24.0% rate — not tax advice; consult a CPA.
Schools (NCES district)
- District
- East Central ISD
- NCES district ID
- 4817850
- Math proficiency
- 16% ▼ -12.00%
- Reading proficiency
- 25% ▼ -6.00%
- Median HH income
- $53,941
- Composite
- 18.67/100
- National rank
- #8887
- State rank
- #758 of 826 in TX
Livability — San Antonio
- Score
- 80/100
- State rank
- #31
- US rank
- #1616
Category grades
Schools grade is shown separately in the Schools card above.
Census & demographics
- Census place
- San Antonio, TX
- County
- Bexar County · 1,990,555 people
- City population
- 1,806,925
- Metro
- San Antonio-New Braunfels, TX
- Population (ZIP)
- 26,476
- Household income
- $66,362
- Rent vs Own
- Severe rent burden
- 686.0
Population outlook (Bexar County) Hauer SSP2
- Today (2025)
- 2,336,851 people
- By 2030
- 2,560,728 · +9.6%
- By 2040
- 3,020,569 · +29.3%
- By 2050
- 3,493,522 · +49.5%
- By 2075
- 4,668,459 · +99.8%
- By 2100
- 5,533,242 · +136.8%
Race, ethnicity, and origin ACS 2023
- Neighborhood character
- Majority Hispanic (64%)
- Race & ethnicity
- Hispanic / Latino 64% Two or more races 26% White 19% Black 14% Asian 1%
- Hispanic origin (detail)
- Mexican 55%
- Common ancestry
- Romanian 1% Italian 1% Slovak 1%
- Foreign-born
- 14% · Canada
- Languages at home
- 61% English-only · Spanish 37% Arabic 1%
Political lean MEDSL · Bexar
- 2024 margin
- Lean D (+9.8) · D 54.3% · R 44.6% · Other 1.1%
- 2008→2024 swing
- +4.2pp toward D · 2008: 5.6pp · 2024: 9.8pp
- All cycles
- 2024: D+9.8 2020: D+18.2 2016: D+13.5 2012: D+4.6 2008: D+5.6
Not yet ingested
- Civics
- —
Market trends
- HPI YoY
- ▼ -14.18%
- Current HPI
- 278.8429
- Rent YoY
- ▲ 4.35%
- Metro
- San Antonio-New Braunfels, TX
- State GDP YoY
- ▲ 3.95%
- F500 in state
- 110
Industry mix (Fortune 500 HQ in TX)
| Industry | F500 HQs | Revenue |
|---|---|---|
| Energy | 16 | $1,198B |
|
||
| Technology | 5 | $198B |
|
||
| Engineering / Construction | 4 | $72B |
|
||
| Energy Services | 3 | $60B |
|
||
| Utilities | 3 | $41B |
|
||
| Healthcare | 2 | $330B |
|
||
Price history
+48.1% since first listed17 events — show timeline
- 2026-05-19 Price Changed $199,999 LERA
- 2026-03-03 Listed $209,999 LERA
- 2026-01-29 Listing Removed — LERA
- 2026-01-06 Price Changed $209,999 LERA
- 2025-11-20 Listed $214,999 LERA
- 2021-11-05 Sold (MLS) — LERA
- 2021-11-05 Sold (Public Records) — Public Records
- 2021-11-04 Pending — LERA
- 2021-10-05 Contingent — LERA
- 2021-09-23 Listed $192,500 LERA
- 2021-07-23 Sold (Public Records) — Public Records
- 2017-12-01 Sold (Public Records) — Public Records
- 2017-11-30 Sold (MLS) — LERA
- 2017-10-31 Pending — LERA
- 2017-10-26 Price Changed $132,500 LERA
- 2017-10-02 Listed $135,000 LERA
- 1997-06-01 Sold (Public Records) — Public Records
Property tax history
+5.2%/yrLatest (2025): $4,178 · +4.6% YoY. Source: county tax records.
Cash-flow waterfall
monthlySold comps — $/sqft
last 12 mo · ≤1 miLoading sold comps…