17883 Pleasantview Blvd · Connerton, FL
Flood risk No data
- FEMA flood zone
- —
- Chance of flooding over 30 yrs
- —
- Est. flood insurance / yr
- —
Fire risk No data
- Est. fire insurance / yr
- —
Heat risk No data
- Hot days now (above threshold)
- —
- Hot days in 30 yrs
- —
Wind risk No data
- Chance of severe wind over 30 yrs
- —
Air-quality risk No data
- Unhealthy air days now
- —
- Unhealthy air days in 30 yrs
- —
Risk factors via First Street. Map © Google.
Why this score? — see what drove the D+ grade
The composite is a weighted blend of 9 inputs, each scored 0–100. Each bar is that input's sub-score; the figure is the points it added to the 100-point composite (weight × sub-score).
- Cash flow +13.7/30.0
- ARV discount +10.3/15.0
- Schools +4.3/10.0
- DSCR +4.2/10.0
- Condition / age +4.0/5.0
- 1% rule +3.8/10.0
- Livability +3.3/5.0
- Rent growth +1.6/5.0
- Appreciation +0.0/10.0
$404,000
🖨 Deal sheet (PDF) 📄 Offer letter ✓ Due diligence
Listing remarks
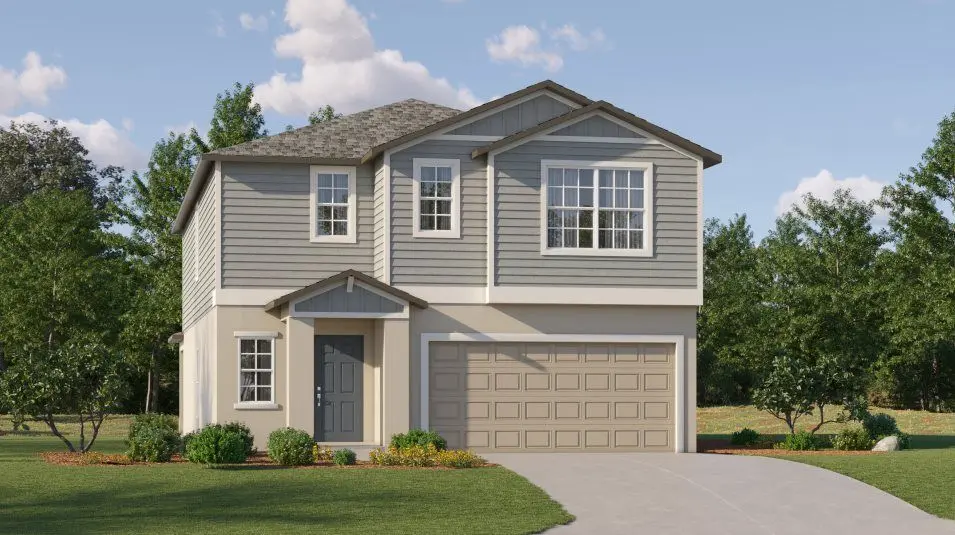
Boasting two stories, the Concord is the largest single-family home in this collection. The first floor features a modern design with an open kitchen, living room and dining room, along with a versatile bedroom ideal for overnight guests. The second floor is home to four bedrooms, an adaptable loft and the spacious owner's suite.
Key facts
- Adaptable loft
- Versatile bedroom
- Open kitchen
Tags
Property features AI
Finance
- Other: Address: 17883 Pleasantview Blvd, Land O Lakes, FL 34638; Listing status: Active; Last updated: May 20, 2026
- Financial info: List price $414,900
Exterior
- Parking: 2 garage spaces; 2 total parking spaces
- Home design: Concord floor plan; Single-family property (spec build)
- Exterior features: Living area of 2580
Interior
- Bedrooms: 6 bedrooms
- Bathrooms: 3 bathrooms
- Interior features: Spec (new construction)
Neighborhood map
What this means for you Summary
Snapshot
- This is a 6-bed/3.0-bath single-family listed at $404k. Condition is rated good.
Deal economics
- At list price, monthly cash flow is $32 ($383/yr) — positive.
- The deal already cash-flows at list — no discount required.
- To meet the 1% rule (rent ≥ 1% of price), the offer needs to be $357k (11.5% below list).
- Recommended offer: $357k (11.5% below list) — sets the bar for 1% rule.
- Cap rate 6.4% vs local median 4.2% in Connerton — top-decile yield for the area; either an underpriced asset or a hidden risk that comps aren't pricing in. Stress-test before assuming the spread holds.
Location & tenants
- Location reads 66/100 on livability (#596 in FL) — a middle-class / working-renter tenant base. Strengths: crime A+, employment A+, housing A+; Watch: amenities F, commute F, health & safety F.
- Pasco (suburban): math 50% / reading 52% proficiency, ranked #32 of 73 in FL (top 44%) — acceptable for families but not a draw, mixed tenant base, ~2y average lease.
- Zoned schools: Connerton Elementary School (math 48% / reading 57%, grade C-, #976 of 2,144 statewide, top 46%, 958 students, 39% FRL); Pine View Middle School (math 63% / reading 52%, grade B, #157 of 571 statewide, top 28%, 1,170 students, 32% FRL); Land O' Lakes High School (math 56% / reading 64%, grade C+, #106 of 667 statewide, top 16%, 2,248 students, 27% FRL) — zoned schools average 33% FRL vs 48% district-wide (16 pts lower); this property's tenant base skews higher-income than the district average.
- Market conditions: Rents falling (-3.8%/yr); 723 active listings in the ZIP; 5 comparable units currently listed for rent nearby; rentals at typical pace (median 20d on market — plan ~3-4 weeks tenant-placement turnaround); high-income renter base; 6,765 units permitted in Pasco County in 2024 (1,250 in 5+ unit buildings).
- This rent runs 35% of the median local income ($124k/yr) — at the standard rent-burdened threshold; future hikes will face affordability resistance.
Forward outlook
- Local home prices are declining (-3.0%/yr); year-one equity from $3k of loan paydown is wiped out by about $12k of value loss. Plan a longer hold.
- Pasco County population projected at +29% by 2050 — long-run rental-demand tailwind backs the buy-and-hold thesis.
Negotiation context
- It's been on market 102 days — a 9% lower offer ($368k) is reasonable based on typical stale-listing flexibility.
Questions for the listing agent
- It's been on market 102 days. Have you received any prior offers? Is the seller open to a 12% concession, seller financing, or rate buy-down credit?
- Why hasn't it sold? Are there any deal-killer items the seller is aware of (foundation, flood, title, zoning, code violations)?
- Is there a deadline driving the sale (1031 exchange, divorce, estate, relocation)? That informs how much negotiation room exists.
- Schools are D-rated, which usually means shorter tenancies and higher turnover. Who's the typical renter profile here, and what's been the actual vacancy rate?
- The area grade is low — what's the realistic commute time and amenity access for the typical tenant pool here? Any planned neighborhood developments (good or bad) we should know about?
- What's the average days-on-market for RENTAL listings here right now (not sales)? A rising rental-DOM trend means longer vacancies and softer asking-rent achievability than the comps imply.
- What's the recent tenant-quality profile in this submarket — average credit score on applications, eviction rate, late-payment / NSF rate, and stable-employment percentage? A property-management company in the area should have these aggregated.
- How much new for-sale + rental construction is in the pipeline within 1–3 miles? Heavy new supply typically softens prices + rents 12–24 months out; constrained supply supports both.
Investment metrics
- 1% rule
- 0.88% ✗
- Cap rate
- 6.39%
- Cash-on-cash
- 0.34%
- DSCR
- 1.02
- GRM
- 9.4
CMA / ARV
- ARV (on-the-fly)
- $430,860
- Comps found
- 12
Show comp detail 12 sales within ~0.75 mi
| Address | Dist | Beds/Ba | Sqft | Sold | Price | $/sf | Match |
|---|---|---|---|---|---|---|---|
| 17577 Acorn Drop Rd | 0.30mi | 5/3.0 (-1) | 2,605 (+1%) | 1mo | $433,990 | $167 | 79 |
| 17607 Acorn Drop Rd | 0.28mi | 5/3.0 (-1) | 2,605 (+1%) | 3mo | $429,990 | $165 | 78 |
| 17645 Acorn Drop Rd | 0.26mi | 5/3.0 (-1) | 2,605 (+1%) | 6mo | $430,990 | $165 | 77 |
| 17685 Acorn Drop Rd | 0.24mi | 5/3.0 (-1) | 2,605 (+1%) | 7mo | $439,990 | $169 | 76 |
| 17766 Acorn Drop Rd | 0.20mi | 5/3.0 (-1) | 2,453 (-5%) | 3mo | $439,990 | $179 | 75 |
| 17835 Acorn Drop Rd | 0.25mi | 5/3.0 (-1) | 2,453 (-5%) | 1mo | $409,990 | $167 | 74 |
| 17538 Happytrails St | 0.47mi | 6/3.0 | 2,580 (0%) | 9mo | $417,810 | $162 | 70 |
| 10559 Gentle Rain Dr | 0.68mi | 5/3.0 (-1) | 2,453 (-5%) | 5mo | $391,990 | $160 | 51 |
| 17512 Happytrails St | 0.49mi | 5/2.5 (-1) | 2,389 (-7%) | 9mo | $415,000 | $174 | 50 |
| 10583 Gentle Rain Dr | 0.70mi | 5/3.0 (-1) | 2,453 (-5%) | 5mo | $394,990 | $161 | 50 |
| 10615 Gentle Rain Dr | 0.73mi | 5/3.0 (-1) | 2,453 (-5%) | 4mo | $396,990 | $162 | 49 |
| 17548 Pleasantview Blvd | 0.30mi | 5/2.5 (-1) | 2,215 (-14%) | 8mo | $410,450 | $185 | 49 |
Match score weights: distance 35% · size 25% · config 20% · recency 20%. Top-matched comps best support the ARV.
Projected returns pro-forma
-3.0% appreciation · 0.0% rent growth · sell at horizon
- IRR
- -19.2%
- Equity multiple
- 0.35×
- Total profit
- $-73,854
- Equity at exit
- $60,238
- IRR
- -19.6%
- Equity multiple
- 0.10×
- Total profit
- $-101,958
- Equity at exit
- $34,931
Cash invested: $113,120 (down + closing). Projections, not guarantees.
Landlord ↔ Tenant lean methodology
- Overall (STATE)
- 87 Strongly Landlord-Friendly
- State Florida
- 87 Strongly Landlord-Friendly · R+3
- County
- — inherits STATE
- City
- — inherits STATE
ZIP-level market 34638
- Home prices YoY
- -16.0%
- Rents YoY
- -3.8%
- Active inventory
- 723
- Price-to-rent
- 9.4×
Monthly cashflow live
- Estimated rent
- $3,575 high interval (Pro) →
- Mortgage (P&I)
- −$2,119
- Tax est. 1.5%
- −$505 /mo · $6,060/yr
- Insurance
- −$168
- HOA
- −$0
- Vacancy / Maint / Mgmt
- −$751
- Net cashflow
- $32
Break-even live
Sensitivity live
| Price | -10% $311 | -5% $172 | +0% $32 | +5% $-108 | +10% $-247 |
|---|---|---|---|---|---|
| Rent | -10% $-250 | -5% $-109 | +0% $32 | +5% $173 | +10% $314 |
| Rate | -1.0pp $235 | -0.5pp $135 | base $32 | +0.5pp $-73 | +1.0pp $-179 |
UW: 25.0% down · 7.5% · 30yr · 1.5% tax · 5.0% vac · 8.0% maint · 8.0% mgmt
Financing live
Cash to close
- Down payment
- $101,000
- Closing costs
- $12,120
- Reserves months
- —
- Total cash needed
- —
Loan-product check · same deal, 3 products live
Conventional
25% down · 7.5% · 30yr
- Down + closing
- —
- Monthly P&I
- —
- Monthly cashflow
- —
- DSCR
- —
- Eligible?
- —
Personal DTI + credit; lowest rate.
DSCR
20% down · 8.5% · 30yr
- Down + closing
- —
- Monthly P&I
- —
- Monthly cashflow
- —
- DSCR
- —
- Eligible?
- —
No personal income docs; deal must DSCR.
Hard money
10% down · 12.0% · 12mo
- Down + closing
- —
- Monthly P&I
- —
- Monthly cashflow
- —
- DSCR
- —
- Eligible?
- —
Short-term bridge; refi at stabilization.
Rent comps 5 comps
| Address | Beds | Baths | Sqft | Rent | $/sqft | DOM | Units | Dist |
|---|---|---|---|---|---|---|---|---|
| 10225 Gliding Eagle Way Land O Lakes, FL | 5.0 | 4.0 | 3021 | $3,700 | $1.22 | 19d | 1 | 0.55mi |
| 10497 Farm Hill Ave Land O Lakes, FL | 5.0 | 3.5 | 3561 | $3,500 | $0.98 | 0d | 1 | 0.62mi |
| 10583 Gentle Rain Dr Land O Lakes, FL | 5.0 | 3.0 | 2453 | $3,450 | $1.41 | 26d | 1 | 0.70mi |
| 10583 Gentle Rain Dr Land O Lakes, FL | 5.0 | 3.0 | 2453 | $3,450 | $1.41 | 4d | 1 | 0.70mi |
| 9654 Jasmine Brook Cir Land O Lakes, FL | 6.0 | 3.0 | 3433 | $3,350 | $0.98 | 19d | 1 | 1.00mi |
Listing history 16 events
-
2026-06-18days on market $404,000 Active 102 DOM
-
2026-06-17pricedays on market $404,000 Active 101 DOM
-
2026-06-16days on market $403,900 Active 100 DOM
-
2026-06-15price $403,900 Active 99 DOM
-
2026-06-15pricedays on market $402,900 Active 99 DOM
-
2026-06-13pricedays on market $402,800 Active 97 DOM
-
2026-06-09days on market $402,600 Active 93 DOM
-
2026-06-08days on market $402,600 Active 92 DOM
-
2026-06-08price $402,600 Active 91 DOM
-
2026-06-07pricedays on market $402,500 Active 91 DOM
-
2026-06-04days on market $402,400 Active 88 DOM
-
2026-06-03days on market $402,400 Active 87 DOM
-
2026-06-02pricedays on market $402,400 Active 86 DOM
-
2026-06-01days on market $408,200 Active 85 DOM
-
2026-06-01price $408,200 Active 84 DOM
-
2026-05-31pricedays on market $408,100 Active 84 DOM
ⓘ Source: listings_history table (triggers on properties + properties_extension) + one-shot
backfill from property_details.listing_events for pre-trigger history.
Nearby sold comps map
Loading sold comps map…
Walkable amenities ~0.75 mi
Loading nearby amenities…
Taxation est. · year 1
- Rental income
- $42,894
- − Mortgage interest
- −$22,630
- − Property taxes
- −$6,060
- − Insurance
- −$2,020
- − Repairs & maintenance
- −$3,432
- − Management
- −$3,432
- − Depreciation
- −$11,753
- Taxable loss
- −$6,432
- Est. tax savings @ 24.0%
- +$1,544
- After-tax cash flow
- $1,927/yr
For passive investors: Depreciation is non-cash, so a rental often shows a tax loss while cash-flowing — sheltering income. Rental losses are passive: they offset passive income freely, and up to $25,000/yr can offset ordinary (W-2) income if you actively participate and your MAGI is under $100k (phasing out to $0 by $150k); unused losses carry forward. On sale, claimed depreciation is recaptured at up to 25%, and gains may owe capital-gains tax (a 1031 exchange can defer both). Figures are a year-1 estimate at your 24.0% rate — not tax advice; consult a CPA.
Condition & rehab AI · 13 photos
This two-story home features a modern design with good condition and minimal repairs needed. It offers a good investment opportunity with potential for value enhancement through cosmetic updates.
Value-add opportunities
- Both Painting exterior siding — Enhances curb appeal and value.
- Both Landscaping improvements — Enhances curb appeal and value.
- Both Flooring replacement — Modernizes and improves aesthetics.
- Both Kitchen appliances — Modernizes and improves functionality.
- Both Bathroom fixtures — Modernizes and improves functionality.
Renovation cost estimate screening
Value-add ROI direction
- Both Painting exterior siding — Enhances curb appeal and value. ↑
- Both Landscaping improvements — Enhances curb appeal and value. ↑
- Both Flooring replacement — Modernizes and improves aesthetics. ↑
- Both Kitchen appliances — Modernizes and improves functionality. ↑
- Both Bathroom fixtures — Modernizes and improves functionality. ↑
ⓘ Cost ranges are severity-bucket heuristics (US national rule-of-thumb). Get contractor quotes + a written scope before underwriting a rehab budget.
Schools (NCES district)
- District
- Pasco
- NCES district ID
- 1201530
- Math proficiency
- 50% ▼ -10.00%
- Reading proficiency
- 52% ▼ -5.00%
- Median HH income
- $45,039
- Composite
- 43.14/100
- National rank
- #3074
- State rank
- #32 of 73 in FL
Livability — Connerton
- Score
- 66/100
- State rank
- #596
- US rank
- #11437
Category grades
Schools grade is shown separately in the Schools card above.
Census & demographics
- County
- Pasco County · 524,098 people
- City population
- 11,398
- Metro
- Tampa-St. Petersburg-Clearwater, FL
- Population (ZIP)
- 37,644
- Household income
- $123,899
- Rent vs Own
- Severe rent burden
- 354.0
Population outlook (Pasco County) Hauer SSP2
- Today (2025)
- 570,045 people
- By 2030
- 605,844 · +6.3%
- By 2040
- 674,806 · +18.4%
- By 2050
- 736,022 · +29.1%
- By 2075
- 862,900 · +51.4%
- By 2100
- 906,364 · +59.0%
Race, ethnicity, and origin ACS 2023
- Neighborhood character
- Diverse neighborhood (Simpson 0.59)
- Race & ethnicity
- White 58% Hispanic / Latino 25% Two or more races 16% Black 6% Asian 4%
- Hispanic origin (detail)
- Mexican 1% Puerto Rican 6% Cuban 4% Dominican 3%
- Common ancestry
- Lithuanian 3% Romanian 3% Slovak 2%
- Foreign-born
- 17% · Canada, Jamaica
- Languages at home
- 76% English-only · Spanish 16% Other Indo-European 2% Arabic 2%
Political lean MEDSL · Pasco
- 2024 margin
- Strong R (+25.2) · D 36.9% · R 62.1% · Other 1.0%
- 2008→2024 swing
- -21.6pp toward R · 2008: -3.6pp · 2024: -25.2pp
- All cycles
- 2024: R+25.2 2020: R+20.1 2016: R+21.6 2012: R+6.7 2008: R+3.6
Not yet ingested
- Civics
- —
Market trends
- HPI YoY
- ▼ -57.02%
- Current HPI
- 299.2018
- Rent YoY
- ▼ -3.78%
- Metro
- Tampa-St. Petersburg-Clearwater, FL
- State GDP YoY
- ▲ 3.28%
- F500 in state
- 36
Industry mix (Fortune 500 HQ in FL)
| Industry | F500 HQs | Revenue |
|---|---|---|
| Industrial Technology | 2 | $29B |
|
||
| Insurance | 2 | $17B |
|
||
| Retail | 1 | $60B |
|
||
| Technology Distribution | 1 | $58B |
|
||
| Homebuilding | 1 | $35B |
|
||
| Technology Manufacturing | 1 | $35B |
|
||
Cash-flow waterfall
monthlySold comps — $/sqft
last 12 mo · ≤1 miLoading sold comps…