 Multi-family
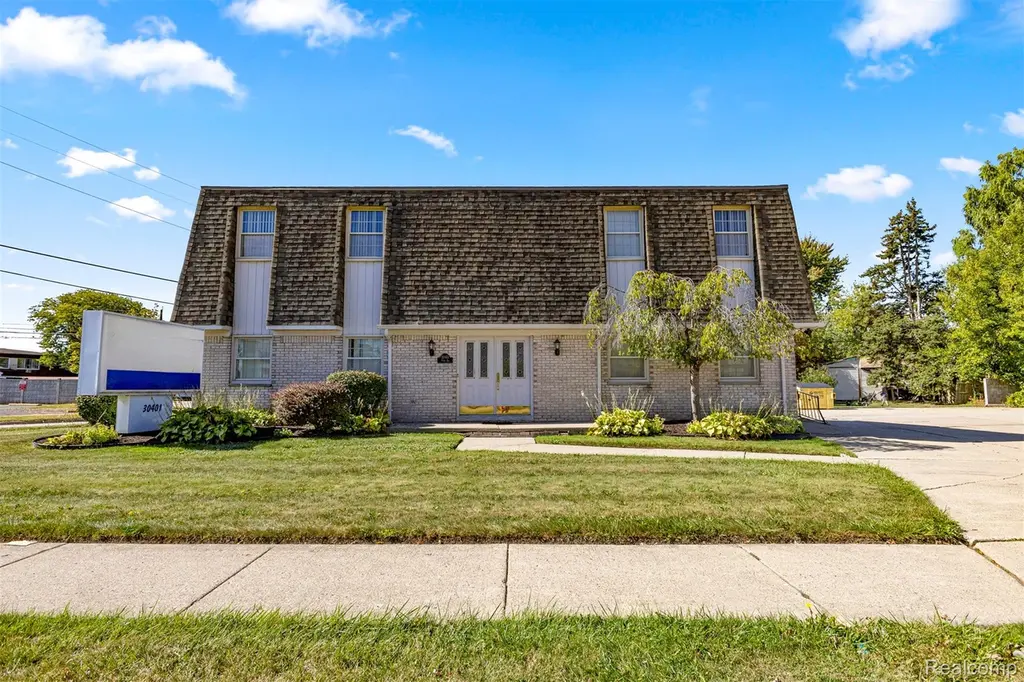
30401 Utica Rd · Roseville, MI
Flood risk No data
- FEMA flood zone
- —
- Chance of flooding over 30 yrs
- —
- Est. flood insurance / yr
- —
Fire risk No data
- Est. fire insurance / yr
- —
Heat risk No data
- Hot days now (above threshold)
- —
- Hot days in 30 yrs
- —
Wind risk No data
- Chance of severe wind over 30 yrs
- —
Air-quality risk No data
- Unhealthy air days now
- —
- Unhealthy air days in 30 yrs
- —
Risk factors via First Street. Map © Google.
Why this score? — see what drove the C- grade
The composite is a weighted blend of 9 inputs, each scored 0–100. Each bar is that input's sub-score; the figure is the points it added to the 100-point composite (weight × sub-score).
- Cash flow +25.9/30.0
- DSCR +8.7/10.0
- 1% rule +6.8/10.0
- Livability +3.6/5.0
- Condition / age +2.8/5.0
- Rent growth +2.6/5.0
- Schools +1.5/10.0
- ARV discount +0.0/15.0
- Appreciation +0.0/10.0
$350,000
🖨 Deal sheet 📄 Offer letter ✓ Due diligence
Multi-family units
County records classify this as Multi-Family (2-4 Unit). Listing-text estimate: 1 unit. estimate disagrees with records
Listing remarks MLS
Versatile Property with Strong Redevelopment Potential! Previously used as a residential/multi-family property before its conversion to office space, this 3,100 sq ft building sits on a spacious 0.40-acre lot and offers excellent potential to be transformed back into a multi-family residence. Ideal for investors or developers looking to capitalize on a flexible layout and generous land size. Boasting excellent visibility, heavy traffic flow, and ample parking. Features a tiled entrance, five offices and a conference room upstairs, plus three additional offices downstairs. Recently upgraded with all-new HVAC. All measurements are approximate agent to verify.
Key facts
- Ample parking
- Flexible layout
- Spacious lot
Tags
Neighborhood map
What this means for you Summary
Snapshot
- This is a 2-bed/2.0-bath multifamily listed at $350k. Condition is rated average.
Deal economics
- At list price, monthly cash flow is $857 ($10k/yr) — positive.
- The deal already cash-flows at list — no discount required.
- Meets the 1% rule at list price ($4k rent vs $350k).
- Recommended offer: $329k (6.0% below list) — sets the bar for market timing.
- Cap rate 9.2% vs local median 6.0% in Roseville — top-decile yield for the area; either an underpriced asset or a hidden risk that comps aren't pricing in. Stress-test before assuming the spread holds.
Location & tenants
- Location reads 72/100 on livability (#258 in MI) — a middle-class / working-renter tenant base. Strengths: commute A+, cost of living A+, housing A+; Watch: health & safety D+, employment D, schools F.
- Roseville Community Schools (suburban): math 11% / reading 24% proficiency, ranked #483 of 540 in MI (top 89%) — low school quality limits family demand, transient renter base, plan for 1-2y turnover; 60% free/reduced lunch — lower-income household profile, screen leases tightly.
- Market conditions: Rents flat; 265 active listings in the ZIP; 1 comparable units currently listed for rent nearby; 1,321 units permitted in Macomb County in 2024 (86 in 5+ unit buildings).
- At $4,146/mo this rent would consume 80% of the median local household income ($62k/yr) (locally 1712% of renters already pay >50% of income on rent) — very limited rent-growth headroom before tenants either downsize or default.
Forward outlook
- Local home prices are declining (-3.0%/yr); year-one equity from $2k of loan paydown is wiped out by about $10k of value loss. Plan a longer hold.
- Macomb County population projected at +9% by 2050 — modest demand growth; plan on rents tracking national, not racing it.
Negotiation context
- It's been on market 87 days — a 6% lower offer ($329k) is reasonable based on typical stale-listing flexibility.
- 9 sale attempts with the ask held roughly flat each time — persistent listings suggest the price (not the market) is what's stuck; bring a comps-based counter.
Questions for the listing agent
- It's been on market 87 days. Have you received any prior offers? Is the seller open to a 6% concession, seller financing, or rate buy-down credit?
- Built in 1978 — when were the roof, HVAC, electrical panel, plumbing, and water heater last replaced?
- Why hasn't it sold? Are there any deal-killer items the seller is aware of (foundation, flood, title, zoning, code violations)?
- Is there a deadline driving the sale (1031 exchange, divorce, estate, relocation)? That informs how much negotiation room exists.
- Schools are F-rated, which usually means shorter tenancies and higher turnover. Who's the typical renter profile here, and what's been the actual vacancy rate?
- Crime grade is F in this area — have there been break-ins, vandalism, or insurance claims at this property in the last 3 years? What carrier currently insures it and at what premium?
- What's the average days-on-market for RENTAL listings here right now (not sales)? A rising rental-DOM trend means longer vacancies and softer asking-rent achievability than the comps imply.
- What's the recent tenant-quality profile in this submarket — average credit score on applications, eviction rate, late-payment / NSF rate, and stable-employment percentage? A property-management company in the area should have these aggregated.
- How much new apartment / multifamily construction is in the pipeline within 1–3 miles? Heavy new supply (>2% of stock underway) typically softens rents 12–24 months out; light construction supports rent growth.
Investment metrics
- 1% rule
- 1.18% ✓
- Cap rate
- 9.23%
- Cash-on-cash
- 10.49%
- DSCR
- 1.47
- GRM
- 7.0
CMA / ARV
- ARV (median comp)
- $243,714
- List price
- $350,000
- Delta
- 43.61%
- Verdict
- OVERPRICED
- Comps
- 10 within 2.0 mi
Projected returns pro-forma
-3.0% appreciation · 0.39% rent growth · sell at horizon
- IRR
- -3.6%
- Equity multiple
- 0.87×
- Total profit
- $-12,709
- Equity at exit
- $52,186
- IRR
- 2.9%
- Equity multiple
- 1.18×
- Total profit
- $18,110
- Equity at exit
- $30,262
Cash invested: $98,000 (down + closing). Projections, not guarantees.
Landlord ↔ Tenant lean methodology
- Overall (STATE)
- 62 Landlord-Friendly
- State Michigan
- 62 Landlord-Friendly · EVEN
- County
- — inherits STATE
- City
- — inherits STATE
ZIP-level market 48066
- Rents YoY
- 0.4%
- Active inventory
- 265
- Price-to-rent
- 21.1×
Monthly cashflow live
- Estimated rent
- $4,146 high interval (Pro) →
- Mortgage (P&I)
- −$1,835
- Tax est. 1.5%
- −$438 /mo · $5,250/yr
- Insurance
- −$146
- HOA
- −$0
- Vacancy / Maint / Mgmt
- −$871
- Net cashflow
- $857
Break-even live
3-unit breakdown (identical units grouped — click to expand)
| Units | Beds | Baths | Est. rent |
|---|---|---|---|
| 3× units | 2 | 2 | $4,146 |
| #1 | 2 | 2 | $1,382 |
| #2 | 2 | 2 | $1,382 |
| #3 | 2 | 2 | $1,382 |
| Total (3 units) | $4,146 | ||
UW: 25.0% down · 7.5% · 30yr · 1.5% tax · 5.0% vac · 8.0% maint · 8.0% mgmt
Financing live
Cash to close
- Down payment
- $87,500
- Closing costs
- $10,500
- Reserves months
- —
- Total cash needed
- —
Loan-product check · same deal, 3 products live
Conventional
25% down · 7.5% · 30yr
- Down + closing
- —
- Monthly P&I
- —
- Monthly cashflow
- —
- DSCR
- —
- Eligible?
- —
Personal DTI + credit; lowest rate.
DSCR
20% down · 8.5% · 30yr
- Down + closing
- —
- Monthly P&I
- —
- Monthly cashflow
- —
- DSCR
- —
- Eligible?
- —
No personal income docs; deal must DSCR.
Hard money
10% down · 12.0% · 12mo
- Down + closing
- —
- Monthly P&I
- —
- Monthly cashflow
- —
- DSCR
- —
- Eligible?
- —
Short-term bridge; refi at stabilization.
Rent comps 1 comps
| Address | Beds | Baths | Sqft | Rent | $/sqft | DOM | Units | Dist |
|---|---|---|---|---|---|---|---|---|
| 29669 Utica Rd Roseville, MI | 3.0 | 1.0 | 2320 | $2,000 | $0.86 | 14d | 1 | 0.39mi |
Listing history 31 events
-
2026-06-18days on market $350,000 Active 87 DOM
-
2026-06-17days on market $350,000 Active 86 DOM
-
2026-06-16days on market $350,000 Active 85 DOM
-
2026-06-15days on market $350,000 Active 84 DOM
-
2026-06-13days on market $350,000 Active 82 DOM
-
2026-06-09days on market $350,000 Active 78 DOM
-
2026-06-08days on market $350,000 Active 77 DOM
-
2026-06-07days on market $350,000 Active 76 DOM
-
2026-06-04days on market $350,000 Active 73 DOM
-
2026-06-03days on market $350,000 Active 72 DOM
-
2026-06-02days on market $350,000 Active 71 DOM
-
2026-06-01days on market $350,000 Active 70 DOM
-
2026-05-31days on market $350,000 Active 69 DOM
-
2026-03-23$350,000 Active 665-char remark
Show marketing remark (665 chars)
Versatile Property with Strong Redevelopment Potential! Previously used as a residential/multi-family property before its conversion to office space, this 3,100 sq ft building sits on a spacious 0.40-acre lot and offers excellent potential to be transformed back into a multi-family residence. Ideal for investors or developers looking to capitalize on a flexible layout and generous land size. Boasting excellent visibility, heavy traffic flow, and ample parking. Features a tiled entrance, five offices and a conference room upstairs, plus three additional offices downstairs. Recently upgraded with all-new HVAC. All measurements are approximate agent to verify.
-
2026-01-16historical
-
2026-01-16status Active
-
2026-01-15price $350,000
-
2025-12-17historical
-
2025-12-17status Active
-
2025-11-07historical
-
2025-11-07status Active
-
2025-11-06historical
-
2025-11-06status Active
-
2025-11-05price $399,000
-
2025-10-11historical
-
2025-10-11status Active
-
2025-10-08historical
-
2025-10-08status Active
-
2025-10-07historical
-
2025-10-06$425,000 Active
ⓘ Source: listings_history table (triggers on properties + properties_extension) + one-shot
backfill from property_details.listing_events for pre-trigger history.
Nearby sold comps map
Loading sold comps map…
Walkable amenities ~0.75 mi
Loading nearby amenities…
Taxation est. · year 1
- Rental income
- $49,752
- − Mortgage interest
- −$19,605
- − Property taxes
- −$5,250
- − Insurance
- −$1,750
- − Repairs & maintenance
- −$3,980
- − Management
- −$3,980
- − Depreciation
- −$10,182
- Taxable income
- $5,004
- Est. tax owed @ 24.0%
- −$1,201
- After-tax cash flow
- $9,078/yr
For passive investors: Depreciation is non-cash, so a rental often shows a tax loss while cash-flowing — sheltering income. Rental losses are passive: they offset passive income freely, and up to $25,000/yr can offset ordinary (W-2) income if you actively participate and your MAGI is under $100k (phasing out to $0 by $150k); unused losses carry forward. On sale, claimed depreciation is recaptured at up to 25%, and gains may owe capital-gains tax (a 1031 exchange can defer both). Figures are a year-1 estimate at your 24.0% rate — not tax advice; consult a CPA.
Condition & rehab AI · 6 photos
A moderate rehab project is needed to address weathered siding and roof, with potential for significant value increase through painting, landscaping, and roof repairs.
Repairs flagged
- Moderate Shingle siding — Weathered and discolored
- Moderate Roof inspection — Appearance suggests potential wear
Value-add opportunities
- Both Painting and staining — Enhances curb appeal and property value
- Both Landscaping improvements — Enhances curb appeal and property value
- Both Roof inspection and potential repairs — Ensures structural integrity and prevents future issues
Renovation cost estimate screening
| Repair item | Severity | Est. cost |
|---|---|---|
| Shingle siding · Weathered and discolored | Moderate | $3,000–15,000 |
| Roof inspection · Appearance suggests potential wear | Moderate | $3,000–15,000 |
| Total estimated repair cost · 2 items | $6,000–30,000 |
Value-add ROI direction
- Both Painting and staining — Enhances curb appeal and property value ↑
- Both Landscaping improvements — Enhances curb appeal and property value ↑
- Both Roof inspection and potential repairs — Ensures structural integrity and prevents future issues ↑
ⓘ Cost ranges are severity-bucket heuristics (US national rule-of-thumb). Get contractor quotes + a written scope before underwriting a rehab budget.
Schools (NCES district)
- District
- Roseville Community Schools
- NCES district ID
- 2630210
- Math proficiency
- 11% ▼ -8.00%
- Reading proficiency
- 24% ▼ -7.00%
- Median HH income
- $41,590
- Composite
- 14.98/100
- National rank
- #9363
- State rank
- #483 of 540 in MI
Livability — Roseville
- Score
- 72/100
- State rank
- #258
- US rank
- #6400
Category grades
Schools grade is shown separately in the Schools card above.
Census & demographics
- Census place
- Roseville, MI
- County
- Macomb County · 638,552 people
- City population
- 47,123
- Metro
- Detroit-Warren-Dearborn, MI
- Population (ZIP)
- 47,123
- Household income
- $62,182
- Rent vs Own
- Severe rent burden
- 1712.0
Population outlook (Macomb County) Hauer SSP2
- Today (2025)
- 925,296 people
- By 2030
- 948,226 · +2.5%
- By 2040
- 983,961 · +6.3%
- By 2050
- 1,010,200 · +9.2%
- By 2075
- 1,076,222 · +16.3%
- By 2100
- 1,077,065 · +16.4%
Race, ethnicity, and origin ACS 2023
- Neighborhood character
- Predominantly White (65%)
- Race & ethnicity
- White 65% Black 23% Two or more races 7% Hispanic / Latino 4% Asian 2%
- Common ancestry
- Romanian 12% Lithuanian 4% Slovak 2%
- Foreign-born
- 5% · Canada
- Languages at home
- 93% English-only · Spanish 2% Russian/Polish/Slavic 1% Other Indo-European 1%
Political lean MEDSL · Macomb
- 2024 margin
- R (+13.7) · D 42.2% · R 55.9% · Other 1.9%
- 2008→2024 swing
- -22.3pp toward R · 2008: 8.6pp · 2024: -13.7pp
- All cycles
- 2024: R+13.7 2020: R+8.1 2016: R+11.6 2012: D+4.0 2008: D+8.6
Not yet ingested
- Civics
- —
Market trends
- HPI YoY
- ▼ -232.95%
- Current HPI
- 217.4171
- Rent YoY
- ▲ 0.39%
- Metro
- Detroit-Warren-Dearborn, MI
- State GDP YoY
- ▲ 1.37%
- F500 in state
- 28
Industry mix (Fortune 500 HQ in MI)
| Industry | F500 HQs | Revenue |
|---|---|---|
| Automotive Parts | 3 | $48B |
|
||
| Automotive | 2 | $372B |
|
||
| Chemicals | 1 | $45B |
|
||
| Automotive Retail | 1 | $29B |
|
||
| Healthcare / Medical Devices | 1 | $23B |
|
||
| Automotive Technology | 1 | $20B |
|
||
Price history
-17.6% since first listed18 events — show timeline
- 2026-03-23 Listed $350,000 REALCOMP
- 2026-03-23 Listed $350,000 MiRealSource-MiMLS
- 2026-01-16 Listing Removed — MiRealSource-MiMLS
- 2026-01-16 Relisted — MiRealSource-MiMLS
- 2026-01-15 Price Changed $350,000 MiRealSource-MiMLS
- 2025-12-17 Listing Removed — MiRealSource-MiMLS
- 2025-12-17 Relisted — MiRealSource-MiMLS
- 2025-11-07 Listing Removed — MiRealSource-MiMLS
- 2025-11-07 Relisted — MiRealSource-MiMLS
- 2025-11-06 Listing Removed — MiRealSource-MiMLS
- 2025-11-06 Relisted — MiRealSource-MiMLS
- 2025-11-05 Price Changed $399,000 MiRealSource-MiMLS
- 2025-10-11 Listing Removed — MiRealSource-MiMLS
- 2025-10-11 Relisted — MiRealSource-MiMLS
- 2025-10-08 Listing Removed — MiRealSource-MiMLS
- 2025-10-08 Relisted — MiRealSource-MiMLS
- 2025-10-07 Listing Removed — MiRealSource-MiMLS
- 2025-10-06 Listed $425,000 MiRealSource-MiMLS
Cash-flow waterfall
monthlySold comps — $/sqft
last 12 mo · ≤1 miLoading sold comps…