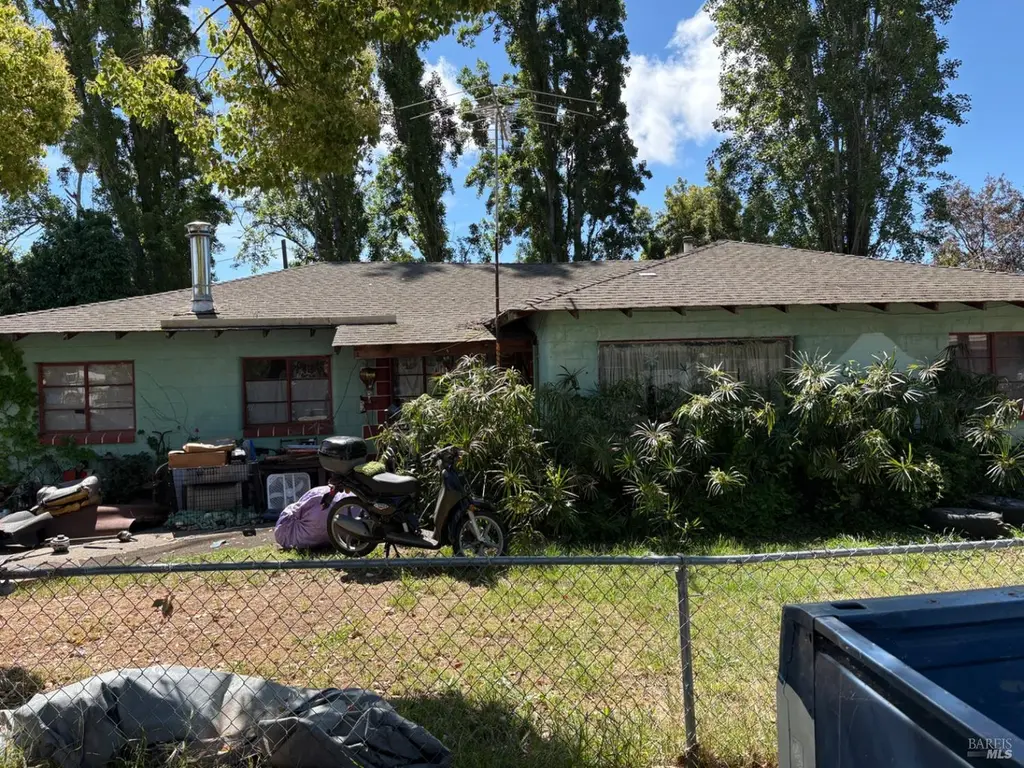
227 Donaldson Way · American Canyon, CA
Flood risk 1/10 · Minimal
- FEMA flood zone
- X (unshaded)
- Chance of flooding over 30 yrs
- 0.0%
- Est. flood insurance / yr
- $507 – $1,088
Fire risk 5/10 · Moderate
- Est. fire insurance / yr
- $659 – $1,223
Heat risk 4/10 · Minor
- Hot days now (above 94°F)
- 7 days/yr
- Hot days in 30 yrs
- 14 days/yr
Wind risk 1/10 · Minimal
- Chance of severe wind over 30 yrs
- —
Air-quality risk 8/10 · Major
- Unhealthy air days now
- 13 days/yr
- Unhealthy air days in 30 yrs
- 13 days/yr
Risk factors via First Street. Map © Google.
Why this score? — see what drove the C- grade
The composite is a weighted blend of 9 inputs, each scored 0–100. Each bar is that input's sub-score; the figure is the points it added to the 100-point composite (weight × sub-score).
- ARV discount +15.0/15.0
- Cash flow +14.2/30.0
- DSCR +4.3/10.0
- Schools +4.0/10.0
- 1% rule +3.9/10.0
- Livability +3.7/5.0
- Rent growth +2.5/5.0
- Condition / age +2.5/5.0
- Appreciation +0.0/10.0
$390,000
🖨 Deal sheet 📄 Offer letter ✓ Due diligence
Listing remarks MLS
Affordable**Bring your tool belt and imagination to this single level home in American Canyon in a mature neighborhood. 3 bedroom 1 bath concrete block house is durable and has a good size lot.
Key facts
- 7,275 sq ft lot
- Garage
- Built 1952
Neighborhood map
What this means for you Summary
Snapshot
- This is a 3-bed/1.0-bath single-family listed at $390k.
Deal economics
- At list price, monthly cash flow is $65 ($778/yr) — positive.
- The deal already cash-flows at list — no discount required.
- To meet the 1% rule (rent ≥ 1% of price), the offer needs to be $348k (10.8% below list).
- Recommended offer: $348k (10.8% below list) — sets the bar for 1% rule.
- Cap rate 6.5% vs local median 3.2% in American Canyon — top-decile yield for the area; either an underpriced asset or a hidden risk that comps aren't pricing in. Stress-test before assuming the spread holds.
Location & tenants
- Location reads 74/100 on livability (#133 in CA, #4,684 nationally) — a middle-class / working-renter tenant base. Strengths: employment A+, housing A+, health & safety A+; Watch: schools C-, amenities F, cost of living F.
- Napa Valley Unified (urban): math 35% / reading 48% proficiency, ranked #599 of 1,400 in CA (top 43%) — families likely to look elsewhere, expect single-tenant / working-renter base with shorter leases.
- Market conditions: 65 active listings in the ZIP; 8 comparable units currently listed for rent nearby; rentals leasing fast (median 14d on market — plan ~1-2 weeks tenant-placement turnaround); high-income renter base; 427 units permitted in Napa County in 2024 (189 in 5+ unit buildings).
- This rent runs 34% of the median local income ($121k/yr) — at the standard rent-burdened threshold; future hikes will face affordability resistance.
Forward outlook
- Local home prices are declining (-3.0%/yr); year-one equity from $3k of loan paydown is wiped out by about $12k of value loss. Plan a longer hold.
- Napa County population projected at +14% by 2050 — modest demand growth; plan on rents tracking national, not racing it.
Negotiation context
- It's been on market 25 days — a 2% lower offer ($384k) is reasonable based on typical stale-listing flexibility.
Risks & watch-outs
- Watch-outs: built in 1952 — expect roof / HVAC / electrical / plumbing capex.
- Climate carrying-cost: moderate wildfire risk — expect insurance premiums to compound above CPI over the hold.
Questions for the listing agent
- Built in 1952 — when were the roof, HVAC, electrical panel, plumbing, and water heater last replaced?
- Is there a deadline driving the sale (1031 exchange, divorce, estate, relocation)? That informs how much negotiation room exists.
- What's the average days-on-market for RENTAL listings here right now (not sales)? A rising rental-DOM trend means longer vacancies and softer asking-rent achievability than the comps imply.
- What's the recent tenant-quality profile in this submarket — average credit score on applications, eviction rate, late-payment / NSF rate, and stable-employment percentage? A property-management company in the area should have these aggregated.
- How much new for-sale + rental construction is in the pipeline within 1–3 miles? Heavy new supply typically softens prices + rents 12–24 months out; constrained supply supports both.
Investment metrics
- 1% rule
- 0.89% ✗
- Cap rate
- 6.49%
- Cash-on-cash
- 0.71%
- DSCR
- 1.03
- GRM
- 9.3
CMA / ARV
- ARV (median comp)
- $651,982
- List price
- $390,000
- Delta
- -40.18%
- Verdict
- UNDERPRICED
- Comps
- 20 within 1.0 mi
Show comp detail 12 sales within ~0.75 mi
| Address | Dist | Beds/Ba | Sqft | Sold | Price | $/sf | Match |
|---|---|---|---|---|---|---|---|
| 105 Donaldson Way | 0.12mi | 3/2.0 | 1,448 (-5%) | 4mo | $495,000 | $342 | 79 |
| 15 Alta Loma Dr | 0.41mi | 3/2.0 | 1,500 (-2%) | 4mo | $400,000 | $267 | 71 |
| 103 Norwick Ct | 0.23mi | 3/2.5 | 1,625 (+7%) | 3mo | $701,000 | $431 | 69 |
| 151 Heartford Way | 0.23mi | 3/2.0 | 1,379 (-10%) | 2mo | $730,000 | $529 | 68 |
| 144 James Rd | 0.10mi | 3/2.5 | 1,661 (+9%) | 12mo | $765,000 | $461 | 65 |
| 705 Danrose Dr | 0.70mi | 4/2.0 (+1) | 1,544 (+1%) | 2mo | $575,000 | $372 | 54 |
| 259 Los Altos Pl | 0.25mi | 3/2.0 | 1,744 (+14%) | 10mo | $567,500 | $325 | 52 |
| 532 Donaldson Way | 0.42mi | 3/2.0 | 1,408 (-8%) | 14mo | $440,000 | $313 | 52 |
| 248 W Carolyn Dr | 0.66mi | 4/2.0 (+1) | 1,541 (+1%) | 10mo | $625,000 | $406 | 49 |
| 208 Frontier St | 0.55mi | 3/2.5 | 1,706 (+12%) | 1mo | $729,000 | $427 | 47 |
| 2 Corvina Ct | 0.43mi | 3/2.5 | 1,351 (-11%) | 10mo | $565,000 | $418 | 47 |
| 240 W Carolyn Dr | 0.65mi | 4/2.0 (+1) | 1,661 (+9%) | 4mo | $585,000 | $352 | 43 |
Match score weights: distance 35% · size 25% · config 20% · recency 20%. Top-matched comps best support the ARV.
Projected returns pro-forma
-3.0% appreciation · 3.0% rent growth · sell at horizon
- IRR
- -15.1%
- Equity multiple
- 0.46×
- Total profit
- $-59,021
- Equity at exit
- $58,150
- IRR
- -6.6%
- Equity multiple
- 0.58×
- Total profit
- $-45,889
- Equity at exit
- $33,720
Cash invested: $109,200 (down + closing). Projections, not guarantees.
Landlord ↔ Tenant lean methodology
- Overall (STATE)
- 18 Strongly Tenant-Friendly
- State California
- 18 Strongly Tenant-Friendly · D+13
- County
- — inherits STATE
- City
- — inherits STATE
ZIP-level market 94503
- Home prices YoY
- -21.0%
- Active inventory
- 65
- Price-to-rent
- 9.3×
Monthly cashflow live
- Estimated rent
- $3,480 high interval (Pro) →
- Mortgage (P&I)
- −$2,045
- Tax from tax record
- −$477 /mo · $5,722/yr
- Insurance
- −$162
- HOA
- −$0
- Vacancy / Maint / Mgmt
- −$731
- Net cashflow
- $65
Break-even live
UW: 25.0% down · 7.5% · 30yr · 1.5% tax · 5.0% vac · 8.0% maint · 8.0% mgmt
Financing live
Cash to close
- Down payment
- $97,500
- Closing costs
- $11,700
- Reserves months
- —
- Total cash needed
- —
Loan-product check · same deal, 3 products live
Conventional
25% down · 7.5% · 30yr
- Down + closing
- —
- Monthly P&I
- —
- Monthly cashflow
- —
- DSCR
- —
- Eligible?
- —
Personal DTI + credit; lowest rate.
DSCR
20% down · 8.5% · 30yr
- Down + closing
- —
- Monthly P&I
- —
- Monthly cashflow
- —
- DSCR
- —
- Eligible?
- —
No personal income docs; deal must DSCR.
Hard money
10% down · 12.0% · 12mo
- Down + closing
- —
- Monthly P&I
- —
- Monthly cashflow
- —
- DSCR
- —
- Eligible?
- —
Short-term bridge; refi at stabilization.
Rent comps 8 comps
| Address | Beds | Baths | Sqft | Rent | $/sqft | DOM | Units | Dist |
|---|---|---|---|---|---|---|---|---|
| 100 Toscana Dr American Canyon, CA | 2.0–3.0 | 2.5–3.5 | 1466 | $3,828 | $2.61 | 13d | 5 | 0.47mi |
| 213 Jana Way American Canyon, CA | 4.0 | 2.0 | 1464 | $3,449 | $2.36 | 23d | 1 | 0.56mi |
| 15 Lena Dr American Canyon, CA | 4.0 | 2.0 | 1290 | $3,150 | $2.44 | 13d | 1 | 1.00mi |
| 800 Reliant Way American Canyon, CA | 1.0–2.0 | 1.0–2.0 | 955 | $2,460 | $2.58 | 13d | 4 | 1.07mi |
| 137 Imelda St Unit 3BR/1BA Vallejo, CA | 3.0 | 1.0 | 1080 | $3,250 | $3.01 | 13d | 1 | 1.13mi |
| 300 Swan Way Vallejo, CA | 3.0 | 2.0 | 1134 | $2,775 | $2.45 | 21d | 1 | 1.19mi |
| 123 David Ct Vallejo, CA | 3.0 | 2.0 | 1323 | $3,149 | $2.38 | 13d | 1 | 1.22mi |
| 2525 Flosden Rd #16 American Canyon, CA | 3.0 | 2.0 | 1244 | $2,795 | $2.25 | 13d | 1 | 1.33mi |
Listing history 2 events
-
2026-05-16status Pending 194-char remark
Show marketing remark (194 chars)
Affordable**Bring your tool belt and imagination to this single level home in American Canyon in a mature neighborhood. 3 bedroom 1 bath concrete block house is durable and has a good size lot.
-
2026-04-21$390,000 Active 194-char remark
Show marketing remark (194 chars)
Affordable**Bring your tool belt and imagination to this single level home in American Canyon in a mature neighborhood. 3 bedroom 1 bath concrete block house is durable and has a good size lot.
ⓘ Source: listings_history table (triggers on properties + properties_extension) + one-shot
backfill from property_details.listing_events for pre-trigger history.
Tax reassessment forecast CA · Resets to sale price
- Current annual tax
- $5,722 · $477/mo
- Projected year-2 tax
- $5,722 · $477/mo
- Expected delta
- $0/yr ($0/mo · 0.0%)
ⓘ Screening estimate from a state-policy table — verify with the county assessor before closing.
Climate risk First Street
- Flood 1/10 Low FEMA zone X (unshaded) · 0% chance over 30 yrs
- Wildfire 5/10 Major
- Heat 4/10 Moderate 7 d/yr ≥94°F today · 14 d/yr by 30 yrs out
- Wind 1/10 Low
- Air quality 8/10 Severe 13 unhealthy d/yr today · 13 by 30 yrs out
Nearby sold comps map
Loading sold comps map…
Walkable amenities ~0.75 mi
Loading nearby amenities…
Taxation est. · year 1
- Rental income
- $41,763
- − Mortgage interest
- −$21,846
- − Property taxes
- −$5,722
- − Insurance
- −$1,950
- − Repairs & maintenance
- −$3,341
- − Management
- −$3,341
- − Depreciation
- −$11,345
- Taxable loss
- −$5,783
- Est. tax savings @ 24.0%
- +$1,388
- After-tax cash flow
- $2,166/yr
For passive investors: Depreciation is non-cash, so a rental often shows a tax loss while cash-flowing — sheltering income. Rental losses are passive: they offset passive income freely, and up to $25,000/yr can offset ordinary (W-2) income if you actively participate and your MAGI is under $100k (phasing out to $0 by $150k); unused losses carry forward. On sale, claimed depreciation is recaptured at up to 25%, and gains may owe capital-gains tax (a 1031 exchange can defer both). Figures are a year-1 estimate at your 24.0% rate — not tax advice; consult a CPA.
Schools (NCES district)
- District
- Napa Valley Unified
- NCES district ID
- 0626640
- Math proficiency
- 35% ▲ 1.00%
- Reading proficiency
- 48% ▲ 2.00%
- Median HH income
- $72,007
- Composite
- 40.18/100
- National rank
- #7827
- State rank
- #599 of 1400 in CA
Livability — American Canyon
- Score
- 74/100
- State rank
- #133
- US rank
- #4684
Category grades
Schools grade is shown separately in the Schools card above.
Census & demographics
- Census place
- American Canyon, CA
- County
- Napa County · 120,669 people
- City population
- 21,841
- Metro
- Napa, CA
- Population (ZIP)
- 21,841
- Household income
- $121,088
- Rent vs Own
- Severe rent burden
- 486.0
Population outlook (Napa County) Hauer SSP2
- Today (2025)
- 153,987 people
- By 2030
- 159,490 · +3.6%
- By 2040
- 168,796 · +9.6%
- By 2050
- 176,213 · +14.4%
- By 2075
- 190,113 · +23.5%
- By 2100
- 190,528 · +23.7%
Race, ethnicity, and origin ACS 2023
- Neighborhood character
- Highly diverse neighborhood (Simpson 0.75)
- Race & ethnicity
- Asian 33% Hispanic / Latino 31% White 21% Two or more races 15% Black 6% Pacific Islander 1%
- Hispanic origin (detail)
- Mexican 25%
- Common ancestry
- Italian 2% Lithuanian 1% Romanian 1%
- Foreign-born
- 31% · Canada, China, Vietnam
- Languages at home
- 57% English-only · Spanish 22% Tagalog/Filipino 15% Other Indo-European 3%
Political lean MEDSL · Napa
- 2024 margin
- Solid D (+34.9) · D 65.9% · R 31.1% · Other 3.0%
- 2008→2024 swing
- +2.4pp toward D · 2008: 32.5pp · 2024: 34.9pp
- All cycles
- 2024: D+34.9 2020: D+40.4 2016: D+35.2 2012: D+25.7 2008: D+32.5
Not yet ingested
- Civics
- —
Market trends
- HPI YoY
- ▼ -97.47%
- Current HPI
- 366.9139
- Rent YoY
- —
- Metro
- Napa, CA
- State GDP YoY
- ▲ 3.21%
- F500 in state
- 116
Industry mix (Fortune 500 HQ in CA)
| Industry | F500 HQs | Revenue |
|---|---|---|
| Technology | 27 | $1,492B |
|
||
| Financial Services | 3 | $174B |
|
||
| Retail | 3 | $44B |
|
||
| Insurance | 3 | $26B |
|
||
| Media / Entertainment | 2 | $115B |
|
||
| Pharmaceuticals / Biotech | 2 | $62B |
|
||
Price history
2 events — show timeline
- 2026-05-16 Pending — BAREIS
- 2026-04-21 Listed $390,000 BAREIS
Property tax history
+15.0%/yrLatest (2025): $5,722 · +677.7% YoY. Source: county tax records.
Cash-flow waterfall
monthlySold comps — $/sqft
last 12 mo · ≤1 miLoading sold comps…