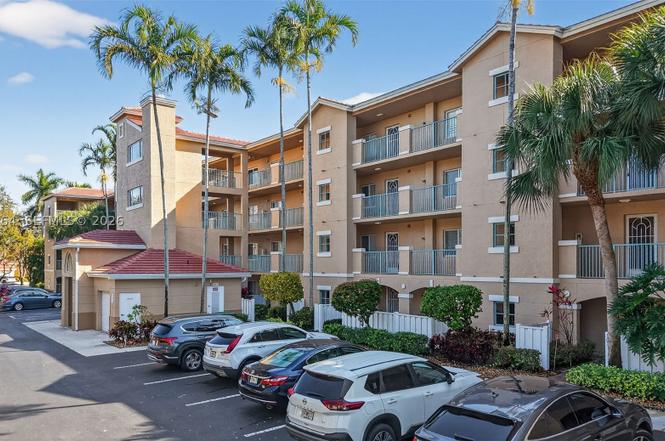
12540 Majesty Cir #208 · Delray Beach, FL
Flood risk 1/10 · Minimal
- FEMA flood zone
- X (unshaded)
- Chance of flooding over 30 yrs
- 0.0%
- Est. flood insurance / yr
- $507 – $1,088
Fire risk 1/10 · Minimal
- Est. fire insurance / yr
- $947 – $1,759
Heat risk 9/10 · Severe
- Hot days now (above 106°F)
- 7 days/yr
- Hot days in 30 yrs
- 25 days/yr
Wind risk 10/10 · Severe
- Chance of severe wind over 30 yrs
- 99.0%
Air-quality risk 2/10 · Minimal
- Unhealthy air days now
- 1 days/yr
- Unhealthy air days in 30 yrs
- 2 days/yr
Risk factors via First Street. Map © Google.
Why this score? — see what drove the D+ grade
The composite is a weighted blend of 9 inputs, each scored 0–100. Each bar is that input's sub-score; the figure is the points it added to the 100-point composite (weight × sub-score).
- Cash flow +11.4/30.0
- 1% rule +8.7/10.0
- ARV discount +7.5/15.0
- Appreciation +4.9/10.0
- Schools +4.3/10.0
- Livability +3.9/5.0
- DSCR +3.3/10.0
- Rent growth +2.8/5.0
- Condition / age +2.5/5.0
$239,900
🖨 Deal sheet 📄 Offer letter ✓ Due diligence
Listing remarks
Bright corner unit offering extra natural light and a smart open feeling. The home features renovated bathrooms no carpeting throughout for a modern, low-maintenance lifestyle that shows how meticulously it was cared for. This is a non-smoking, pet-free unit since day one, making it an excellent choice for buyers seeking a fresh pristine living space. Ideal for those who value cleanliness, comfort, and move in ready condition. NEW AIR CONDIONER installed 5/28/2026. The newly renovated 72,000 sq ft clubhouse features a 650 seat theater bwith Las Vegas style shows, indoor pool, cafe open 7 days a week. The sports complex features 10 tennis courts, 6 Pickleball courts with a pro for each. Boc
Key facts
- No carpeting
- Renovated bathrooms
- Corner unit
Tags
Property features AI
Finance
- Financial info: Pets allowed with restrictions or possible restrictions
- HOA & community: Quarterly association fee; Association amenities include clubhouse, fitness center, library, billiard room, pool, heated pool, tennis courts, pickleball, basketball court, shuffleboard court, elevators, recreation facilities and trash service; Association fee covers amenities, common areas, cable TV, insurance, internet, grounds maintenance, structure maintenance, parking, pest control, recreation facilities, trash and water; Large community with 1,372 units; Senior community
Exterior
- Parking: Guest parking; One assigned parking space
- Security: Security system; Elevator secured; Phone entry; Fire sprinkler system; Smoke detectors
- Utilities: Cable available
- Home design: Condominium with property attached; 4-story building; Entry located on level 2; Faces northeast; Builder model: Chardonnay; Block construction
- Construction: Block construction; Effective year built
- Exterior features: Association tennis courts; Heated association pool; Lakefront; Has a view; Is waterfront
Interior
- Kitchen: Dishwasher; Microwave; Refrigerator; Icemaker; Eat-in kitchen
- Bedrooms: Split bedrooms layout
- Flooring: Ceramic tile; Laminate
- Bathrooms: 2 full bathrooms; Dual sinks in primary
- Heating & cooling: Central heating (electric); Central air conditioning (electric); Ceiling fans
- Interior features: Partially furnished; Closet cabinetry; Dual sinks; Entrance foyer; Eat-in kitchen; Elevator; Sitting area in primary; Split bedrooms
- Laundry & utility: Washer; Dryer; Electric water heater; Utility room; Storage room
Neighborhood map
What this means for you Summary
Snapshot
- This is a 3-bed/2.0-bath condo listed at $240k.
Deal economics
- At list price, monthly cash flow is $-82 ($-983/yr) — negative.
- To cash-flow at today's rent, offer at most $225k (6.0% below list).
- Meets the 1% rule at list price ($3k rent vs $240k).
- Recommended offer: $211k (12.0% below list) — sets the bar for market timing.
- Cap rate 5.9% vs local median 4.3% in Delray Beach — top-decile yield for the area; either an underpriced asset or a hidden risk that comps aren't pricing in. Stress-test before assuming the spread holds.
Location & tenants
- Location reads 77/100 on livability (#202 in FL, #3,160 nationally) — a middle-class / working-renter tenant base. Strengths: housing A+, health & safety A+, commute A-; Watch: cost of living C-, crime D-, amenities F.
- Palm Beach (suburban): math 46% / reading 53% proficiency, ranked #34 of 73 in FL (top 47%) — families likely to look elsewhere, expect single-tenant / working-renter base with shorter leases.
- Market conditions: Rents rising (+1.3%/yr); 479 active listings in the ZIP; 40 comparable units currently listed for rent nearby; rentals at typical pace (median 25d on market — plan ~3-4 weeks tenant-placement turnaround); solid renter incomes; 3,974 units permitted in Palm Beach County in 2024 (1,012 in 5+ unit buildings).
- At $3,281/mo this rent would consume 49% of the median local household income ($81k/yr) (locally 902% of renters already pay >50% of income on rent) — very limited rent-growth headroom before tenants either downsize or default.
Forward outlook
- In year one you build about $1k of equity ($2k loan paydown + $-580 appreciation (-0.2% local appreciation)).
- Palm Beach County population projected at +30% by 2050 — long-run rental-demand tailwind backs the buy-and-hold thesis.
Negotiation context
- It's been on market 130 days — a 12% lower offer ($211k) is reasonable based on typical stale-listing flexibility.
Risks & watch-outs
- Watch-outs: HOA is 35% of rent.
- Climate carrying-cost: severe wind risk, 99% chance of damaging wind over 30y; extreme-heat days projected 7→25/yr by 2055 (HVAC capex compounding) — expect insurance premiums to compound above CPI over the hold.
Questions for the listing agent
- What do current leases actually rent for vs. the listed asking? Can we see a recent rent roll and the last 12 months of T-12 income?
- It's been on market 130 days. Have you received any prior offers? Is the seller open to a 12% concession, seller financing, or rate buy-down credit?
- What does the HOA fee cover, when was the last increase, and are there any pending special assessments or reserve-fund shortfalls?
- Any open or pending special assessments — roof, HVAC, plumbing, elevator, façade? What's the per-unit balance and payoff schedule, and is the seller paying it off at close or rolling it to the buyer?
- Why hasn't it sold? Are there any deal-killer items the seller is aware of (foundation, flood, title, zoning, code violations)?
- Is there a deadline driving the sale (1031 exchange, divorce, estate, relocation)? That informs how much negotiation room exists.
- Schools are B-rated — typically a magnet for longer-tenancy family renters. What's the average tenant stay here, and is there a school-zone premium baked into asking?
- Crime grade is D in this area — have there been break-ins, vandalism, or insurance claims at this property in the last 3 years? What carrier currently insures it and at what premium?
- The area grade is low — what's the realistic commute time and amenity access for the typical tenant pool here? Any planned neighborhood developments (good or bad) we should know about?
- What's the average days-on-market for RENTAL listings here right now (not sales)? A rising rental-DOM trend means longer vacancies and softer asking-rent achievability than the comps imply.
- What's the recent tenant-quality profile in this submarket — average credit score on applications, eviction rate, late-payment / NSF rate, and stable-employment percentage? A property-management company in the area should have these aggregated.
- How much new apartment / multifamily construction is in the pipeline within 1–3 miles? Heavy new supply (>2% of stock underway) typically softens rents 12–24 months out; light construction supports rent growth.
Investment metrics
- 1% rule
- 1.37% ✓
- Cap rate
- 5.88%
- Cash-on-cash
- -1.46%
- DSCR
- 0.93
- GRM
- 6.1
CMA / ARV
No comps found within radius.
Projected returns pro-forma
-0.24% appreciation · 1.28% rent growth · sell at horizon
- IRR
- -6.5%
- Equity multiple
- 0.70×
- Total profit
- $-19,854
- Equity at exit
- $66,774
- IRR
- -2.3%
- Equity multiple
- 0.78×
- Total profit
- $-14,952
- Equity at exit
- $77,998
Cash invested: $67,172 (down + closing). Projections, not guarantees.
Landlord ↔ Tenant lean methodology
- Overall (STATE)
- 87 Strongly Landlord-Friendly
- State Florida
- 87 Strongly Landlord-Friendly · R+3
- County
- — inherits STATE
- City
- — inherits STATE
ZIP-level market 33437
- Home prices YoY
- -0.1%
- Rents YoY
- 1.3%
- Active inventory
- 479
- Price-to-rent
- 6.1×
Monthly cashflow live
- Estimated rent
- $3,281 high interval (Pro) →
- Mortgage (P&I)
- −$1,258
- Tax from tax record
- −$163 /mo · $1,952/yr
- Insurance
- −$100
- HOA
- −$1,153
- Vacancy / Maint / Mgmt
- −$689
- Net cashflow
- $-82
Break-even live
UW: 25.0% down · 7.5% · 30yr · 1.5% tax · 5.0% vac · 8.0% maint · 8.0% mgmt
Financing live
Cash to close
- Down payment
- $59,975
- Closing costs
- $7,197
- Reserves months
- —
- Total cash needed
- —
Loan-product check · same deal, 3 products live
Conventional
25% down · 7.5% · 30yr
- Down + closing
- —
- Monthly P&I
- —
- Monthly cashflow
- —
- DSCR
- —
- Eligible?
- —
Personal DTI + credit; lowest rate.
DSCR
20% down · 8.5% · 30yr
- Down + closing
- —
- Monthly P&I
- —
- Monthly cashflow
- —
- DSCR
- —
- Eligible?
- —
No personal income docs; deal must DSCR.
Hard money
10% down · 12.0% · 12mo
- Down + closing
- —
- Monthly P&I
- —
- Monthly cashflow
- —
- DSCR
- —
- Eligible?
- —
Short-term bridge; refi at stabilization.
Rent comps 40 comps
| Address | Beds | Baths | Sqft | Rent | $/sqft | DOM | Units | Dist |
|---|---|---|---|---|---|---|---|---|
| 12547 Imperial Isle Dr Boynton Beach, FL | 2.0–3.0 | 2.0 | 1500 | $4,500 | $3.00 | 24d | 2 | 0.13mi |
| 12390 Summer Springs Dr Boynton Beach, FL | 3.0 | 2.0 | 1861 | $3,300 | $1.77 | 24d | 1 | 0.20mi |
| 12299 Forest Greens Dr Boynton Beach, FL | 2.0 | 2.0 | 1310 | $2,450 | $1.87 | 17d | 1 | 0.31mi |
| 5952 Regal Glen Dr #103 Boynton Beach, FL | 3.0 | 2.0 | 1813 | $2,550 | $1.41 | 24d | 1 | 0.40mi |
| 5574 Royal Lake Cir Boynton Beach, FL | 3.0 | 2.0 | 1658 | $5,000 | $3.02 | 15d | 1 | 0.41mi |
| 5335 Vernio Ln Boynton Beach, FL | 3.0 | 2.0 | 1798 | $3,700 | $2.06 | 24d | 1 | 0.45mi |
| 5694 Northpointe Ln Boynton Beach, FL | 2.0 | 2.0 | 1125 | $2,825 | $2.51 | 7d | 1 | 0.49mi |
| 5675 Northpointe Ln Boynton Beach, FL | 2.0 | 2.5 | 1163 | $2,950 | $2.54 | 24d | 1 | 0.50mi |
| 5675 Northpointe Ln Boynton Beach, FL | 2.0 | 2.0 | 1163 | $3,000 | $2.58 | 3d | 1 | 0.50mi |
| 5734 Northpointe Ln Boynton Beach, FL | 2.0 | 2.0 | 1125 | $2,750 | $2.44 | 15d | 1 | 0.50mi |
| 5734 Northpointe Ln Boynton Beach, FL | 2.0 | 2.0 | 1125 | $2,600 | $2.31 | 4d | 1 | 0.50mi |
| 5850 Sugar Palm Ct Delray Beach, FL | 2.0 | 2.0 | 1198 | $3,300 | $2.75 | 24d | 1 | 0.51mi |
| 12118 Country Greens Blvd Boynton Beach, FL | 3.0 | 2.0 | 1566 | $3,000 | $1.92 | 11d | 1 | 0.51mi |
| 12654 Via Ravenna Boynton Beach, FL | 3.0 | 2.0 | 1729 | $3,500 | $2.02 | 24d | 1 | 0.55mi |
| 13921 Royal Palm Ct Unit D Delray Beach, FL | 2.0 | 2.0 | 1205 | $4,000 | $3.32 | 7d | 1 | 0.57mi |
| 12932 Anthorne Ln Boynton Beach, FL | 4.0 | 3.5 | 2008 | $3,750 | $1.87 | 20d | 1 | 0.61mi |
| 13817 Royal Palm Ct Unit B Delray Beach, FL | 2.0 | 2.0 | 1205 | $3,200 | $2.66 | 24d | 1 | 0.65mi |
| 5750 Fairway Park Ct #101 Boynton Beach, FL | 3.0 | 2.0 | 1426 | $1,850 | $1.30 | 24d | 1 | 0.69mi |
| 13283 Pineapple Palm Ct Unit F Delray Beach, FL | 2.0 | 2.0 | 1198 | $2,100 | $1.75 | 7d | 1 | 0.71mi |
| 13283 Pineapple Palm Ct Unit F Delray Beach, FL | 2.0 | 2.0 | 1198 | $2,100 | $1.75 | 24d | 1 | 0.71mi |
| 13297 Via Vulcanus Unit B Delray Beach, FL | 2.0 | 2.0 | 1527 | $3,000 | $1.96 | 7d | 1 | 0.77mi |
| 13431 Amber Waves Ave Delray Beach, FL | 2.0 | 2.0 | 1390 | $3,500 | $2.52 | 24d | 1 | 0.82mi |
| 6599 Old Farm Trl #6599 Boynton Beach, FL | 3.0 | 2.5 | 1441 | $3,000 | $2.08 | 24d | 1 | 0.82mi |
| 11690 Briarwood Cir Boynton Beach, FL | 3.0 | 2.0 | 1952 | $3,400 | $1.74 | 24d | 1 | 0.86mi |
| 13255 Royale Sabal Ct Delray Beach, FL | 3.0 | 2.5 | 1618 | $4,300 | $2.66 | 24d | 1 | 0.88mi |
| 5449 Grande Palm Cir Delray Beach, FL | 3.0 | 2.5 | 1618 | $4,000 | $2.47 | 24d | 1 | 0.89mi |
| 5449 Grande Palm Cir Delray Beach, FL | 3.0 | 2.5 | 1618 | $4,000 | $2.47 | 17d | 1 | 0.89mi |
| 6768 Heritage Grande Boynton Beach, FL | 2.0 | 2.0 | 1200 | $1,800 | $1.50 | 18d | 1 | 0.90mi |
| 6768 Heritage Grande Boynton Beach, FL | 2.0 | 2.0 | 1200 | $1,800 | $1.50 | 24d | 1 | 0.90mi |
| 6633 Old Farm Trl Boynton Beach, FL | 3.0 | 2.5 | 1441 | $3,500 | $2.43 | 24d | 1 | 0.90mi |
| 5675 Queen Palm Ct Delray Beach, FL | 2.0 | 2.0 | 1200 | $2,600 | $2.17 | 24d | 1 | 0.91mi |
| 5908 Via Delray Blvd Delray Beach, FL | 2.0 | 2.0 | 1221 | $2,000 | $1.64 | 24d | 1 | 0.91mi |
| 13413 Via Vesta Unit A Delray Beach, FL | 4.0 | 2.0 | 1196 | $2,100 | $1.76 | 17d | 1 | 0.92mi |
| 5655 Via Delray Delray Beach, FL | 2.0 | 2.0 | 1205 | $2,200 | $1.83 | 24d | 1 | 0.93mi |
| 13759 Date Palm Ct Unit A Delray Beach, FL | 2.0 | 2.0 | 1247 | $3,500 | $2.81 | 24d | 1 | 0.93mi |
| 5256 Glenville Dr Boynton Beach, FL | 3.0 | 2.0 | 2015 | $5,000 | $2.48 | 2d | 1 | 1.04mi |
| 6685 Old Farm Trl Boynton Beach, FL | 3.0 | 2.0 | 1361 | $2,995 | $2.20 | 24d | 1 | 1.04mi |
| 5260 Grande Palm Cir Delray Beach, FL | 3.0 | 2.0 | 1464 | $2,800 | $1.91 | 24d | 1 | 1.06mi |
| 13653 Jubilee Ln Delray Beach, FL | 3.0 | 2.0 | 1305 | $3,450 | $2.64 | 14d | 1 | 1.06mi |
| 5462 Via Delray #123 Delray Beach, FL | 2.0 | 2.0 | 1200 | $2,700 | $2.25 | 20d | 1 | 1.09mi |
HOA detail condo
- Monthly dues
- $1,153 · $13,836/yr
- Likely covers
- gaspool
- Assessments
- None detected in remarks — confirm with the listing agent.
Listing history 14 events
-
2026-06-18days on market $239,900 Active 130 DOM
-
2026-06-17days on market $239,900 Active 129 DOM
-
2026-06-16days on market $239,900 Active 128 DOM
-
2026-06-15days on market $239,900 Active 127 DOM
-
2026-06-13days on market $239,900 Active 125 DOM
-
2026-06-09days on market $239,900 Active 121 DOM
-
2026-06-07days on market $239,900 Active 119 DOM
-
2026-06-04pricedays on market $239,900 Active 116 DOM
-
2026-06-03days on market $279,000 Active 115 DOM
-
2026-06-02remarks 699-char remark
-
2026-06-01days on market $279,000 Active 113 DOM
-
2026-05-31days on market $279,000 Active 112 DOM
-
2026-03-05price $279,000
-
2026-02-08$299,000 Active
ⓘ Source: listings_history table (triggers on properties + properties_extension) + one-shot
backfill from property_details.listing_events for pre-trigger history.
Tax reassessment forecast FL · Resets to sale price
- Current annual tax
- $1,952 · $163/mo
- Projected year-2 tax
- $1,991 · $166/mo
- Expected delta
- +$39/yr (+$3/mo · 2.0%)
ⓘ Screening estimate from a state-policy table — verify with the county assessor before closing.
Climate risk First Street
- Flood 1/10 Low FEMA zone X (unshaded) · 0% chance over 30 yrs
- Wildfire 1/10 Low
- Heat 9/10 Extreme 7 d/yr ≥106°F today · 25 d/yr by 30 yrs out
- Wind 10/10 Extreme 99% chance of damaging wind over 30 yrs
- Air quality 2/10 Low 1 unhealthy d/yr today · 2 by 30 yrs out
Nearby sold comps map
Loading sold comps map…
Walkable amenities ~0.75 mi
Loading nearby amenities…
Taxation est. · year 1
- Rental income
- $39,369
- − Mortgage interest
- −$13,438
- − Property taxes
- −$1,952
- − Insurance
- −$1,200
- − Repairs & maintenance
- −$3,150
- − Management
- −$3,150
- − HOA
- −$13,836
- − Depreciation
- −$6,979
- Taxable loss
- −$4,334
- Est. tax savings @ 24.0%
- +$1,040
- After-tax cash flow
- $58/yr
For passive investors: Depreciation is non-cash, so a rental often shows a tax loss while cash-flowing — sheltering income. Rental losses are passive: they offset passive income freely, and up to $25,000/yr can offset ordinary (W-2) income if you actively participate and your MAGI is under $100k (phasing out to $0 by $150k); unused losses carry forward. On sale, claimed depreciation is recaptured at up to 25%, and gains may owe capital-gains tax (a 1031 exchange can defer both). Figures are a year-1 estimate at your 24.0% rate — not tax advice; consult a CPA.
Schools (NCES district)
- District
- Palm Beach
- NCES district ID
- 1201500
- Math proficiency
- 46% ▼ -16.00%
- Reading proficiency
- 53% ▼ -4.00%
- Median HH income
- $53,943
- Composite
- 42.72/100
- National rank
- #3160
- State rank
- #34 of 73 in FL
Livability — Delray Beach
- Score
- 77/100
- State rank
- #202
- US rank
- #3160
Category grades
Schools grade is shown separately in the Schools card above.
Census & demographics
- County
- Palm Beach County · 1,438,312 people
- City population
- 123,167
- Metro
- Miami-Fort Lauderdale-Pompano Beach, FL
- Population (ZIP)
- 37,229
- Household income
- $80,710
- Rent vs Own
- Severe rent burden
- 902.0
Population outlook (Palm Beach County) Hauer SSP2
- Today (2025)
- 1,637,487 people
- By 2030
- 1,743,255 · +6.5%
- By 2040
- 1,948,712 · +19.0%
- By 2050
- 2,132,979 · +30.3%
- By 2075
- 2,530,027 · +54.5%
- By 2100
- 2,706,979 · +65.3%
Race, ethnicity, and origin ACS 2023
- Neighborhood character
- Predominantly White (68%)
- Race & ethnicity
- White 68% Two or more races 13% Hispanic / Latino 12% Black 10% Asian 3%
- Hispanic origin (detail)
- Mexican 1% Puerto Rican 2% Cuban 1% Dominican 1%
- Common ancestry
- Scotch-Irish 8% Romanian 8% Hispanic 6%
- Foreign-born
- 18% · Canada, Jamaica, Vietnam
- Languages at home
- 78% English-only · Spanish 10% French/Haitian/Cajun 6% Other Indo-European 2%
Political lean MEDSL · Palm Beach
- 2024 margin
- Toss-up / Even · D 50.0% · R 49.2%
- 2008→2024 swing
- -22.1pp toward R · 2008: 22.9pp · 2024: 0.8pp
- All cycles
- 2024: D+0.8 2020: D+12.8 2016: D+15.3 2012: D+17.0 2008: D+22.9
Not yet ingested
- Civics
- —
Market trends
- HPI YoY
- ▼ -0.24%
- Current HPI
- 257.5891
- Rent YoY
- ▲ 1.28%
- Metro
- Miami-Fort Lauderdale-Pompano Beach, FL
- State GDP YoY
- ▲ 3.28%
- F500 in state
- 36
Industry mix (Fortune 500 HQ in FL)
| Industry | F500 HQs | Revenue |
|---|---|---|
| Industrial Technology | 2 | $29B |
|
||
| Insurance | 2 | $17B |
|
||
| Retail | 1 | $60B |
|
||
| Technology Distribution | 1 | $58B |
|
||
| Homebuilding | 1 | $35B |
|
||
| Technology Manufacturing | 1 | $35B |
|
||
Price history
-6.7% since first listed2 events — show timeline
- 2026-03-05 Price Changed $279,000 MARMLS
- 2026-02-08 Listed $299,000 MARMLS
Property tax history
+0.7%/yrLatest (2025): $1,952 · +3.8% YoY. Source: county tax records.
Cash-flow waterfall
monthlySold comps — $/sqft
last 12 mo · ≤1 miLoading sold comps…