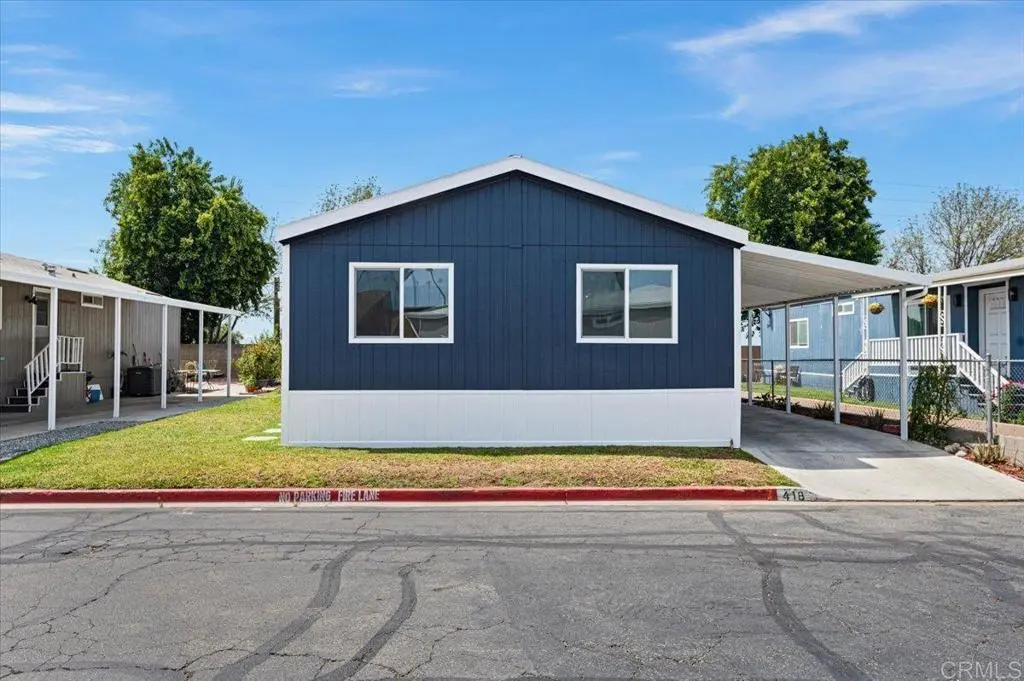
1855 E Riverside Dr #418 · Ontario, CA
Flood risk 1/10 · Minimal
- FEMA flood zone
- X (shaded)
- Chance of flooding over 30 yrs
- 0.0%
- Est. flood insurance / yr
- $507 – $1,088
Fire risk 3/10 · Minor
- Est. fire insurance / yr
- $659 – $1,223
Heat risk 8/10 · Major
- Hot days now (above 101°F)
- 7 days/yr
- Hot days in 30 yrs
- 18 days/yr
Wind risk 1/10 · Minimal
- Chance of severe wind over 30 yrs
- —
Air-quality risk 9/10 · Severe
- Unhealthy air days now
- 23 days/yr
- Unhealthy air days in 30 yrs
- 26 days/yr
Risk factors via First Street. Map © Google.
Why this score? — see what drove the B grade
The composite is a weighted blend of 9 inputs, each scored 0–100. Each bar is that input's sub-score; the figure is the points it added to the 100-point composite (weight × sub-score).
- Cash flow +30.0/30.0
- DSCR +10.0/10.0
- 1% rule +9.1/10.0
- ARV discount +7.5/15.0
- Schools +5.0/10.0
- Livability +3.2/5.0
- Rent growth +3.1/5.0
- Condition / age +2.5/5.0
- Appreciation +0.0/10.0
$220,000
🖨 Deal sheet 📄 Offer letter ✓ Due diligence
Listing remarks MLS
Welcome to Country Meadows! This comfy manufactured home was built in 1998 and has 3 bedrooms, 2 baths and a bonus room that could be used as an office or for extra storage. The large porch is located on the left side of the home where as you enter, you are welcomed by the spacious living and dining room combo with fireplace. The kitchen has a nice amount of cabinets for storage and there are laminate floors throughout. The laundry room has washer and dryer seller will be leaving in the property and the A/C unit was recently replaced. The carport can easily fit 3 vehicles. Nice yard space for entertaining or just relaxing and enjoying the Ontario breeze. The Country Meadows community has a pool, playground, laundry room area as well as a clubhouse. Shopping, parks, schools and freeways are all nearby!
Key facts
- Walk-in closet
- Private bathroom
- Vaulted ceilings
Tags
Property features AI
Finance
- Other: Lot size estimated; lot categorized as 0-1 unit/acre
- Financial info: Monthly land lease approximately $2,130
- HOA & community: Land lease within the park
Exterior
- Parking: 2 parking spaces; 2 carport spaces; Located in Country Meadows park
- Utilities: Public sewer; No water source specified
- Home design: Manufactured/mobile home; Model 3483A; Single-story; Has a view
- Construction: Mobile home remains on site; Mobile dimensions approximately 24 ft by 48 ft; Year built reported by seller
- Exterior features: Community pool; Suburban community
Interior
- Bedrooms: Primary bedroom on main level
- Bathrooms: 2 full bathrooms
- Heating & cooling: Central cooling
- Interior features: One-level entry; Left-side entry; Walk-in closet(s); Primary bedroom; All bedrooms on ground level; Living room
- Laundry & utility: In-home laundry; Gas and electric dryer hookups
Neighborhood map
What this means for you Summary
Snapshot
- This is a 3-bed/2.0-bath manufactured listed at $220k.
Deal economics
- At list price, monthly cash flow is $927 ($11k/yr) — positive.
- The deal already cash-flows at list — no discount required.
- Meets the 1% rule at list price ($3k rent vs $220k).
- Cap rate 11.4% vs local median 2.7% in Ontario — top-decile yield for the area; either an underpriced asset or a hidden risk that comps aren't pricing in. Stress-test before assuming the spread holds.
Location & tenants
- Location reads 63/100 on livability (#435 in CA) — a middle-class / working-renter tenant base. Strengths: commute A-, housing B+; Watch: schools F, cost of living F, health & safety F.
- Chino Valley Unified (suburban): math 46% / reading 58% proficiency, ranked #334 of 1,400 in CA (top 24%) — acceptable for families but not a draw, mixed tenant base, ~2y average lease.
- Market conditions: Rents rising (+2.4%/yr); 314 active listings in the ZIP; 4 comparable units currently listed for rent nearby; rentals leasing fast (median 3d on market — plan ~1-2 weeks tenant-placement turnaround); solid renter incomes; 5,458 units permitted in San Bernardino County in 2024 (1,500 in 5+ unit buildings).
- This rent runs 37% of the median local income ($101k/yr) — at the standard rent-burdened threshold; future hikes will face affordability resistance.
Forward outlook
- Local home prices are declining (-3.0%/yr); year-one equity from $2k of loan paydown is wiped out by about $7k of value loss. Plan a longer hold.
- San Bernardino County population projected at +15% by 2050 — modest demand growth; plan on rents tracking national, not racing it.
- At projected returns (-3.0% appreciation + 2.4% rent growth), your $62k cash investment doubles in ~7 years — after that, you're playing with house money.
Negotiation context
- Only 13 days on market — expect competitive offers; lowballing is unlikely to land.
- 10 sale attempts since 7y ago with the ask held roughly flat each time — persistent listings suggest the price (not the market) is what's stuck; bring a comps-based counter.
- Current owner paid $67k; list at $220k implies a 228% gain — meaningful room to come down on a strong offer.
Risks & watch-outs
- Climate carrying-cost: extreme-heat days projected 7→18/yr by 2055 (HVAC capex compounding) — expect insurance premiums to compound above CPI over the hold.
Questions for the listing agent
- Is there a deadline driving the sale (1031 exchange, divorce, estate, relocation)? That informs how much negotiation room exists.
- Schools are F-rated, which usually means shorter tenancies and higher turnover. Who's the typical renter profile here, and what's been the actual vacancy rate?
- What's the average days-on-market for RENTAL listings here right now (not sales)? A rising rental-DOM trend means longer vacancies and softer asking-rent achievability than the comps imply.
- What's the recent tenant-quality profile in this submarket — average credit score on applications, eviction rate, late-payment / NSF rate, and stable-employment percentage? A property-management company in the area should have these aggregated.
- How much new for-sale + rental construction is in the pipeline within 1–3 miles? Heavy new supply typically softens prices + rents 12–24 months out; constrained supply supports both.
Investment metrics
- 1% rule
- 1.41% ✓
- Cap rate
- 11.35%
- Cash-on-cash
- 18.07%
- DSCR
- 1.80
- GRM
- 5.9
CMA / ARV
- ARV (on-the-fly)
- $95,616
- Comps found
- 11
Show comp detail 11 sales within ~0.75 mi
| Address | Dist | Beds/Ba | Sqft | Sold | Price | $/sf | Match |
|---|---|---|---|---|---|---|---|
| 1855 E Riverside Dr #9 | 0.00mi | 3/2.0 | 1,176 (+2%) | 6mo | $116,300 | $99 | 91 |
| 1855 E Riverside Dr #133 | 0.00mi | 3/2.0 | 1,176 (+2%) | 8mo | $98,100 | $83 | 90 |
| 1855 E Riverside Dr #347 | 0.00mi | 3/2.0 | 1,176 (+2%) | 20mo | $107,000 | $91 | 80 |
| 1855 Riverside Dr E #128 | 0.00mi | 3/2.0 | 1,260 (+9%) | 6mo | $85,000 | $67 | 80 |
| 1855 E Riverside Dr #370 | 0.16mi | 3/2.0 | 1,152 (0%) | 16mo | $85,000 | $74 | 79 |
| 1855 E Riverside Dr #185 | 0.00mi | 3/2.0 | 1,176 (+2%) | 22mo | $105,000 | $89 | 78 |
| 1855 E Riverside #254 | 0.00mi | 3/2.0 | 1,176 (+2%) | 23mo | $110,000 | $94 | 77 |
| 1855 E Riverside Dr #110 | 0.00mi | 3/2.0 | 1,272 (+10%) | 9mo | $100,000 | $79 | 76 |
| 1855 E Riverside Dr #348 | 0.00mi | 3/2.0 | 1,272 (+10%) | 10mo | $145,000 | $114 | 74 |
| 1855 E Riverside Dr #232 | 0.00mi | 3/2.0 | 1,272 (+10%) | 12mo | $102,000 | $80 | 72 |
| 1855 E Riverside Dr #394 | 0.16mi | 2/2.0 (-1) | 1,128 (-2%) | 22mo | $89,000 | $79 | 66 |
Match score weights: distance 35% · size 25% · config 20% · recency 20%. Top-matched comps best support the ARV.
Projected returns pro-forma
-3.0% appreciation · 2.39% rent growth · sell at horizon
- IRR
- 9.0%
- Equity multiple
- 1.35×
- Total profit
- $21,570
- Equity at exit
- $32,803
- IRR
- 17.7%
- Equity multiple
- 2.42×
- Total profit
- $87,365
- Equity at exit
- $19,022
Cash invested: $61,600 (down + closing). Projections, not guarantees.
Landlord ↔ Tenant lean methodology
- Overall (STATE)
- 18 Strongly Tenant-Friendly
- State California
- 18 Strongly Tenant-Friendly · D+13
- County
- — inherits STATE
- City
- — inherits STATE
ZIP-level market 91761
- Rents YoY
- 2.4%
- Active inventory
- 314
- Price-to-rent
- 5.9×
Monthly cashflow live
- Estimated rent
- $3,098 medium interval (Pro) →
- Mortgage (P&I)
- −$1,154
- Tax est. 1.5%
- −$275 /mo · $3,300/yr
- Insurance
- −$92
- HOA
- −$0
- Vacancy / Maint / Mgmt
- −$651
- Net cashflow
- $927
Break-even live
UW: 25.0% down · 7.5% · 30yr · 1.5% tax · 5.0% vac · 8.0% maint · 8.0% mgmt
Financing live
Cash to close
- Down payment
- $55,000
- Closing costs
- $6,600
- Reserves months
- —
- Total cash needed
- —
Loan-product check · same deal, 3 products live
Conventional
25% down · 7.5% · 30yr
- Down + closing
- —
- Monthly P&I
- —
- Monthly cashflow
- —
- DSCR
- —
- Eligible?
- —
Personal DTI + credit; lowest rate.
DSCR
20% down · 8.5% · 30yr
- Down + closing
- —
- Monthly P&I
- —
- Monthly cashflow
- —
- DSCR
- —
- Eligible?
- —
No personal income docs; deal must DSCR.
Hard money
10% down · 12.0% · 12mo
- Down + closing
- —
- Monthly P&I
- —
- Monthly cashflow
- —
- DSCR
- —
- Eligible?
- —
Short-term bridge; refi at stabilization.
Rent comps 4 comps
| Address | Beds | Baths | Sqft | Rent | $/sqft | DOM | Units | Dist |
|---|---|---|---|---|---|---|---|---|
| 2550 E Riverside Dr Ontario, CA | 1.0–2.0 | 1.0–2.0 | 835 | $2,795 | $3.35 | 4d | 8 | 1.03mi |
| 1110 E Philadelphia St Ontario, CA | 1.0–2.0 | 1.0–2.0 | 904 | $3,207 | $3.55 | 2d | 12 | 1.27mi |
| 3303 S Archibald Ave Ontario, CA | 1.0–2.0 | 1.0–2.0 | 877 | $2,861 | $3.26 | 2d | 27 | 1.29mi |
| 2432 S Garfield Pl Ontario, CA | 3.0 | 2.0 | 1118 | $3,150 | $2.82 | 2d | 1 | 1.36mi |
Listing history 9 events
-
2026-06-18days on market $220,000 Active 13 DOM
-
2026-06-17days on market $220,000 Active 12 DOM
-
2026-06-16days on market $220,000 Active 11 DOM
-
2026-06-15days on market $220,000 Active 10 DOM
-
2026-06-13days on market $220,000 Active 8 DOM
-
2026-06-09days on market $220,000 Active 4 DOM
-
2026-06-08days on market $220,000 Active 3 DOM
-
2026-06-07remarks 699-char remark
-
2026-06-07$220,000 Active 2 DOM
ⓘ Source: listings_history table (triggers on properties + properties_extension) + one-shot
backfill from property_details.listing_events for pre-trigger history.
Climate risk First Street
- Flood 1/10 Low FEMA zone X (shaded) · 0% chance over 30 yrs
- Wildfire 3/10 Moderate
- Heat 8/10 Severe 7 d/yr ≥101°F today · 18 d/yr by 30 yrs out
- Wind 1/10 Low
- Air quality 9/10 Extreme 23 unhealthy d/yr today · 26 by 30 yrs out
Nearby sold comps map
Loading sold comps map…
Walkable amenities ~0.75 mi
Loading nearby amenities…
Taxation est. · year 1
- Rental income
- $37,181
- − Mortgage interest
- −$12,323
- − Property taxes
- −$3,300
- − Insurance
- −$1,100
- − Repairs & maintenance
- −$2,974
- − Management
- −$2,974
- − Depreciation
- −$6,400
- Taxable income
- $8,108
- Est. tax owed @ 24.0%
- −$1,946
- After-tax cash flow
- $9,182/yr
For passive investors: Depreciation is non-cash, so a rental often shows a tax loss while cash-flowing — sheltering income. Rental losses are passive: they offset passive income freely, and up to $25,000/yr can offset ordinary (W-2) income if you actively participate and your MAGI is under $100k (phasing out to $0 by $150k); unused losses carry forward. On sale, claimed depreciation is recaptured at up to 25%, and gains may owe capital-gains tax (a 1031 exchange can defer both). Figures are a year-1 estimate at your 24.0% rate — not tax advice; consult a CPA.
Schools (NCES district)
- District
- Chino Valley Unified
- NCES district ID
- 0608460
- Math proficiency
- 46% ▲ 1.00%
- Reading proficiency
- 58% ▲ 1.00%
- Median HH income
- $83,575
- Composite
- 49.56/100
- National rank
- #4275
- State rank
- #334 of 1400 in CA
Livability — Ontario
- Score
- 63/100
- State rank
- #435
- US rank
- #14949
Category grades
Schools grade is shown separately in the Schools card above.
Census & demographics
- Census place
- Ontario, CA
- County
- San Bernardino County · 2,030,291 people
- City population
- 183,440
- Metro
- Riverside-San Bernardino-Ontario, CA
- Population (ZIP)
- 62,935
- Household income
- $100,578
- Rent vs Own
- Severe rent burden
- 1853.0
Population outlook (San Bernardino County) Hauer SSP2
- Today (2025)
- 2,300,329 people
- By 2030
- 2,378,907 · +3.4%
- By 2040
- 2,523,137 · +9.7%
- By 2050
- 2,642,388 · +14.9%
- By 2075
- 2,880,769 · +25.2%
- By 2100
- 2,909,436 · +26.5%
Race, ethnicity, and origin ACS 2023
- Neighborhood character
- Predominantly Hispanic (66%)
- Race & ethnicity
- Hispanic / Latino 66% Two or more races 23% White 15% Asian 9% Black 6% Native American 2%
- Hispanic origin (detail)
- Mexican 59%
- Common ancestry
- Iranian 1% Lithuanian 1% Italian 1%
- Foreign-born
- 24% · Canada, China, Vietnam
- Languages at home
- 51% English-only · Spanish 41% Chinese 3% Tagalog/Filipino 1%
Political lean MEDSL · San Bernardino
- 2024 margin
- Toss-up / Even · D 47.5% · R 49.7% · Other 2.8%
- 2008→2024 swing
- -8.5pp toward R · 2008: 6.3pp · 2024: -2.1pp
- All cycles
- 2024: R+2.1 2020: D+10.7 2016: D+9.8 2012: D+5.4 2008: D+6.3
Not yet ingested
- Civics
- —
Market trends
- HPI YoY
- ▼ -374.91%
- Current HPI
- 400.5674
- Rent YoY
- ▲ 2.39%
- Metro
- Riverside-San Bernardino-Ontario, CA
- State GDP YoY
- ▲ 3.21%
- F500 in state
- 116
Industry mix (Fortune 500 HQ in CA)
| Industry | F500 HQs | Revenue |
|---|---|---|
| Technology | 27 | $1,492B |
|
||
| Financial Services | 3 | $174B |
|
||
| Retail | 3 | $44B |
|
||
| Insurance | 3 | $26B |
|
||
| Media / Entertainment | 2 | $115B |
|
||
| Pharmaceuticals / Biotech | 2 | $62B |
|
||
Price history
+84.9% since first listed22 events — show timeline
- 2026-06-05 Listed $220,000 CRMLS
- 2022-01-25 Sold (MLS) $67,000 CRMLS
- 2021-12-24 Pending — CRMLS
- 2021-12-03 Contingent — CRMLS
- 2021-11-17 Price Changed $69,000 CRMLS
- 2021-11-09 Relisted — CRMLS
- 2021-11-07 Relisted — CRMLS
- 2021-11-06 Relisted — CRMLS
- 2021-10-27 Relisted — CRMLS
- 2021-10-21 Listed $72,000 CRMLS
- 2021-10-21 Coming Soon $72,000 CRMLS
- 2020-11-13 Sold (MLS) $66,000 CRMLS
- 2020-10-20 Pending — CRMLS
- 2020-09-23 Relisted — CRMLS
- 2020-09-16 Pending — CRMLS
- 2020-09-09 Relisted — CRMLS
- 2020-07-30 Price Changed $65,000 CRMLS
- 2020-06-20 Listed $75,000 CRMLS
- 2019-09-15 Listing Removed — CRMLS
- 2019-07-26 Price Changed $100,000 CRMLS
- 2019-05-31 Price Changed $110,000 CRMLS
- 2019-03-15 Listed $119,000 CRMLS
Property tax history
-0.9%/yrLatest (2025): $369 · +0.7% YoY. Source: county tax records.
Cash-flow waterfall
monthlySold comps — $/sqft
last 12 mo · ≤1 miLoading sold comps…