1595 Curlew Ave #4 · Naples, FL
Flood risk 9/10 · Severe
- FEMA flood zone
- AE
- Chance of flooding over 30 yrs
- 0.99%
- Est. flood insurance / yr
- $1,737 – $8,500
Fire risk 3/10 · Minor
- Est. fire insurance / yr
- $947 – $1,759
Heat risk 10/10 · Severe
- Hot days now (above 107°F)
- 7 days/yr
- Hot days in 30 yrs
- 28 days/yr
Wind risk 10/10 · Severe
- Chance of severe wind over 30 yrs
- 99.0%
Air-quality risk 3/10 · Minor
- Unhealthy air days now
- 3 days/yr
- Unhealthy air days in 30 yrs
- 3 days/yr
Risk factors via First Street. Map © Google.
Why this score? — see what drove the D+ grade
The composite is a weighted blend of 9 inputs, each scored 0–100. Each bar is that input's sub-score; the figure is the points it added to the 100-point composite (weight × sub-score).
- Cash flow +9.0/30.0
- ARV discount +7.5/15.0
- Appreciation +7.0/10.0
- Schools +5.0/10.0
- Rent growth +4.7/5.0
- 1% rule +4.4/10.0
- Livability +4.0/5.0
- DSCR +2.5/10.0
- Condition / age +2.5/5.0
$570,000
🖨 Deal sheet (PDF) 📄 Offer letter ✓ Due diligence
Listing remarks
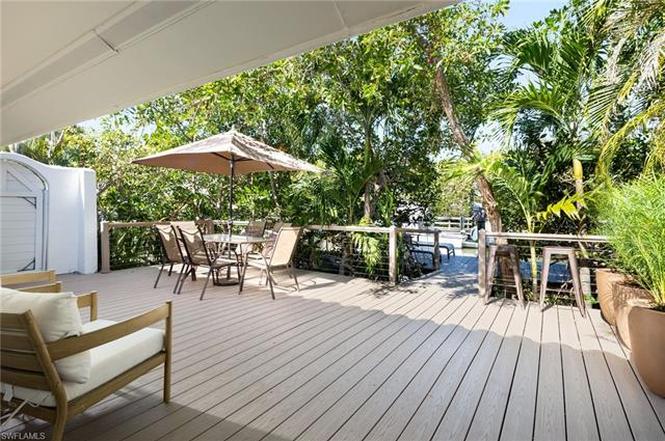
Low HOA dues include flood insurance! Presenting the fully furnished and renovated 08/24 waterfront property you have been waiting for! Rarely available, this property is directly on the water, providing direct gulf access, a large outdoor living space and deeded dock. This property lives extremely private. Peace of mind is assured with impact windows and sliders. The seller has not spared any expense fully renovating this condo from head to toe. Simply bring your boat and enjoy the Naples waterfront lifestyle at a fraction of the cost. This unit is priced to sell and will not last long. Secure your tropical oasis today!
Key facts
- Direct gulf access
- Waterfront property
- Deeded dock
Tags
Property features AI
Finance
- Other: Gulf access with deeded dock (no bridges); Canal waterfront with canal and mangrove views; Canal width approximately 31–80 feet; Irrigation: central; Part of a 12-unit complex (4 units per building), single-floor unit
- HOA & community: Mandatory HOA (community: Boating, Condo/Hotel); Professional management; HOA covers insurance, lawn/land maintenance, exterior pest control, and water; Master HOA fee charged quarterly (total annual recurring fees listed)
Exterior
- Parking: Detached 2-car carport
- Security: Impact resistant windows and doors (storm protection)
- Utilities: Central water; Central sewer; Cable available
- Home design: Residential property; Low-rise (1-3 stories); Corner unit; Rear exposure faces north; Zero lot line
- Construction: Concrete block construction; Stucco exterior finish; Built-up or flat roof; Built in 1970
- Exterior features: Deck; Privacy wall; Impact resistant windows and doors
Interior
- Kitchen: Dishwasher; Disposal; Microwave; Range; Refrigerator/Freezer
- Bedrooms: 2 bedrooms
- Flooring: Tile
- Bathrooms: 2 full bathrooms; Master bath with shower only
- Heating & cooling: Central electric heat; Central electric cooling
- Interior features: Built-in cabinets; High-speed internet available; Smoke detectors; Window coverings; Eat-in kitchen; Open porch/lanai; Turnkey furnished; Efficiency floor plan
- Laundry & utility: Laundry in residence
Neighborhood map
What this means for you Summary
Snapshot
- This is a 2-bed/2.0-bath condo listed at $570k.
Deal economics
- At list price, monthly cash flow is $-876 ($-11k/yr) — negative.
- To cash-flow at today's rent, offer at most $443k (22.2% below list).
- To meet the 1% rule (rent ≥ 1% of price), the offer needs to be $535k (6.1% below list).
- Recommended offer: $443k (22.2% below list) — sets the bar for cash-flow.
Location & tenants
- Location reads 80/100 on livability (#126 in FL, #1,903 nationally) — a professional / high-income tenant draw. Strengths: crime A+, amenities A+, employment A+; Watch: commute D+, cost of living F.
- Collier (suburban): math 60% / reading 56% proficiency, ranked #16 of 73 in FL (top 22%) — acceptable for families but not a draw, mixed tenant base, ~2y average lease.
- Zoned schools: Lake Park Elementary School (math 76% / reading 77%, grade A, #185 of 2,144 statewide, top 9%, 502 students, 39% FRL); Gulfview Middle School (math 78% / reading 68%, grade A, #44 of 571 statewide, top 8%, 582 students, 40% FRL); Naples High School (math 47% / reading 52%, grade D, #179 of 667 statewide, top 29%, 1,719 students, 39% FRL) — zoned schools average 39% FRL vs 55% district-wide (16 pts lower); this property's tenant base skews higher-income than the district average.
- Market conditions: Rents rising fast (+8.8%/yr); 616 active listings in the ZIP; 40 comparable units currently listed for rent nearby; rentals at typical pace (median 23d on market — plan ~3-4 weeks tenant-placement turnaround); high-income renter base; 3,520 units permitted in Collier County in 2024 (959 in 5+ unit buildings).
- At $5,350/mo this rent would consume 49% of the median local household income ($131k/yr) (locally 333% of renters already pay >50% of income on rent) — very limited rent-growth headroom before tenants either downsize or default.
Forward outlook
- In year one you build about $27k of equity ($4k loan paydown + $23k appreciation (4.1% local appreciation)).
- Collier County population projected at +30% by 2050 — long-run rental-demand tailwind backs the buy-and-hold thesis.
- By year 2, paydown + projected appreciation supports a ~$44k cash-out refi (75% LTV) — recoverable capital for the next deal without selling this one.
Negotiation context
- It's been on market 143 days — a 12% lower offer ($502k) is reasonable based on typical stale-listing flexibility.
- 9 sale attempts since 15y ago with the ask held roughly flat each time — persistent listings suggest the price (not the market) is what's stuck; bring a comps-based counter.
- Current owner paid $290k; list at $570k implies a 97% gain — meaningful room to come down on a strong offer.
Risks & watch-outs
- Watch-outs: flood insurance adds $427/mo.
- Climate carrying-cost: in FEMA flood zone AE (mandatory federal flood insurance); severe wind risk, 99% chance of damaging wind over 30y; extreme-heat days projected 7→28/yr by 2055 (HVAC capex compounding) — expect insurance premiums to compound above CPI over the hold.
Questions for the listing agent
- What do current leases actually rent for vs. the listed asking? Can we see a recent rent roll and the last 12 months of T-12 income?
- It's been on market 143 days. Have you received any prior offers? Is the seller open to a 22% concession, seller financing, or rate buy-down credit?
- Built in 1970 — when were the roof, HVAC, electrical panel, plumbing, and water heater last replaced?
- What's the actual annual flood-insurance premium (NFIP or private), and is the property in a SFHA with mandatory coverage?
- What does the HOA fee cover, when was the last increase, and are there any pending special assessments or reserve-fund shortfalls?
- Any open or pending special assessments — roof, HVAC, plumbing, elevator, façade? What's the per-unit balance and payoff schedule, and is the seller paying it off at close or rolling it to the buyer?
- Why hasn't it sold? Are there any deal-killer items the seller is aware of (foundation, flood, title, zoning, code violations)?
- Is there a deadline driving the sale (1031 exchange, divorce, estate, relocation)? That informs how much negotiation room exists.
- Schools are B-rated — typically a magnet for longer-tenancy family renters. What's the average tenant stay here, and is there a school-zone premium baked into asking?
- The area grade is low — what's the realistic commute time and amenity access for the typical tenant pool here? Any planned neighborhood developments (good or bad) we should know about?
- What's the average days-on-market for RENTAL listings here right now (not sales)? A rising rental-DOM trend means longer vacancies and softer asking-rent achievability than the comps imply.
- What's the recent tenant-quality profile in this submarket — average credit score on applications, eviction rate, late-payment / NSF rate, and stable-employment percentage? A property-management company in the area should have these aggregated.
- How much new apartment / multifamily construction is in the pipeline within 1–3 miles? Heavy new supply (>2% of stock underway) typically softens rents 12–24 months out; light construction supports rent growth.
Investment metrics
- 1% rule
- 0.94% ✗
- Cap rate
- 5.35%
- Cash-on-cash
- -3.38%
- DSCR
- 0.85
- GRM
- 8.9
CMA / ARV
No comps found within radius.
Projected returns pro-forma
4.08% appreciation · 8.0% rent growth · sell at horizon
- IRR
- 7.5%
- Equity multiple
- 1.47×
- Total profit
- $75,296
- Equity at exit
- $291,784
- IRR
- 12.4%
- Equity multiple
- 3.26×
- Total profit
- $360,748
- Equity at exit
- $479,473
Cash invested: $159,600 (down + closing). Projections, not guarantees.
Landlord ↔ Tenant lean methodology
- Overall (STATE)
- 87 Strongly Landlord-Friendly
- State Florida
- 87 Strongly Landlord-Friendly · R+3
- County
- — inherits STATE
- City
- — inherits STATE
ZIP-level market 34102
- Home prices YoY
- 1.3%
- Rents YoY
- 8.8%
- Active inventory
- 616
- Price-to-rent
- 8.9×
Monthly cashflow live
- Estimated rent
- $5,350 high interval (Pro) →
- Mortgage (P&I)
- −$2,989
- Tax est. 1.5%
- −$712 /mo · $8,550/yr
- Insurance
- −$238
- Flood insurance flood zone
- −$427 /mo · $5,118/yr
- HOA
- −$737
- Vacancy / Maint / Mgmt
- −$1,124
- Net cashflow
- $-876
Break-even live
Sensitivity live
| Price | -10% $-482 | -5% $-679 | +0% $-876 | +5% $-1,073 | +10% $-1,270 |
|---|---|---|---|---|---|
| Rent | -10% $-1,299 | -5% $-1,087 | +0% $-876 | +5% $-665 | +10% $-453 |
| Rate | -1.0pp $-589 | -0.5pp $-731 | base $-876 | +0.5pp $-1,024 | +1.0pp $-1,174 |
UW: 25.0% down · 7.5% · 30yr · 1.5% tax · 5.0% vac · 8.0% maint · 8.0% mgmt
Financing live
Cash to close
- Down payment
- $142,500
- Closing costs
- $17,100
- Reserves months
- —
- Total cash needed
- —
Loan-product check · same deal, 3 products live
Conventional
25% down · 7.5% · 30yr
- Down + closing
- —
- Monthly P&I
- —
- Monthly cashflow
- —
- DSCR
- —
- Eligible?
- —
Personal DTI + credit; lowest rate.
DSCR
20% down · 8.5% · 30yr
- Down + closing
- —
- Monthly P&I
- —
- Monthly cashflow
- —
- DSCR
- —
- Eligible?
- —
No personal income docs; deal must DSCR.
Hard money
10% down · 12.0% · 12mo
- Down + closing
- —
- Monthly P&I
- —
- Monthly cashflow
- —
- DSCR
- —
- Eligible?
- —
Short-term bridge; refi at stabilization.
Rent comps 40 comps
| Address | Beds | Baths | Sqft | Rent | $/sqft | DOM | Units | Dist |
|---|---|---|---|---|---|---|---|---|
| 1435 Curlew Ave #1 Naples, FL | 2.0 | 2.0 | 975 | $2,850 | $2.92 | 23d | 1 | 0.09mi |
| 1435 Curlew Ave #1 Naples, FL | 2.0 | 2.0 | 975 | $2,850 | $2.92 | 25d | 1 | 0.09mi |
| 1395 Curlew Ave Unit 4-3 Naples, FL | 2.0 | 2.0 | 975 | $7,000 | $7.18 | 25d | 1 | 0.13mi |
| 803 River Point Dr Unit 201B Naples, FL | 1.0 | 1.0 | 715 | $2,300 | $3.22 | 25d | 1 | 0.22mi |
| 805 River Point Dr Unit 307C Naples, FL | 1.0 | 1.0 | 816 | $2,700 | $3.31 | 25d | 1 | 0.23mi |
| 801 River Point Dr Unit 303A Naples, FL | 1.0 | 1.0 | 815 | $5,000 | $6.13 | 23d | 1 | 0.25mi |
| 1950 Mayfair ST Unit 817 Naples, FL | 1.0 | 1.0 | 710 | $3,295 | $4.64 | 15d | 1 | 0.28mi |
| 1950 Mayfair ST Unit 901 Naples, FL | 2.0 | 2.0 | 1025 | $4,560 | $4.45 | 15d | 1 | 0.28mi |
| 1950 Mayfair ST Unit 1027 Naples, FL | 1.0 | 1.0 | 888 | $3,525 | $3.97 | 15d | 1 | 0.28mi |
| 1950 Mayfair ST Unit 921 Naples, FL | 1.0 | 1.0 | 710 | $3,420 | $4.82 | 15d | 1 | 0.28mi |
| 1950 Mayfair ST Unit 1021 Naples, FL | 1.0 | 1.0 | 710 | $3,520 | $4.96 | 15d | 1 | 0.28mi |
| 1950 Mayfair ST Unit 802 Naples, FL | 1.0 | 1.0 | 710 | $3,355 | $4.73 | 15d | 1 | 0.28mi |
| 1950 Mayfair ST Unit 716 Naples, FL | 1.0 | 1.0 | 710 | $3,330 | $4.69 | 15d | 1 | 0.28mi |
| 1155 Sandpiper St Naples, FL | 2.0 | 2.0 | 1062 | $4,050 | $3.81 | 25d | 2 | 0.30mi |
| 1155 Sandpiper St Naples, FL | 2.0 | 2.0 | 1062 | $3,950 | $3.72 | 23d | 3 | 0.30mi |
| 1555 Blue Point Ave Unit 3 Naples, FL | 2.0 | 2.0 | 1025 | $1,745 | $1.70 | 15d | 1 | 0.31mi |
| 1950 Mayfair St Naples, FL | 3.0 | 1.0–3.5 | 1514 | $8,752 | $5.78 | 15d | 109 | 0.31mi |
| 1686 Blue Point Ave Naples, FL | 2.0 | 2.0 | 1057 | $5,500 | $5.20 | 15d | 2 | 0.36mi |
| 1751 Smugglers Cv Unit 2 1 Naples, FL | 2.0 | 1.0 | 800 | $1,995 | $2.49 | 15d | 1 | 0.37mi |
| 1535 Chesapeake Ave Unit A2 Naples, FL | 2.0 | 2.0 | 1080 | $2,000 | $1.85 | 25d | 1 | 0.38mi |
| 1605 Chesapeake Ave #2 Naples, FL | 2.0 | 1.0 | 850 | $2,300 | $2.71 | 25d | 1 | 0.39mi |
| 1100 8th Ave S Naples, FL | 2.0 | 2.0 | 1218 | $9,000 | $7.39 | 15d | 5 | 0.43mi |
| 1360 Chesapeake Ave Unit 1372 Naples, FL | 1.0 | 1.0 | 600 | $1,850 | $3.08 | 25d | 1 | 0.44mi |
| 450 Bayfront Pl Naples, FL | 1.0–3.0 | 1.0–2.5 | 1324 | $8,750 | $6.61 | 25d | 6 | 0.49mi |
| 2134 Palm St Naples, FL | 1.0 | 1.0 | 600 | $7,500 | $12.50 | 25d | 1 | 0.49mi |
| 12 Knights Bridge Rd Unit A32 Naples, FL | 2.0 | 2.0 | 1095 | $3,200 | $2.92 | 23d | 1 | 0.49mi |
| 410 Bayfront Pl Naples, FL | 1.0–3.0 | 1.0–2.0 | 1242 | $7,875 | $6.34 | 25d | 6 | 0.50mi |
| 980 7th Ave S Naples, FL | 1.0 | 1.0 | 540 | $7,500 | $13.89 | 25d | 2 | 0.53mi |
| 950 7th Ave S #23 Naples, FL | 1.0 | 1.0 | 631 | $3,250 | $5.15 | 15d | 1 | 0.54mi |
| 1549 Sandpiper St #36 Naples, FL | 2.0 | 2.0 | 1073 | $2,195 | $2.05 | 25d | 1 | 0.56mi |
| 960 7th St S #103 Naples, FL | 1.0 | 1.0 | 534 | $5,000 | $9.36 | 25d | 1 | 0.76mi |
| 3001 Sandpiper Bay Cir Unit B106 Naples, FL | 2.0 | 2.0 | 1100 | $1,950 | $1.77 | 15d | 1 | 0.80mi |
| 636 Broad Ave S Unit 1259386P Naples, FL | 2.0 | 2.0 | 882 | $4,307 | $4.88 | 15d | 1 | 0.82mi |
| 609 12th Ave S #609 Naples, FL | 2.0 | 2.0 | 860 | $8,000 | $9.30 | 25d | 1 | 0.84mi |
| 2750 Manorca Ave Unit A Naples, FL | 2.0 | 1.0 | 840 | $2,800 | $3.33 | 15d | 1 | 0.87mi |
| 3062 Sandpiper Bay Cir Naples, FL | 2.0 | 2.0 | 1150 | $4,250 | $3.70 | 25d | 2 | 0.87mi |
| 3032 Sandpiper Bay Cir Naples, FL | 2.0 | 2.0 | 1150 | $4,100 | $3.57 | 25d | 2 | 0.88mi |
| 101 8th St S Naples, FL | 1.0 | 1.0–2.0 | 940 | $12,600 | $13.40 | 15d | 4 | 0.90mi |
| 101 8th St S Naples, FL | 1.0 | 1.0–2.0 | 940 | $12,600 | $13.40 | 25d | 4 | 0.90mi |
| 546 Broad Ave S #546 Naples, FL | 2.0 | 2.0 | 890 | $4,800 | $5.39 | 25d | 1 | 0.91mi |
HOA detail condo
- Monthly dues
- $737 · $8,844/yr
- Likely covers
- water
- Assessments
- None detected in remarks — confirm with the listing agent.
Listing history 35 events
-
2026-06-21days on market $570,000 Active 143 DOM
-
2026-06-18days on market $570,000 Active 140 DOM
-
2026-06-17days on market $570,000 Active 139 DOM
-
2026-06-16days on market $570,000 Active 138 DOM
-
2026-06-15days on market $570,000 Active 137 DOM
-
2026-06-14days on market $570,000 Active 135 DOM
-
2026-06-10days on market $570,000 Active 132 DOM
-
2026-06-09days on market $570,000 Active 131 DOM
-
2026-06-08days on market $570,000 Active 130 DOM
-
2026-06-07days on market $570,000 Active 129 DOM
-
2026-06-03days on market $570,000 Active 125 DOM
-
2026-06-02days on market $570,000 Active 124 DOM
-
2026-06-01days on market $570,000 Active 123 DOM
-
2026-05-31days on market $570,000 Active 122 DOM
-
2026-05-30days on market $570,000 Active 121 DOM
-
2026-03-12price $570,000
-
2026-01-29$595,000 Active
-
2025-05-30historical
-
2025-02-04price $749,000
-
2024-11-07$795,000 Active
-
2021-02-03historical
-
2021-01-22status Active
-
2021-01-05status Pending With Contingencies
-
2020-12-30$365,000 Active
-
2015-03-19price $269,000
-
2015-03-16soldstatus $290,000
-
2014-09-09$290,000
-
2014-09-08historical
-
2014-03-07$269,000
-
2014-02-28historical
-
2014-02-07$269,000
-
2011-11-17historical
-
2011-09-27$150,000
-
2011-09-26soldstatus $120,000
-
2011-06-04$129,900
ⓘ Source: listings_history table (triggers on properties + properties_extension) + one-shot
backfill from property_details.listing_events for pre-trigger history.
Climate risk First Street
- Flood 9/10 Extreme FEMA zone AE · 99% chance over 30 yrs
- Wildfire 3/10 Moderate
- Heat 10/10 Extreme 7 d/yr ≥107°F today · 28 d/yr by 30 yrs out
- Wind 10/10 Extreme 99% chance of damaging wind over 30 yrs
- Air quality 3/10 Moderate 3 unhealthy d/yr today · 3 by 30 yrs out
Nearby sold comps map
Loading sold comps map…
Walkable amenities ~0.75 mi
Loading nearby amenities…
Taxation est. · year 1
- Rental income
- $64,202
- − Mortgage interest
- −$31,929
- − Property taxes
- −$8,550
- − Insurance
- −$7,969
- − Repairs & maintenance
- −$5,136
- − Management
- −$5,136
- − HOA
- −$8,844
- − Depreciation
- −$16,582
- Taxable loss
- −$19,944
- Est. tax savings @ 24.0%
- +$4,787
- After-tax cash flow
- $-5,726/yr
For passive investors: Depreciation is non-cash, so a rental often shows a tax loss while cash-flowing — sheltering income. Rental losses are passive: they offset passive income freely, and up to $25,000/yr can offset ordinary (W-2) income if you actively participate and your MAGI is under $100k (phasing out to $0 by $150k); unused losses carry forward. On sale, claimed depreciation is recaptured at up to 25%, and gains may owe capital-gains tax (a 1031 exchange can defer both). Figures are a year-1 estimate at your 24.0% rate — not tax advice; consult a CPA.
Schools (NCES district)
- District
- Collier
- NCES district ID
- 1200330
- Math proficiency
- 60% ▼ -4.00%
- Reading proficiency
- 56% ▼ -2.00%
- Median HH income
- $58,275
- Composite
- 50.23/100
- National rank
- #1892
- State rank
- #16 of 73 in FL
Livability — Naples
- Score
- 80/100
- State rank
- #126
- US rank
- #1903
Category grades
Schools grade is shown separately in the Schools card above.
Census & demographics
- Census place
- Naples, FL
- County
- Collier County · 396,295 people
- City population
- 344,941
- Metro
- Naples-Marco Island, FL
- Population (ZIP)
- 11,179
- Household income
- $130,929
- Rent vs Own
- Severe rent burden
- 333.0
Population outlook (Collier County) Hauer SSP2
- Today (2025)
- 420,858 people
- By 2030
- 450,054 · +6.9%
- By 2040
- 502,232 · +19.3%
- By 2050
- 544,932 · +29.5%
- By 2075
- 627,203 · +49.0%
- By 2100
- 659,015 · +56.6%
Race, ethnicity, and origin ACS 2023
- Neighborhood character
- Predominantly White (79%)
- Race & ethnicity
- White 79% Hispanic / Latino 9% Two or more races 8% Black 8% Asian 1%
- Hispanic origin (detail)
- Cuban 6%
- Common ancestry
- Hispanic 4% Lithuanian 4% Romanian 4%
- Foreign-born
- 17% · Canada, China
- Languages at home
- 87% English-only · Spanish 7% French/Haitian/Cajun 4% German/W. Germanic 1%
Political lean MEDSL · Collier
- 2024 margin
- Solid R (+33.1) · D 33.1% · R 66.2%
- 2008→2024 swing
- -10.6pp toward R · 2008: -22.5pp · 2024: -33.1pp
- All cycles
- 2024: R+33.1 2020: R+24.7 2016: R+26.0 2012: R+30.1 2008: R+22.5
Not yet ingested
- Civics
- —
Market trends
- HPI YoY
- ▲ 4.08%
- Current HPI
- 328.2755
- Rent YoY
- ▲ 8.75%
- Metro
- Naples-Marco Island, FL
- State GDP YoY
- ▲ 3.28%
- F500 in state
- 36
Industry mix (Fortune 500 HQ in FL)
| Industry | F500 HQs | Revenue |
|---|---|---|
| Industrial Technology | 2 | $29B |
|
||
| Insurance | 2 | $17B |
|
||
| Retail | 1 | $60B |
|
||
| Technology Distribution | 1 | $58B |
|
||
| Homebuilding | 1 | $35B |
|
||
| Technology Manufacturing | 1 | $35B |
|
||
Price history
+338.8% since first listed20 events — show timeline
- 2026-03-12 Price Changed $570,000 NAPLESMLS
- 2026-01-29 Listed $595,000 NAPLESMLS
- 2025-05-30 Listing Removed — NAPLESMLS
- 2025-02-04 Price Changed $749,000 NAPLESMLS
- 2024-11-07 Listed $795,000 NAPLESMLS
- 2021-02-03 Listing Removed — NAPLESMLS
- 2021-01-22 Relisted — NAPLESMLS
- 2021-01-05 Pending — NAPLESMLS
- 2020-12-30 Listed $365,000 NAPLESMLS
- 2015-03-19 Price Changed $269,000 NAPLESMLS
- 2015-03-16 Sold (MLS) $290,000 NAPLESMLS
- 2014-09-09 Listed $290,000 NAPLESMLS
- 2014-09-08 Listing Removed — NAPLESMLS
- 2014-03-07 Listed $269,000 NAPLESMLS
- 2014-02-28 Listing Removed — NAPLESMLS
- 2014-02-07 Listed $269,000 NAPLESMLS
- 2011-11-17 Listing Removed — NAPLESMLS
- 2011-09-27 Listed $150,000 NAPLESMLS
- 2011-09-26 Sold (MLS) $120,000 NAPLESMLS
- 2011-06-04 Listed $129,900 NAPLESMLS
Cash-flow waterfall
monthlySold comps — $/sqft
last 12 mo · ≤1 miLoading sold comps…