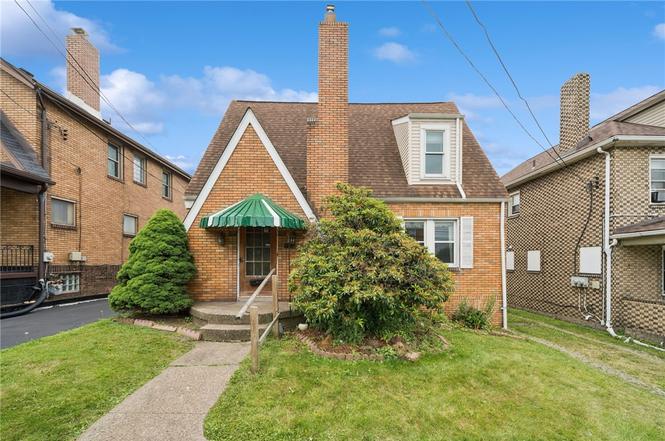
1210 Lincoln Hwy · East McKeesport, PA
Flood risk 1/10 · Minimal
- FEMA flood zone
- X (unshaded)
- Chance of flooding over 30 yrs
- 0.0%
- Est. flood insurance / yr
- $473 – $860
Fire risk 1/10 · Minimal
- Est. fire insurance / yr
- $511 – $949
Heat risk 3/10 · Minor
- Hot days now (above 96°F)
- 7 days/yr
- Hot days in 30 yrs
- 17 days/yr
Wind risk 2/10 · Minimal
- Chance of severe wind over 30 yrs
- —
Air-quality risk 4/10 · Minor
- Unhealthy air days now
- 5 days/yr
- Unhealthy air days in 30 yrs
- 7 days/yr
Risk factors via First Street. Map © Google.
Why this score? — see what drove the B grade
The composite is a weighted blend of 9 inputs, each scored 0–100. Each bar is that input's sub-score; the figure is the points it added to the 100-point composite (weight × sub-score).
- Cash flow +30.0/30.0
- ARV discount +15.0/15.0
- DSCR +10.0/10.0
- 1% rule +9.6/10.0
- Livability +3.5/5.0
- Rent growth +2.5/5.0
- Condition / age +2.5/5.0
- Schools +1.8/10.0
- Appreciation +0.0/10.0
$85,000
🖨 Deal sheet (PDF) 📄 Offer letter ✓ Due diligence
Listing remarks
Opportunity awaits in this spacious 2 bedroom brick Cape Cod! Featuring solid bones, generous living spaces, and vintage appeal, this home is ready for its next chapter. While it could benefit from some TLC and updates, the attractive price point makes it an excellent option for investors or buyers looking to build equity. Conveniently located near shopping, dining, and major commuter routes, this property offers both value and potential. Whether you're looking to expand your investment portfolio or create a home tailored to your vision, this is one you won't want to miss!
Key facts
- Brick cape cod
- Vintage appeal
- 4,599 sq ft lot
Tags
Property features AI
Exterior
- Parking: Detached garage (1 parking space total)
- Utilities: Public water; Public sewer
- Home design: Resale property
- Construction: Brick construction; Asphalt roof
- Exterior features: Small lot (approximately 0.106 acre)
Interior
- Kitchen: Kitchen on main level (13x9); Stove; Dishwasher; Some gas appliances
- Bedrooms: Bedroom on upper level (14x13); Additional upper-level bedroom (15x11)
- Flooring: Hardwood; Tile
- Bathrooms: One full bathroom; One half bathroom
- Heating & cooling: Forced air heating; Gas heating
- Interior features: Partially finished basement with interior entry; Decorative fireplace
- Laundry & utility: Washer; Dryer
Neighborhood map
What this means for you Summary
Snapshot
- This is a 3-bed/1.5-bath single-family listed at $85k.
Deal economics
- At list price, monthly cash flow is $352 ($4k/yr) — positive.
- The deal already cash-flows at list — no discount required.
- Meets the 1% rule at list price ($1k rent vs $85k).
- Cap rate 11.3% vs local median 6.2% in East McKeesport — top-decile yield for the area; either an underpriced asset or a hidden risk that comps aren't pricing in. Stress-test before assuming the spread holds.
Location & tenants
- Location reads 70/100 on livability (#752 in PA) — a middle-class / working-renter tenant base. Strengths: cost of living A+, housing A+, crime B; Watch: employment D+, amenities F, commute F.
- East Allegheny SD (suburban): math 14% / reading 30% proficiency, ranked #485 of 539 in PA (top 90%) — low school quality limits family demand, transient renter base, plan for 1-2y turnover.
- Market conditions: 31 active listings in the ZIP; 9 comparable units currently listed for rent nearby; rentals at typical pace (median 19d on market — plan ~3-4 weeks tenant-placement turnaround); 2,996 units permitted in Allegheny County in 2024 (1,588 in 5+ unit buildings).
Forward outlook
- Local home prices are declining (-3.0%/yr); year-one equity from $588 of loan paydown is wiped out by about $3k of value loss. Plan a longer hold.
- At projected returns (-3.0% appreciation + 3.0% rent growth), your $24k cash investment doubles in ~7 years — after that, you're playing with house money.
Negotiation context
- Only 11 days on market — expect competitive offers; lowballing is unlikely to land.
Risks & watch-outs
- Watch-outs: built in 1930 — expect roof / HVAC / electrical / plumbing capex.
Questions for the listing agent
- Built in 1930 — when were the roof, HVAC, electrical panel, plumbing, and water heater last replaced?
- Is there a deadline driving the sale (1031 exchange, divorce, estate, relocation)? That informs how much negotiation room exists.
- What's the average days-on-market for RENTAL listings here right now (not sales)? A rising rental-DOM trend means longer vacancies and softer asking-rent achievability than the comps imply.
- What's the recent tenant-quality profile in this submarket — average credit score on applications, eviction rate, late-payment / NSF rate, and stable-employment percentage? A property-management company in the area should have these aggregated.
- How much new for-sale + rental construction is in the pipeline within 1–3 miles? Heavy new supply typically softens prices + rents 12–24 months out; constrained supply supports both.
Investment metrics
- 1% rule
- 1.46% ✓
- Cap rate
- 11.27%
- Cash-on-cash
- 17.77%
- DSCR
- 1.79
- GRM
- 5.7
CMA / ARV
- ARV (on-the-fly)
- $163,748
- Comps found
- 12
Show comp detail 12 sales within ~0.75 mi
| Address | Dist | Beds/Ba | Sqft | Sold | Price | $/sf | Match |
|---|---|---|---|---|---|---|---|
| 300 Taylor St | 0.24mi | 3/1.5 | 1,120 (-8%) | 5mo | $167,000 | $149 | 71 |
| 498 Taylor | 0.30mi | 3/1.5 | 1,068 (-13%) | 1mo | $220,000 | $206 | 64 |
| 821 Clara St | 0.29mi | 3/2.0 | 1,346 (+10%) | 5mo | $162,000 | $120 | 63 |
| 1034 Park Ave | 0.54mi | 4/3.0 (+1) | 1,236 (+1%) | 0mo | $154,900 | $125 | 61 |
| 635 Larimer Ave | 0.42mi | 3/2.0 | 1,100 (-10%) | 4mo | $165,000 | $150 | 58 |
| 111 Arlene Ave | 0.55mi | 4/1.5 (+1) | 1,318 (+8%) | 0mo | $90,000 | $68 | 56 |
| 257 Mary Ellen Dr | 0.36mi | 4/2.0 (+1) | 1,116 (-9%) | 8mo | $150,000 | $134 | 55 |
| 633 3rd St | 0.55mi | 3/1.5 | 1,072 (-12%) | 2mo | $175,000 | $163 | 52 |
| 526 3rd St | 0.47mi | 3/2.5 | 1,358 (+11%) | 8mo | $185,000 | $136 | 49 |
| 411 Woodland Rd | 0.60mi | 4/1.0 (+1) | 1,323 (+8%) | 3mo | $115,000 | $87 | 49 |
| 303 3rd St | 0.44mi | 2/1.0 (-1) | 1,378 (+13%) | 8mo | $125,000 | $91 | 45 |
| 519 Ocala St | 0.66mi | 4/1.0 (+1) | 1,050 (-14%) | 1mo | $120,000 | $114 | 38 |
Match score weights: distance 35% · size 25% · config 20% · recency 20%. Top-matched comps best support the ARV.
Projected returns pro-forma
-3.0% appreciation · 3.0% rent growth · sell at horizon
- IRR
- 9.3%
- Equity multiple
- 1.37×
- Total profit
- $8,720
- Equity at exit
- $12,674
- IRR
- 18.5%
- Equity multiple
- 2.54×
- Total profit
- $36,679
- Equity at exit
- $7,349
Cash invested: $23,800 (down + closing). Projections, not guarantees.
Landlord ↔ Tenant lean methodology
- Overall (STATE)
- 62 Landlord-Friendly
- State Pennsylvania
- 62 Landlord-Friendly · EVEN
- County
- — inherits STATE
- City
- — inherits STATE
ZIP-level market 15137
- Home prices YoY
- -9.2%
- Active inventory
- 31
- Price-to-rent
- 5.7×
Monthly cashflow live
- Estimated rent
- $1,240 high interval (Pro) →
- Mortgage (P&I)
- −$446
- Tax from tax record
- −$146 /mo · $1,756/yr
- Insurance
- −$35
- HOA
- −$0
- Vacancy / Maint / Mgmt
- −$260
- Net cashflow
- $352
Break-even live
Sensitivity live
| Price | -10% $401 | -5% $377 | +0% $352 | +5% $328 | +10% $304 |
|---|---|---|---|---|---|
| Rent | -10% $255 | -5% $303 | +0% $352 | +5% $401 | +10% $450 |
| Rate | -1.0pp $395 | -0.5pp $374 | base $352 | +0.5pp $330 | +1.0pp $308 |
UW: 25.0% down · 7.5% · 30yr · 1.5% tax · 5.0% vac · 8.0% maint · 8.0% mgmt
Financing live
Cash to close
- Down payment
- $21,250
- Closing costs
- $2,550
- Reserves months
- —
- Total cash needed
- —
Loan-product check · same deal, 3 products live
Conventional
25% down · 7.5% · 30yr
- Down + closing
- —
- Monthly P&I
- —
- Monthly cashflow
- —
- DSCR
- —
- Eligible?
- —
Personal DTI + credit; lowest rate.
DSCR
20% down · 8.5% · 30yr
- Down + closing
- —
- Monthly P&I
- —
- Monthly cashflow
- —
- DSCR
- —
- Eligible?
- —
No personal income docs; deal must DSCR.
Hard money
10% down · 12.0% · 12mo
- Down + closing
- —
- Monthly P&I
- —
- Monthly cashflow
- —
- DSCR
- —
- Eligible?
- —
Short-term bridge; refi at stabilization.
Rent comps 9 comps
| Address | Beds | Baths | Sqft | Rent | $/sqft | DOM | Units | Dist |
|---|---|---|---|---|---|---|---|---|
| 569 Woodmont Ave Unit C East McKeesport, PA | 2.0 | 1.0 | 1000 | $1,000 | $1.00 | 18d | 1 | 0.64mi |
| 569 Woodmont Ave Apt B East McKeesport, PA | 2.0 | 1.0 | 1000 | $1,200 | $1.20 | 18d | 1 | 0.64mi |
| 200 Delaware Ave North Versailles, PA | 3.0 | 1.5 | 1470 | $1,450 | $0.99 | 16d | 1 | 0.89mi |
| 175 Dix Dr North Versailles Township, PA | 1.0–2.0 | 1.0 | 691 | $1,155 | $1.67 | 4d | 11 | 1.04mi |
| 215 Grant St Wall, PA | 2.0 | 2.5 | 960 | $750 | $0.78 | 45d | 1 | 1.09mi |
| 210 Westinghouse Ave Unit 210-D Wilmerding, PA | 2.0 | 1.0 | 800 | $999 | $1.25 | 45d | 1 | 1.17mi |
| 210 Westinghouse Ave Unit 210-E Wilmerding, PA | 2.0 | 1.0 | 800 | $999 | $1.25 | 16d | 1 | 1.17mi |
| 165 State St Wilmerding, PA | 3.0 | 1.0 | 1100 | $995 | $0.90 | 18d | 1 | 1.33mi |
| 1806 Greensburg Ave North Versailles Township, PA | 1.0–2.0 | 1.0 | 750 | $1,015 | $1.35 | 3d | 10 | 1.38mi |
Listing history 7 events
-
2026-06-21days on market $85,000 Active 11 DOM
-
2026-06-18days on market $85,000 Active 8 DOM
-
2026-06-17days on market $85,000 Active 7 DOM
-
2026-06-16days on market $85,000 Active 6 DOM
-
2026-06-15days on market $85,000 Active 5 DOM
-
2026-06-13remarks 580-char remark
-
2026-06-13$85,000 Active 3 DOM
ⓘ Source: listings_history table (triggers on properties + properties_extension) + one-shot
backfill from property_details.listing_events for pre-trigger history.
Tax reassessment forecast PA · Partial reset (capped growth)
- Current annual tax
- $1,756 · $146/mo
- Projected year-2 tax
- $1,756 · $146/mo
- Expected delta
- $0/yr ($0/mo · 0.0%)
ⓘ Screening estimate from a state-policy table — verify with the county assessor before closing.
Climate risk First Street
- Flood 1/10 Low FEMA zone X (unshaded) · 0% chance over 30 yrs
- Wildfire 1/10 Low
- Heat 3/10 Moderate 7 d/yr ≥96°F today · 17 d/yr by 30 yrs out
- Wind 2/10 Low
- Air quality 4/10 Moderate 5 unhealthy d/yr today · 7 by 30 yrs out
Nearby sold comps map
Loading sold comps map…
Walkable amenities ~0.75 mi
Loading nearby amenities…
Taxation est. · year 1
- Rental income
- $14,886
- − Mortgage interest
- −$4,761
- − Property taxes
- −$1,756
- − Insurance
- −$425
- − Repairs & maintenance
- −$1,191
- − Management
- −$1,191
- − Depreciation
- −$2,473
- Taxable income
- $3,089
- Est. tax owed @ 24.0%
- −$741
- After-tax cash flow
- $3,489/yr
For passive investors: Depreciation is non-cash, so a rental often shows a tax loss while cash-flowing — sheltering income. Rental losses are passive: they offset passive income freely, and up to $25,000/yr can offset ordinary (W-2) income if you actively participate and your MAGI is under $100k (phasing out to $0 by $150k); unused losses carry forward. On sale, claimed depreciation is recaptured at up to 25%, and gains may owe capital-gains tax (a 1031 exchange can defer both). Figures are a year-1 estimate at your 24.0% rate — not tax advice; consult a CPA.
Schools (NCES district)
- District
- East Allegheny SD
- NCES district ID
- 4208060
- Math proficiency
- 14% ▼ -13.00%
- Reading proficiency
- 30% ▼ -19.00%
- Median HH income
- $38,748
- Composite
- 18.44/100
- National rank
- #8930
- State rank
- #485 of 539 in PA
Livability — East McKeesport
- Score
- 70/100
- State rank
- #752
- US rank
- #7504
Category grades
Schools grade is shown separately in the Schools card above.
Census & demographics
- County
- Allegheny County · 1,022,028 people
- City population
- 2,063
- Metro
- Pittsburgh, PA
- Population (ZIP)
- 10,043
- Household income
- $53,632
- Rent vs Own
- Severe rent burden
- 393.0
Population outlook (Allegheny County) Hauer SSP2
- Today (2025)
- 1,250,282 people
- By 2030
- 1,256,482 · +0.5%
- By 2040
- 1,256,318 · +0.5%
- By 2050
- 1,244,169 · -0.5%
- By 2075
- 1,197,693 · -4.2%
- By 2100
- 1,093,187 · -12.6%
Race, ethnicity, and origin ACS 2023
- Neighborhood character
- Predominantly White (77%)
- Race & ethnicity
- White 77% Black 18% Two or more races 2% Asian 2%
- Common ancestry
- Romanian 6% Slovak 3% Lithuanian 1%
- Foreign-born
- 2% · Vietnam
- Languages at home
- 97% English-only · Vietnamese 2%
Political lean MEDSL · Allegheny
- 2024 margin
- Strong D (+20.3) · D 59.7% · R 39.4%
- 2008→2024 swing
- +4.8pp toward D · 2008: 15.5pp · 2024: 20.3pp
- All cycles
- 2024: D+20.3 2020: D+20.4 2016: D+16.4 2012: D+14.4 2008: D+15.5
Not yet ingested
- Civics
- —
Market trends
- HPI YoY
- ▼ -25.43%
- Current HPI
- 252.4089
- Rent YoY
- —
- Metro
- Pittsburgh, PA
- State GDP YoY
- ▲ 1.68%
- F500 in state
- 34
Industry mix (Fortune 500 HQ in PA)
| Industry | F500 HQs | Revenue |
|---|---|---|
| Healthcare | 2 | $309B |
|
||
| Insurance | 2 | $27B |
|
||
| Telecommunications / Media | 1 | $124B |
|
||
| Industrial Distribution | 1 | $22B |
|
||
| Financial Services | 1 | $20B |
|
||
| Chemicals / Materials | 1 | $18B |
|
||
Price history
1 event — show timeline
- 2026-06-10 Listed $85,000 West Penn MLS
Property tax history
-0.2%/yrLatest (2026): $1,756 · +0.0% YoY. Source: county tax records.
Cash-flow waterfall
monthlySold comps — $/sqft
last 12 mo · ≤1 miLoading sold comps…