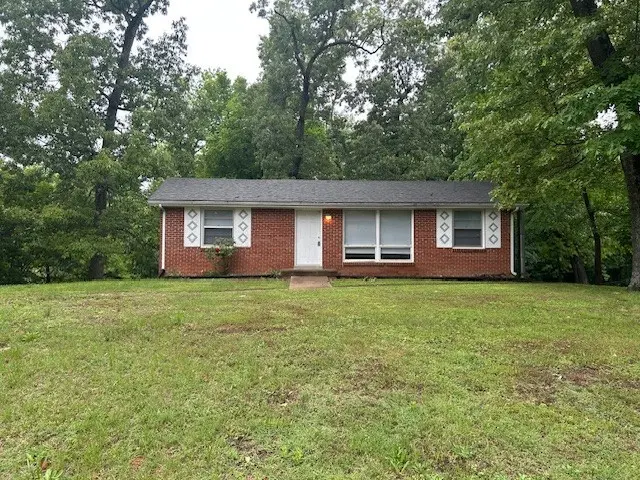
108 Meadowbrook Dr · Clarksville, TN
Flood risk 5/10 · Moderate
- FEMA flood zone
- X (unshaded)
- Chance of flooding over 30 yrs
- 0.24%
- Est. flood insurance / yr
- $473 – $860
Fire risk 3/10 · Minor
- Est. fire insurance / yr
- $949 – $1,763
Heat risk 5/10 · Moderate
- Hot days now (above 107°F)
- 7 days/yr
- Hot days in 30 yrs
- 20 days/yr
Wind risk 4/10 · Minor
- Chance of severe wind over 30 yrs
- 9.0%
Air-quality risk 2/10 · Minimal
- Unhealthy air days now
- 1 days/yr
- Unhealthy air days in 30 yrs
- 1 days/yr
Risk factors via First Street. Map © Google.
Why this score? — see what drove the D+ grade
The composite is a weighted blend of 9 inputs, each scored 0–100. Each bar is that input's sub-score; the figure is the points it added to the 100-point composite (weight × sub-score).
- Cash flow +15.1/30.0
- ARV discount +15.0/15.0
- DSCR +4.6/10.0
- Livability +4.2/5.0
- 1% rule +3.2/10.0
- Rent growth +2.8/5.0
- Schools +2.5/10.0
- Condition / age +2.5/5.0
- Appreciation +0.0/10.0
$160,000
🖨 Deal sheet (PDF) 📄 Offer letter ✓ Due diligence
Listing remarks
3BR, 1 BA, range, refrigerator, central air & heat, unfinished basement w/ 1 car garage, all brick, being sold "AS IS". Outside sewer lines replaced 11-23. galvanized pipe interior, hardwood floors in bedrooms & living room.
Key facts
- Unfinished basement
- Central air & heat
- All brick
Tags
Property features AI
Exterior
- Parking: Side-facing 1-car garage; 1 covered parking space (total 1)
- Security: Smoke detector(s)
- Utilities: Public water; Public sewer; Water available
- Home design: Single family residence; One story
- Construction: Brick construction; Shingle roof; Block foundation; Existing (year built)
- Exterior features: Sloped lot
Interior
- Kitchen: Eat-in kitchen; Electric range; Refrigerator
- Bedrooms: Bedroom 1 (12 x 12); Bedroom 2 (12 x 10); Bedroom 3 (12 x 11)
- Flooring: Wood flooring; Vinyl flooring
- Bathrooms: 1 full bathroom
- Heating & cooling: Central heating; Central air conditioning
- Interior features: Unfinished basement; Smoke detector(s)
- Laundry & utility: Electric dryer hookup
Neighborhood map
What this means for you Summary
Snapshot
- This is a 3-bed/1.0-bath single-family listed at $160k.
Deal economics
- At list price, monthly cash flow is $52 ($625/yr) — positive.
- The deal already cash-flows at list — no discount required.
- To meet the 1% rule (rent ≥ 1% of price), the offer needs to be $132k (17.7% below list).
- Recommended offer: $132k (17.7% below list) — sets the bar for 1% rule.
- Cap rate 6.7% vs local median 3.5% in Clarksville — top-decile yield for the area; either an underpriced asset or a hidden risk that comps aren't pricing in. Stress-test before assuming the spread holds.
Location & tenants
- Location reads 84/100 on livability (#1 in TN, #798 nationally) — a professional / high-income tenant draw. Strengths: amenities A+, commute A+, cost of living A+; Watch: employment C-, crime D+.
- Montgomery County (urban): math 25% / reading 31% proficiency, ranked #65 of 139 in TN (top 47%) — low school quality limits family demand, transient renter base, plan for 1-2y turnover.
- Zoned schools: Kenwood Elementary (math 21% / reading 23%, grade F, #601 of 952 statewide, top 66%, 687 students, 0% FRL); Kenwood Middle (math 9% / reading 15%, grade F, #242 of 333 statewide, top 74%, 1,121 students, 0% FRL); Kenwood High (math 5% / reading 29%, grade F, #225 of 332 statewide, top 69%, 1,291 students, 0% FRL) — zoned schools average 0% FRL vs 40% district-wide (40 pts lower); this property's tenant base skews higher-income than the district average.
- Market conditions: Rents rising (+1.3%/yr); 895 active listings in the ZIP; 40 comparable units currently listed for rent nearby; rentals at typical pace (median 23d on market — plan ~3-4 weeks tenant-placement turnaround); 2,583 units permitted in Montgomery County in 2024 (617 in 5+ unit buildings).
Forward outlook
- Local home prices are declining (-3.0%/yr); year-one equity from $1k of loan paydown is wiped out by about $5k of value loss. Plan a longer hold.
- Montgomery County population projected at +49% by 2050 — long-run rental-demand tailwind backs the buy-and-hold thesis.
Negotiation context
- Only 9 days on market — expect competitive offers; lowballing is unlikely to land.
Risks & watch-outs
- Climate carrying-cost: moderate flood risk; extreme-heat days projected 7→20/yr by 2055 (HVAC capex compounding) — expect insurance premiums to compound above CPI over the hold.
Questions for the listing agent
- Built in 1960 — when were the roof, HVAC, electrical panel, plumbing, and water heater last replaced?
- Is there a deadline driving the sale (1031 exchange, divorce, estate, relocation)? That informs how much negotiation room exists.
- Crime grade is D in this area — have there been break-ins, vandalism, or insurance claims at this property in the last 3 years? What carrier currently insures it and at what premium?
- The area grade is low — what's the realistic commute time and amenity access for the typical tenant pool here? Any planned neighborhood developments (good or bad) we should know about?
- What's the average days-on-market for RENTAL listings here right now (not sales)? A rising rental-DOM trend means longer vacancies and softer asking-rent achievability than the comps imply.
- What's the recent tenant-quality profile in this submarket — average credit score on applications, eviction rate, late-payment / NSF rate, and stable-employment percentage? A property-management company in the area should have these aggregated.
- How much new for-sale + rental construction is in the pipeline within 1–3 miles? Heavy new supply typically softens prices + rents 12–24 months out; constrained supply supports both.
Investment metrics
- 1% rule
- 0.82% ✗
- Cap rate
- 6.68%
- Cash-on-cash
- 1.39%
- DSCR
- 1.06
- GRM
- 10.1
CMA / ARV
- ARV (on-the-fly)
- $208,950
- Comps found
- 12
Show comp detail 12 sales within ~0.75 mi
| Address | Dist | Beds/Ba | Sqft | Sold | Price | $/sf | Match |
|---|---|---|---|---|---|---|---|
| 108 Meadowbrook Dr | 0.00mi | 3/1.0 | 1,050 (0%) | 1mo | $160,000 | $152 | 99 |
| 7 W Bel Air Blvd | 0.45mi | 3/1.5 | 1,078 (+3%) | 6mo | $205,000 | $190 | 67 |
| 15 Lasalle St | 0.60mi | 3/1.0 | 1,032 (-2%) | 3mo | $150,900 | $146 | 66 |
| 25 Charlemagne Blvd | 0.63mi | 3/1.0 | 1,056 (+1%) | 4mo | $203,000 | $192 | 66 |
| 3 Charlemagne Blvd | 0.47mi | 3/1.5 | 1,100 (+5%) | 8mo | $229,900 | $209 | 62 |
| 21 Charlemagne Blvd | 0.58mi | 3/1.0 | 1,008 (-4%) | 9mo | $159,500 | $158 | 59 |
| 157 Monarch Ln | 0.62mi | 3/2.0 | 1,100 (+5%) | 1mo | $225,000 | $205 | 58 |
| 2 Charlemagne Blvd | 0.50mi | 3/2.0 | 1,125 (+7%) | 4mo | $249,900 | $222 | 57 |
| 37 E Bel Air Blvd | 0.31mi | 3/1.0 | 1,176 (+12%) | 10mo | $207,000 | $176 | 57 |
| 117 Monarch Ln | 0.55mi | 3/2.0 | 1,089 (+4%) | 10mo | $220,000 | $202 | 56 |
| 33 Charlemagne Blvd | 0.71mi | 3/1.0 | 1,080 (+3%) | 8mo | $215,000 | $199 | 55 |
| 182 Monarch Ln | 0.70mi | 3/2.0 | 1,092 (+4%) | 5mo | $223,000 | $204 | 53 |
Match score weights: distance 35% · size 25% · config 20% · recency 20%. Top-matched comps best support the ARV.
Projected returns pro-forma
-3.0% appreciation · 1.27% rent growth · sell at horizon
- IRR
- -15.9%
- Equity multiple
- 0.44×
- Total profit
- $-24,916
- Equity at exit
- $23,857
- IRR
- -10.5%
- Equity multiple
- 0.41×
- Total profit
- $-26,570
- Equity at exit
- $13,834
Cash invested: $44,800 (down + closing). Projections, not guarantees.
Landlord ↔ Tenant lean methodology
- Overall (STATE)
- 87 Strongly Landlord-Friendly
- State Tennessee
- 87 Strongly Landlord-Friendly · R+13
- County
- — inherits STATE
- City
- — inherits STATE
ZIP-level market 37042
- Home prices YoY
- -18.2%
- Rents YoY
- 1.3%
- Active inventory
- 895
- Price-to-rent
- 10.1×
Monthly cashflow live
- Estimated rent
- $1,317 high interval (Pro) →
- Mortgage (P&I)
- −$839
- Tax from tax record
- −$83 /mo · $991/yr
- Insurance
- −$67
- HOA
- −$0
- Vacancy / Maint / Mgmt
- −$277
- Net cashflow
- $52
Break-even live
Sensitivity live
| Price | -10% $143 | -5% $97 | +0% $52 | +5% $7 | +10% $-38 |
|---|---|---|---|---|---|
| Rent | -10% $-52 | -5% $0 | +0% $52 | +5% $104 | +10% $156 |
| Rate | -1.0pp $133 | -0.5pp $93 | base $52 | +0.5pp $11 | +1.0pp $-32 |
UW: 25.0% down · 7.5% · 30yr · 1.5% tax · 5.0% vac · 8.0% maint · 8.0% mgmt
Financing live
Cash to close
- Down payment
- $40,000
- Closing costs
- $4,800
- Reserves months
- —
- Total cash needed
- —
Loan-product check · same deal, 3 products live
Conventional
25% down · 7.5% · 30yr
- Down + closing
- —
- Monthly P&I
- —
- Monthly cashflow
- —
- DSCR
- —
- Eligible?
- —
Personal DTI + credit; lowest rate.
DSCR
20% down · 8.5% · 30yr
- Down + closing
- —
- Monthly P&I
- —
- Monthly cashflow
- —
- DSCR
- —
- Eligible?
- —
No personal income docs; deal must DSCR.
Hard money
10% down · 12.0% · 12mo
- Down + closing
- —
- Monthly P&I
- —
- Monthly cashflow
- —
- DSCR
- —
- Eligible?
- —
Short-term bridge; refi at stabilization.
Rent comps 40 comps
| Address | Beds | Baths | Sqft | Rent | $/sqft | DOM | Units | Dist |
|---|---|---|---|---|---|---|---|---|
| 3 Lexington Dr #3 Clarksville, TN | 2.0 | 1.0 | 788 | $850 | $1.08 | 23d | 1 | 0.18mi |
| 137 W Concord Dr Clarksville, TN | 2.0 | 1.0–1.5 | 850 | $972 | $1.14 | 15d | 7 | 0.30mi |
| 4 Gettysburg St Clarksville, TN | 3.0 | 1.5 | 1358 | $1,500 | $1.10 | 15d | 1 | 0.34mi |
| 126 W Concord Dr Clarksville, TN | 2.0 | 1.0 | 865 | $999 | $1.15 | 15d | 2 | 0.34mi |
| 124 Yorktown Rd Clarksville, TN | 3.0 | 1.0 | 1064 | $1,275 | $1.20 | 23d | 1 | 0.45mi |
| 129 Monarch Ln Clarksville, TN | 3.0 | 2.0 | 1120 | $1,381 | $1.23 | 23d | 1 | 0.56mi |
| 134 Monarch Ln Clarksville, TN | 3.0 | 1.5 | 940 | $1,300 | $1.38 | 15d | 1 | 0.60mi |
| 1031 Glenkirk Dr Clarksville, TN | 2.0 | 1.5 | 1146 | $1,395 | $1.22 | 23d | 1 | 0.61mi |
| 1023 Glenkirk Dr Clarksville, TN | 2.0 | 1.5 | 1146 | $1,415 | $1.23 | 23d | 1 | 0.61mi |
| 1024 Glenkirk Dr Clarksville, TN | 2.0 | 1.5 | 1146 | $1,395 | $1.22 | 23d | 1 | 0.61mi |
| 1032 Glenkirk Dr Clarksville, TN | 2.0 | 1.5 | 1146 | $1,395 | $1.22 | 23d | 1 | 0.61mi |
| 153 Monarch Ln Clarksville, TN | 3.0 | 2.0 | 1033 | $1,350 | $1.31 | 23d | 1 | 0.62mi |
| 1040 Glenkirk Dr Unit D Clarksville, TN | 2.0 | 2.5 | 1146 | $1,450 | $1.27 | 23d | 1 | 0.70mi |
| 219 Kirby Dr Clarksville, TN | 3.0 | 1.5 | 1425 | $1,495 | $1.05 | 23d | 1 | 0.70mi |
| 535 Lafayette Rd Unit I2 Clarksville, TN | 3.0 | 1.5 | 1200 | $1,200 | $1.00 | 23d | 1 | 0.70mi |
| 200 Drayton Dr Unit A Clarksville, TN | 2.0 | 2.5 | 1146 | $1,500 | $1.31 | 23d | 1 | 0.71mi |
| 381 Lillie Belle Ln Apt C Clarksville, TN | 2.0 | 1.5 | 780 | $1,125 | $1.44 | 23d | 1 | 0.72mi |
| 208 Drayton Dr Unit F Clarksville, TN | 2.0 | 2.5 | 1146 | $1,295 | $1.13 | 23d | 1 | 0.75mi |
| 212 Drayton Dr Unit E Clarksville, TN | 2.0 | 2.5 | 1146 | $1,650 | $1.44 | 23d | 1 | 0.77mi |
| 420 Lafayette Rd Unit A Clarksville, TN | 3.0 | 1.0 | 1100 | $850 | $0.77 | 23d | 1 | 0.79mi |
| 216 Drayton Dr Clarksville, TN | 2.0 | 2.5 | 1146 | $1,395 | $1.22 | 23d | 1 | 0.80mi |
| 216 Drayton Dr Unit C Clarksville, TN | 2.0 | 1.5 | 1146 | $1,395 | $1.22 | 23d | 1 | 0.80mi |
| 216 Drayton Dr Unit B Clarksville, TN | 2.0 | 1.5 | 1146 | $1,200 | $1.05 | 23d | 1 | 0.80mi |
| 220 Drayton Dr Unit D Clarksville, TN | 2.0 | 2.5 | 1146 | $1,295 | $1.13 | 15d | 1 | 0.80mi |
| 1671 Fort Campbell Blvd Clarksville, TN | 1.0–2.0 | 1.0–1.5 | 726 | $1,206 | $1.66 | 23d | 18 | 0.84mi |
| 200 Lexington Dr Clarksville, TN | 2.0 | 1.5 | 1050 | $1,098 | $1.05 | 15d | 2 | 0.85mi |
| 512 Kellia Dr Clarksville, TN | 3.0 | 1.5 | 1196 | $1,350 | $1.13 | 15d | 1 | 0.90mi |
| 512 Kellia Dr Clarksville, TN | 3.0 | 1.5 | 1196 | $1,350 | $1.13 | 23d | 1 | 0.90mi |
| 1603 Minglewood Dr #10 Clarksville, TN | 2.0 | 1.5 | 1000 | $795 | $0.80 | 23d | 1 | 0.93mi |
| 209 Lexington Dr Apt 1 Clarksville, TN | 2.0 | 1.0 | 882 | $895 | $1.01 | 23d | 1 | 0.93mi |
| 1235 Parkway Pl Clarksville, TN | 2.0 | 1.0 | 920 | $795 | $0.86 | 23d | 1 | 0.94mi |
| 830 Peachers Mill Rd Clarksville, TN | 1.0–3.0 | 1.0–1.5 | 945 | $1,280 | $1.35 | 15d | 19 | 0.94mi |
| 1237 Parkway Pl Unit C Clarksville, TN | 2.0 | 1.0 | 984 | $850 | $0.86 | 23d | 1 | 0.94mi |
| 248 Drayton Dr Clarksville, TN | 2.0–3.0 | 1.5–2.5 | 1060 | $1,545 | $1.46 | 15d | 21 | 0.95mi |
| 1245 Parkway Pl Unit D Clarksville, TN | 2.0 | 1.0 | 984 | $850 | $0.86 | 23d | 1 | 0.97mi |
| 1244 Parkway Pl Unit C Clarksville, TN | 2.0 | 1.5 | 1100 | $1,000 | $0.91 | 23d | 1 | 0.98mi |
| 279 Northridge Dr Unit 2 Clarksville, TN | 2.0 | 1.5 | 1000 | $895 | $0.90 | 23d | 1 | 0.99mi |
| 1201 Fort Campbell Blvd Unit 1A Clarksville, TN | 2.0 | 2.5 | 920 | $1,100 | $1.20 | 23d | 1 | 0.99mi |
| 102 Darlene Dr Clarksville, TN | 3.0 | 1.5 | 1123 | $1,400 | $1.25 | 23d | 1 | 0.99mi |
| 277 Northridge Dr Unit 8 Clarksville, TN | 2.0 | 1.5 | 950 | $895 | $0.94 | 23d | 1 | 0.99mi |
Listing history 2 events
-
2026-05-15status Pending
-
2026-05-06$160,000 Active
ⓘ Source: listings_history table (triggers on properties + properties_extension) + one-shot
backfill from property_details.listing_events for pre-trigger history.
Tax reassessment forecast TN · Resets to sale price
- Current annual tax
- $991 · $83/mo
- Projected year-2 tax
- $1,136 · $95/mo
- Expected delta
- +$145/yr (+$12/mo · 14.6%)
ⓘ Screening estimate from a state-policy table — verify with the county assessor before closing.
Climate risk First Street
- Flood 5/10 Major FEMA zone X (unshaded) · 24% chance over 30 yrs
- Wildfire 3/10 Moderate
- Heat 5/10 Major 7 d/yr ≥107°F today · 20 d/yr by 30 yrs out
- Wind 4/10 Moderate 9% chance of damaging wind over 30 yrs
- Air quality 2/10 Low 1 unhealthy d/yr today · 1 by 30 yrs out
Nearby sold comps map
Loading sold comps map…
Walkable amenities ~0.75 mi
Loading nearby amenities…
Taxation est. · year 1
- Rental income
- $15,803
- − Mortgage interest
- −$8,962
- − Property taxes
- −$991
- − Insurance
- −$800
- − Repairs & maintenance
- −$1,264
- − Management
- −$1,264
- − Depreciation
- −$4,655
- Taxable loss
- −$2,133
- Est. tax savings @ 24.0%
- +$512
- After-tax cash flow
- $1,137/yr
For passive investors: Depreciation is non-cash, so a rental often shows a tax loss while cash-flowing — sheltering income. Rental losses are passive: they offset passive income freely, and up to $25,000/yr can offset ordinary (W-2) income if you actively participate and your MAGI is under $100k (phasing out to $0 by $150k); unused losses carry forward. On sale, claimed depreciation is recaptured at up to 25%, and gains may owe capital-gains tax (a 1031 exchange can defer both). Figures are a year-1 estimate at your 24.0% rate — not tax advice; consult a CPA.
Schools (NCES district)
- District
- Montgomery County
- NCES district ID
- 4703030
- Math proficiency
- 25% ▼ -20.00%
- Reading proficiency
- 31% ▼ -10.00%
- Median HH income
- $50,423
- Composite
- 24.56/100
- National rank
- #7641
- State rank
- #65 of 139 in TN
Livability — Clarksville
- Score
- 84/100
- State rank
- #1
- US rank
- #798
Category grades
Schools grade is shown separately in the Schools card above.
Census & demographics
- Census place
- Clarksville, TN
- County
- Montgomery County · 211,371 people
- City population
- 211,371
- Metro
- Clarksville, TN-KY
- Population (ZIP)
- 87,652
- Household income
- $70,393
- Rent vs Own
- Severe rent burden
- 2093.0
Population outlook (Montgomery County) Hauer SSP2
- Today (2025)
- 236,633 people
- By 2030
- 258,978 · +9.4%
- By 2040
- 305,456 · +29.1%
- By 2050
- 353,147 · +49.2%
- By 2075
- 471,289 · +99.2%
- By 2100
- 564,122 · +138.4%
Race, ethnicity, and origin ACS 2023
- Neighborhood character
- Diverse neighborhood (Simpson 0.68)
- Race & ethnicity
- White 48% Black 26% Hispanic / Latino 15% Two or more races 13% Asian 3%
- Hispanic origin (detail)
- Mexican 6% Puerto Rican 4%
- Common ancestry
- Italian 4% Slovak 1% Lithuanian 1%
- Foreign-born
- 8% · Canada, South Korea, China
- Languages at home
- 88% English-only · Spanish 8% German/W. Germanic 1% Other Indo-European 1%
Political lean MEDSL · Montgomery
- 2024 margin
- R (+18.4) · D 40.0% · R 58.5% · Other 1.5%
- 2008→2024 swing
- -10.5pp toward R · 2008: -7.9pp · 2024: -18.4pp
- All cycles
- 2024: R+18.4 2020: R+12.7 2016: R+18.6 2012: R+10.5 2008: R+7.9
Not yet ingested
- Civics
- —
Market trends
- HPI YoY
- ▼ -58.81%
- Current HPI
- 264.4911
- Rent YoY
- ▲ 1.27%
- Metro
- Clarksville, TN-KY
- State GDP YoY
- ▲ 2.78%
- F500 in state
- 22
Industry mix (Fortune 500 HQ in TN)
| Industry | F500 HQs | Revenue |
|---|---|---|
| Healthcare | 3 | $91B |
|
||
| Retail | 3 | $72B |
|
||
| Transportation / Logistics | 1 | $88B |
|
||
| Paper / Packaging | 1 | $19B |
|
||
| Insurance | 1 | $13B |
|
||
| Energy | 1 | $12B |
|
||
Price history
2 events — show timeline
- 2026-05-15 Pending — REALTRACS as Distributed by MLS Grid
- 2026-05-06 Listed $160,000 REALTRACS as Distributed by MLS Grid
Property tax history
+4.7%/yrLatest (2025): $991 · +0.0% YoY. Source: county tax records.
Cash-flow waterfall
monthlySold comps — $/sqft
last 12 mo · ≤1 miLoading sold comps…