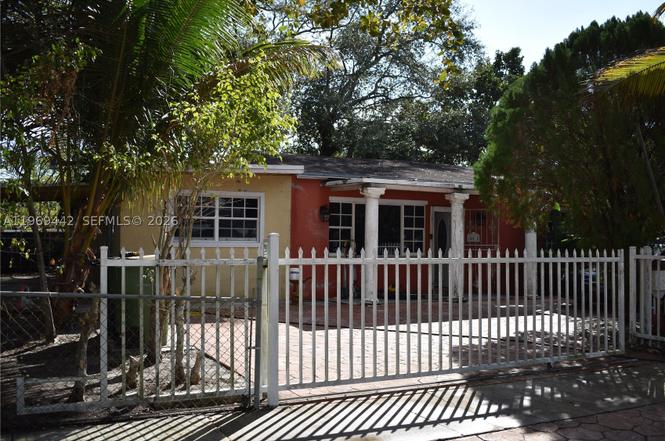
14015 NE 11th Ave · North Miami, FL
Flood risk 3/10 · Minor
- FEMA flood zone
- X (unshaded)
- Chance of flooding over 30 yrs
- 0.12%
- Est. flood insurance / yr
- $507 – $1,088
Fire risk 1/10 · Minimal
- Est. fire insurance / yr
- $947 – $1,759
Heat risk 10/10 · Severe
- Hot days now (above 104°F)
- 7 days/yr
- Hot days in 30 yrs
- 29 days/yr
Wind risk 10/10 · Severe
- Chance of severe wind over 30 yrs
- 99.0%
Air-quality risk 2/10 · Minimal
- Unhealthy air days now
- 1 days/yr
- Unhealthy air days in 30 yrs
- 2 days/yr
Risk factors via First Street. Map © Google.
Why this score? — see what drove the C grade
The composite is a weighted blend of 9 inputs, each scored 0–100. Each bar is that input's sub-score; the figure is the points it added to the 100-point composite (weight × sub-score).
- Cash flow +19.4/30.0
- ARV discount +14.7/15.0
- DSCR +6.1/10.0
- 1% rule +4.2/10.0
- Schools +4.2/10.0
- Livability +4.2/5.0
- Condition / age +2.5/5.0
- Rent growth +2.3/5.0
- Appreciation +0.0/10.0
$489,000
🖨 Deal sheet 📄 Offer letter ✓ Due diligence
Listing remarks
ATTENTION INVESTORS & DEVELOPERS Prime oversized 11,200 SQFT corner lot with stunning mature trees and massive upside potential. Centrally located in one of Miami-Dade’s fastest-growing areas. Exceptional opportunity to add a pool, build a second structure, or develop an ADU on this expansive parcel. The existing 1,952 SQFT 4-bedroom, 2-bath home is ready for renovation and offers strong value-add potential. Perfect for fix-and-flip, rental income, or redevelopment. Rare chance to maximize returns on a highly desirable oversized lot - don’t miss this one!
Key facts
- Oversized corner lot
- Add a pool
- Expansive parcel
Tags
Property features AI
Exterior
- Parking: Driveway; Street parking
- Utilities: Public water; Public sewer
- Home design: Single-story; Faces east; Entry on first floor
- Construction: Block construction; Shingle roof; Effective year built
- Exterior features: Fenced yard; Patio
Interior
- Bedrooms: Includes bedroom on main level
- Flooring: Ceramic tile flooring
- Bathrooms: 2 full bathrooms
- Heating & cooling: Central air conditioning; Electric heating
- Interior features: Bedroom on main level; First floor entry
- Laundry & utility: Laundry room; Utility room
Neighborhood map
What this means for you Summary
Snapshot
- This is a 3-bed/2.0-bath single-family listed at $489k.
Deal economics
- At list price, monthly cash flow is $548 ($7k/yr) — positive.
- The deal already cash-flows at list — no discount required.
- To meet the 1% rule (rent ≥ 1% of price), the offer needs to be $449k (8.2% below list).
- Recommended offer: $445k (9.0% below list) — sets the bar for market timing.
- Cap rate 7.6% vs local median 4.1% in North Miami — top-decile yield for the area; either an underpriced asset or a hidden risk that comps aren't pricing in. Stress-test before assuming the spread holds.
Location & tenants
- Location reads 83/100 on livability (#51 in FL, #914 nationally) — a professional / high-income tenant draw. Strengths: amenities A+, commute A+, health & safety A+; Watch: schools D+, employment D.
- Miami-Dade (suburban): math 45% / reading 54% proficiency, ranked #40 of 73 in FL (top 55%) — families likely to look elsewhere, expect single-tenant / working-renter base with shorter leases; 64% free/reduced lunch — lower-income household profile, screen leases tightly.
- Market conditions: Rents soft (-0.7%/yr); 338 active listings in the ZIP; 2 comparable units currently listed for rent nearby; 10,051 units permitted in Miami-Dade County in 2024 (7,758 in 5+ unit buildings).
- At $4,491/mo this rent would consume 92% of the median local household income ($58k/yr) (locally 3226% of renters already pay >50% of income on rent) — very limited rent-growth headroom before tenants either downsize or default.
Forward outlook
- Local home prices are declining (-3.0%/yr); year-one equity from $3k of loan paydown is wiped out by about $15k of value loss. Plan a longer hold.
- Miami-Dade County population projected at +28% by 2050 — long-run rental-demand tailwind backs the buy-and-hold thesis.
Negotiation context
- It's been on market 114 days — a 9% lower offer ($445k) is reasonable based on typical stale-listing flexibility.
- 4 sale attempts since 9y ago; this cycle's ask has dropped $36k (7%) from the opening price — seller is motivated, your offer sets the floor, not the list.
- Current owner paid $420k; 16% above their basis — modest negotiation headroom, anchor on the comps not their cost.
Risks & watch-outs
- Watch-outs: built in 1949 — expect roof / HVAC / electrical / plumbing capex.
- Climate carrying-cost: severe wind risk, 99% chance of damaging wind over 30y; extreme-heat days projected 7→29/yr by 2055 (HVAC capex compounding) — expect insurance premiums to compound above CPI over the hold.
Questions for the listing agent
- It's been on market 114 days. Have you received any prior offers? Is the seller open to a 9% concession, seller financing, or rate buy-down credit?
- Built in 1949 — when were the roof, HVAC, electrical panel, plumbing, and water heater last replaced?
- Why hasn't it sold? Are there any deal-killer items the seller is aware of (foundation, flood, title, zoning, code violations)?
- Is there a deadline driving the sale (1031 exchange, divorce, estate, relocation)? That informs how much negotiation room exists.
- Schools are D-rated, which usually means shorter tenancies and higher turnover. Who's the typical renter profile here, and what's been the actual vacancy rate?
- What's the average days-on-market for RENTAL listings here right now (not sales)? A rising rental-DOM trend means longer vacancies and softer asking-rent achievability than the comps imply.
- What's the recent tenant-quality profile in this submarket — average credit score on applications, eviction rate, late-payment / NSF rate, and stable-employment percentage? A property-management company in the area should have these aggregated.
- How much new for-sale + rental construction is in the pipeline within 1–3 miles? Heavy new supply typically softens prices + rents 12–24 months out; constrained supply supports both.
Investment metrics
- 1% rule
- 0.92% ✗
- Cap rate
- 7.64%
- Cash-on-cash
- 4.81%
- DSCR
- 1.21
- GRM
- 9.1
CMA / ARV
- ARV (on-the-fly)
- $582,010
- Comps found
- 6
Show comp detail 6 sales within ~0.75 mi
| Address | Dist | Beds/Ba | Sqft | Sold | Price | $/sf | Match |
|---|---|---|---|---|---|---|---|
| 14000 NE 16th Ct | 0.65mi | 3/2.0 | 1,400 (-2%) | 2mo | $570,000 | $407 | 65 |
| 1105 NE 133rd St | 0.44mi | 3/2.0 | 1,492 (+4%) | 10mo | $703,000 | $471 | 64 |
| 795 NE 146th St | 0.55mi | 3/2.0 | 1,294 (-10%) | 1mo | $550,000 | $425 | 58 |
| 710 NE 139th St | 0.50mi | 4/2.0 (+1) | 1,328 (-7%) | 11mo | $475,000 | $358 | 51 |
| 900 NE 147th St | 0.47mi | 3/2.0 | 1,555 (+9%) | 18mo | $550,000 | $354 | 48 |
| 12860 NE 10th Ave | 0.75mi | 2/1.0 (-1) | 1,300 (-9%) | 9mo | $350,000 | $269 | 34 |
Match score weights: distance 35% · size 25% · config 20% · recency 20%. Top-matched comps best support the ARV.
Projected returns pro-forma
-3.0% appreciation · 0.0% rent growth · sell at horizon
- IRR
- -12.0%
- Equity multiple
- 0.58×
- Total profit
- $-57,643
- Equity at exit
- $72,911
- IRR
- -7.5%
- Equity multiple
- 0.59×
- Total profit
- $-56,763
- Equity at exit
- $42,280
Cash invested: $136,920 (down + closing). Projections, not guarantees.
Landlord ↔ Tenant lean methodology
- Overall (STATE)
- 87 Strongly Landlord-Friendly
- State Florida
- 87 Strongly Landlord-Friendly · R+3
- County
- — inherits STATE
- City
- — inherits STATE
ZIP-level market 33161
- Rents YoY
- -0.7%
- Active inventory
- 338
- Price-to-rent
- 9.1×
Monthly cashflow live
- Estimated rent
- $4,491 medium interval (Pro) →
- Mortgage (P&I)
- −$2,564
- Tax from tax record
- −$232 /mo · $2,779/yr
- Insurance
- −$204
- HOA
- −$0
- Vacancy / Maint / Mgmt
- −$943
- Net cashflow
- $548
Break-even live
UW: 25.0% down · 7.5% · 30yr · 1.5% tax · 5.0% vac · 8.0% maint · 8.0% mgmt
Financing live
Cash to close
- Down payment
- $122,250
- Closing costs
- $14,670
- Reserves months
- —
- Total cash needed
- —
Loan-product check · same deal, 3 products live
Conventional
25% down · 7.5% · 30yr
- Down + closing
- —
- Monthly P&I
- —
- Monthly cashflow
- —
- DSCR
- —
- Eligible?
- —
Personal DTI + credit; lowest rate.
DSCR
20% down · 8.5% · 30yr
- Down + closing
- —
- Monthly P&I
- —
- Monthly cashflow
- —
- DSCR
- —
- Eligible?
- —
No personal income docs; deal must DSCR.
Hard money
10% down · 12.0% · 12mo
- Down + closing
- —
- Monthly P&I
- —
- Monthly cashflow
- —
- DSCR
- —
- Eligible?
- —
Short-term bridge; refi at stabilization.
Rent comps 2 comps
| Address | Beds | Baths | Sqft | Rent | $/sqft | DOM | Units | Dist |
|---|---|---|---|---|---|---|---|---|
| 2020 NE 135th St #904 North Miami, FL | 2.0 | 2.0 | 963 | $23,509 | $24.41 | 15d | 1 | 1.44mi |
| 2020 NE 135th St North Miami, FL | 2.0 | 2.0 | 963 | $23,509 | $24.41 | 13d | 1 | 1.44mi |
Listing history 29 events
-
2026-06-18days on market $489,000 Active 114 DOM
-
2026-06-17days on market $489,000 Active 113 DOM
-
2026-06-16days on market $489,000 Active 112 DOM
-
2026-06-15days on market $489,000 Active 111 DOM
-
2026-06-13days on market $489,000 Active 109 DOM
-
2026-06-09days on market $489,000 Active 105 DOM
-
2026-06-08days on market $489,000 Active 104 DOM
-
2026-06-07days on market $489,000 Active 103 DOM
-
2026-06-04days on market $489,000 Active 100 DOM
-
2026-06-03days on market $489,000 Active 99 DOM
-
2026-06-02days on market $489,000 Active 98 DOM
-
2026-06-01days on market $489,000 Active 97 DOM
-
2026-05-31days on market $489,000 Active 96 DOM
-
2026-05-04price $499,000
-
2026-04-09price $509,900
-
2026-04-06status Active
-
2026-04-02status Pending
-
2026-02-20$524,900 Active
-
2026-02-06soldstatus $420,000
-
2025-12-08price $434,900
-
2019-08-03status Backup Contract
-
2018-08-24historical
-
2018-08-24status Backup Contract
-
2018-08-23$180,000 Active
-
2017-10-05status Pending
-
2017-10-03historical
-
2017-10-01$150,000 Active
-
1998-05-26soldstatus $95,000
-
1993-09-01soldstatus $66,000
ⓘ Source: listings_history table (triggers on properties + properties_extension) + one-shot
backfill from property_details.listing_events for pre-trigger history.
Tax reassessment forecast FL · Resets to sale price
- Current annual tax
- $2,779 · $232/mo
- Projected year-2 tax
- $4,059 · $338/mo
- Expected delta
- +$1,280/yr (+$107/mo · 46.0%)
ⓘ Screening estimate from a state-policy table — verify with the county assessor before closing.
Climate risk First Street
- Flood 3/10 Moderate FEMA zone X (unshaded) · 12% chance over 30 yrs
- Wildfire 1/10 Low
- Heat 10/10 Extreme 7 d/yr ≥104°F today · 29 d/yr by 30 yrs out
- Wind 10/10 Extreme 99% chance of damaging wind over 30 yrs
- Air quality 2/10 Low 1 unhealthy d/yr today · 2 by 30 yrs out
Nearby sold comps map
Loading sold comps map…
Walkable amenities ~0.75 mi
Loading nearby amenities…
Taxation est. · year 1
- Rental income
- $53,894
- − Mortgage interest
- −$27,392
- − Property taxes
- −$2,779
- − Insurance
- −$2,445
- − Repairs & maintenance
- −$4,312
- − Management
- −$4,312
- − Depreciation
- −$14,225
- Taxable loss
- −$1,570
- Est. tax savings @ 24.0%
- +$377
- After-tax cash flow
- $6,957/yr
For passive investors: Depreciation is non-cash, so a rental often shows a tax loss while cash-flowing — sheltering income. Rental losses are passive: they offset passive income freely, and up to $25,000/yr can offset ordinary (W-2) income if you actively participate and your MAGI is under $100k (phasing out to $0 by $150k); unused losses carry forward. On sale, claimed depreciation is recaptured at up to 25%, and gains may owe capital-gains tax (a 1031 exchange can defer both). Figures are a year-1 estimate at your 24.0% rate — not tax advice; consult a CPA.
Schools (NCES district)
- District
- Miami-Dade
- NCES district ID
- 1200390
- Math proficiency
- 45% ▼ -16.00%
- Reading proficiency
- 54% ▼ -5.00%
- Median HH income
- $43,928
- Composite
- 41.76/100
- National rank
- #3397
- State rank
- #40 of 73 in FL
Livability — North Miami
- Score
- 83/100
- State rank
- #51
- US rank
- #914
Category grades
Schools grade is shown separately in the Schools card above.
Census & demographics
- Census place
- North Miami, FL
- County
- Miami-Dade County · 2,697,751 people
- City population
- 99,437
- Metro
- Miami-Fort Lauderdale-Pompano Beach, FL
- Population (ZIP)
- 54,814
- Household income
- $58,325
- Rent vs Own
- Severe rent burden
- 3226.0
Population outlook (Miami-Dade County) Hauer SSP2
- Today (2025)
- 3,126,439 people
- By 2030
- 3,325,765 · +6.4%
- By 2040
- 3,697,561 · +18.3%
- By 2050
- 4,012,134 · +28.3%
- By 2075
- 4,605,612 · +47.3%
- By 2100
- 4,866,598 · +55.7%
Race, ethnicity, and origin ACS 2023
- Neighborhood character
- Diverse neighborhood (Simpson 0.58)
- Race & ethnicity
- Black 56% Hispanic / Latino 31% Two or more races 18% White 8% Asian 2%
- Hispanic origin (detail)
- Puerto Rican 4% Cuban 7% Dominican 4% Salvadoran 1%
- Common ancestry
- Hispanic 35% Estonian 1% Lithuanian 1%
- Foreign-born
- 51% · Canada, Jamaica, Dominican Republic
- Languages at home
- 25% English-only · French/Haitian/Cajun 41% Spanish 30% Other Indo-European 2%
Political lean MEDSL · Miami-Dade
- 2024 margin
- R (+11.4) · D 43.9% · R 55.4%
- 2008→2024 swing
- -27.6pp toward R · 2008: 16.1pp · 2024: -11.4pp
- All cycles
- 2024: R+11.4 2020: D+7.3 2016: D+29.6 2012: D+23.7 2008: D+16.1
Not yet ingested
- Civics
- —
Market trends
- HPI YoY
- ▼ -492.86%
- Current HPI
- 630.6932
- Rent YoY
- ▼ -0.73%
- Metro
- Miami-Fort Lauderdale-Pompano Beach, FL
- State GDP YoY
- ▲ 3.28%
- F500 in state
- 36
Industry mix (Fortune 500 HQ in FL)
| Industry | F500 HQs | Revenue |
|---|---|---|
| Industrial Technology | 2 | $29B |
|
||
| Insurance | 2 | $17B |
|
||
| Retail | 1 | $60B |
|
||
| Technology Distribution | 1 | $58B |
|
||
| Homebuilding | 1 | $35B |
|
||
| Technology Manufacturing | 1 | $35B |
|
||
Price history
+656.1% since first listed16 events — show timeline
- 2026-05-04 Price Changed $499,000 MARMLS
- 2026-04-09 Price Changed $509,900 MARMLS
- 2026-04-06 Relisted — MARMLS
- 2026-04-02 Pending — MARMLS
- 2026-02-20 Listed $524,900 MARMLS
- 2026-02-06 Sold (Public Records) $420,000 Public Records
- 2025-12-08 Price Changed $434,900 MARMLS
- 2019-08-03 Pending — MARMLS
- 2018-08-24 Listing Removed — MARMLS
- 2018-08-24 Pending — MARMLS
- 2018-08-23 Listed $180,000 MARMLS
- 2017-10-05 Pending — MARMLS
- 2017-10-03 Listing Removed — MARMLS
- 2017-10-01 Listed $150,000 MARMLS
- 1998-05-26 Sold (Public Records) $95,000 Public Records
- 1993-09-01 Sold (Public Records) $66,000 Public Records
Property tax history
+5.5%/yrLatest (2025): $2,779 · +3.5% YoY. Source: county tax records.
Cash-flow waterfall
monthlySold comps — $/sqft
last 12 mo · ≤1 miLoading sold comps…