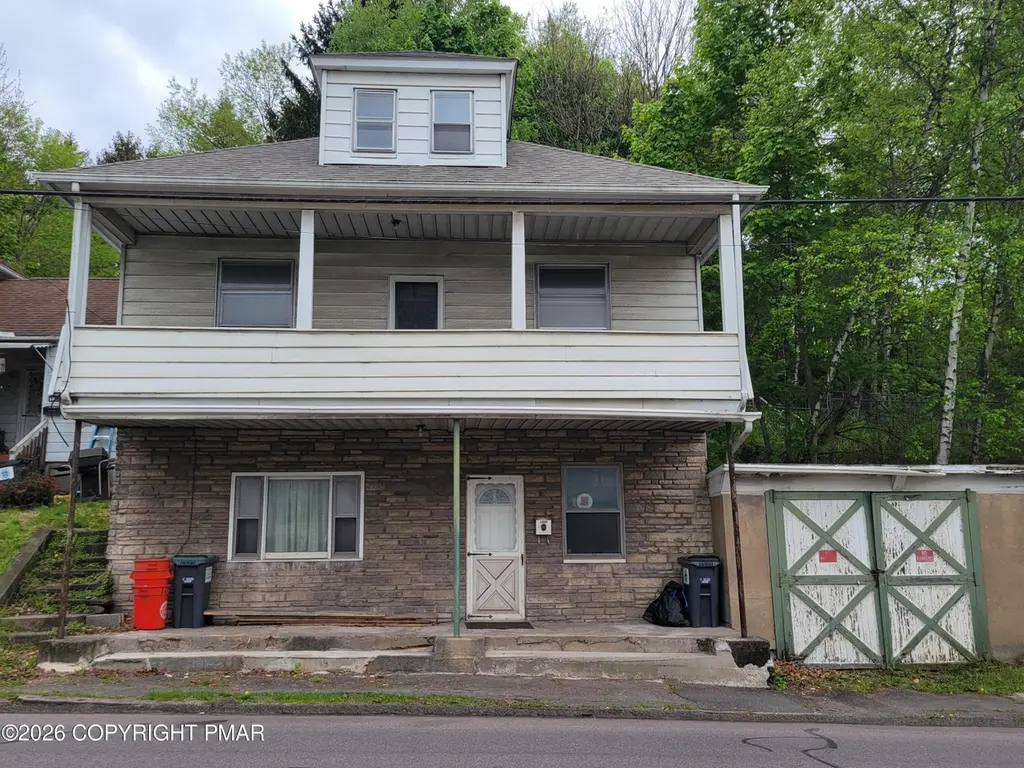
1249 Main St · Jenkins, PA
Flood risk 5/10 · Moderate
- FEMA flood zone
- X (unshaded)
- Chance of flooding over 30 yrs
- 0.27%
- Est. flood insurance / yr
- $507 – $1,088
Fire risk 1/10 · Minimal
- Est. fire insurance / yr
- $511 – $949
Heat risk 4/10 · Minor
- Hot days now (above 96°F)
- 7 days/yr
- Hot days in 30 yrs
- 16 days/yr
Wind risk 3/10 · Minor
- Chance of severe wind over 30 yrs
- 4.0%
Air-quality risk 2/10 · Minimal
- Unhealthy air days now
- 1 days/yr
- Unhealthy air days in 30 yrs
- 2 days/yr
Risk factors via First Street. Map © Google.
Why this score? — see what drove the C grade
The composite is a weighted blend of 9 inputs, each scored 0–100. Each bar is that input's sub-score; the figure is the points it added to the 100-point composite (weight × sub-score).
- Cash flow +20.8/30.0
- ARV discount +14.9/15.0
- DSCR +6.6/10.0
- 1% rule +5.3/10.0
- Schools +3.0/10.0
- Rent growth +2.5/5.0
- Livability +2.5/5.0
- Condition / age +2.5/5.0
- Appreciation +0.0/10.0
$129,000
🖨 Deal sheet 📄 Offer letter ✓ Due diligence
Listing remarks
INVESTORS WELCOME! Opportunity awaits with this spacious home full of potential, perfectly situated in a desirable and peaceful setting. Set on approximately a quarter acre in a quiet neighborhood, this property offers a solid foundation and great bones--ready for your vision and personal touch. The home features a generous layout with ample living space and a semi-finished attic as a third bedroom, Whether you're looking to customize your dream home or invest in a value-add property, the possibilities here are endless. Recent improvements include a newer roof with a transferable warranty, offering added peace of mind as you bring this home back to life. Conveniently located just minutes fr
Key facts
- Semi-finished attic
- Ample living space
- Newer roof
Tags
Property features AI
Exterior
- Parking: Attached garage (1 car); One open/off-street parking space; Garage faces front; Gravel driveway
- Utilities: Public water; Public sewer; 100 Amp electric service
- Home design: Single-family residence; Residential property; House
- Construction: Concrete foundation (slab); Concrete construction; Stone veneer; Vinyl siding; Built with slab foundation
- Exterior features: Sloped lot with backyard; Back yard fencing; Asphalt roof
Interior
- Kitchen: No appliances listed
- Bedrooms: 8 total rooms (includes bedrooms and other living spaces)
- Flooring: Carpet; Concrete; Vinyl; Wood
- Bathrooms: 1 full bathroom
- Heating & cooling: Oil heating; No cooling
- Interior features: Unfurnished; Balcony; Enclosed rear porch; Front porch
- Laundry & utility: Main-level laundry
Neighborhood map
What this means for you Summary
Snapshot
- This is a 3-bed/1.0-bath single-family listed at $129k.
Deal economics
- At list price, monthly cash flow is $178 ($2k/yr) — positive.
- The deal already cash-flows at list — no discount required.
- Meets the 1% rule at list price ($1k rent vs $129k).
- Recommended offer: $125k (3.0% below list) — sets the bar for market timing.
Location & tenants
- Location reads: area grade C — affects rentability + tenant quality, not the cash-flow math above.
- Pittston Area SD (suburban): math 30% / reading 40% proficiency, ranked #418 of 539 in PA (top 78%) — families likely to look elsewhere, expect single-tenant / working-renter base with shorter leases.
- Market conditions: 103 active listings in the ZIP; 10 comparable units currently listed for rent nearby; rentals leasing fast (median 14d on market — plan ~1-2 weeks tenant-placement turnaround); 349 units permitted in Luzerne County in 2024 (16 in 5+ unit buildings).
Forward outlook
- Local home prices are declining (-3.0%/yr); year-one equity from $892 of loan paydown is wiped out by about $4k of value loss. Plan a longer hold.
- Luzerne County population projected at +4% by 2050 — modest demand growth; plan on rents tracking national, not racing it.
Negotiation context
- It's been on market 47 days — a 3% lower offer ($125k) is reasonable based on typical stale-listing flexibility.
Risks & watch-outs
- Watch-outs: built in 1922 — expect roof / HVAC / electrical / plumbing capex.
- Climate carrying-cost: moderate flood risk — expect insurance premiums to compound above CPI over the hold.
Questions for the listing agent
- It's been on market 47 days. Have you received any prior offers? Is the seller open to a 3% concession, seller financing, or rate buy-down credit?
- Built in 1922 — when were the roof, HVAC, electrical panel, plumbing, and water heater last replaced?
- Is there a deadline driving the sale (1031 exchange, divorce, estate, relocation)? That informs how much negotiation room exists.
- What's the average days-on-market for RENTAL listings here right now (not sales)? A rising rental-DOM trend means longer vacancies and softer asking-rent achievability than the comps imply.
- What's the recent tenant-quality profile in this submarket — average credit score on applications, eviction rate, late-payment / NSF rate, and stable-employment percentage? A property-management company in the area should have these aggregated.
- How much new for-sale + rental construction is in the pipeline within 1–3 miles? Heavy new supply typically softens prices + rents 12–24 months out; constrained supply supports both.
Investment metrics
- 1% rule
- 1.03% ✓
- Cap rate
- 7.95%
- Cash-on-cash
- 5.91%
- DSCR
- 1.26
- GRM
- 8.1
CMA / ARV
- ARV (median comp)
- $154,191
- List price
- $129,000
- Delta
- -16.34%
- Verdict
- UNDERPRICED
- Comps
- 20 within 1.0 mi
Show comp detail 3 sales within ~0.75 mi
| Address | Dist | Beds/Ba | Sqft | Sold | Price | $/sf | Match |
|---|---|---|---|---|---|---|---|
| 1021 Rear Wyoming Ave | 0.75mi | 2/1.0 (-1) | 956 (+0%) | 1mo | $199,900 | $209 | 58 |
| 1351 Main St | 0.28mi | 2/1.0 (-1) | 1,056 (+11%) | 10mo | $86,000 | $81 | 55 |
| 2 Quiet Cv | 0.59mi | 2/1.0 (-1) | 860 (-10%) | 23mo | $37,000 | $43 | 32 |
Match score weights: distance 35% · size 25% · config 20% · recency 20%. Top-matched comps best support the ARV.
Projected returns pro-forma
-3.0% appreciation · 3.0% rent growth · sell at horizon
- IRR
- -7.2%
- Equity multiple
- 0.74×
- Total profit
- $-9,560
- Equity at exit
- $19,234
- IRR
- 2.4%
- Equity multiple
- 1.17×
- Total profit
- $6,300
- Equity at exit
- $11,154
Cash invested: $36,120 (down + closing). Projections, not guarantees.
Landlord ↔ Tenant lean methodology
- Overall (STATE)
- 62 Landlord-Friendly
- State Pennsylvania
- 62 Landlord-Friendly · EVEN
- County
- — inherits STATE
- City
- — inherits STATE
ZIP-level market 18640
- Home prices YoY
- -34.9%
- Active inventory
- 103
- Price-to-rent
- 8.1×
Monthly cashflow live
- Estimated rent
- $1,326 high interval (Pro) →
- Mortgage (P&I)
- −$676
- Tax from tax record
- −$139 /mo · $1,674/yr
- Insurance
- −$54
- HOA
- −$0
- Vacancy / Maint / Mgmt
- −$279
- Net cashflow
- $178
Break-even live
UW: 25.0% down · 7.5% · 30yr · 1.5% tax · 5.0% vac · 8.0% maint · 8.0% mgmt
Financing live
Cash to close
- Down payment
- $32,250
- Closing costs
- $3,870
- Reserves months
- —
- Total cash needed
- —
Loan-product check · same deal, 3 products live
Conventional
25% down · 7.5% · 30yr
- Down + closing
- —
- Monthly P&I
- —
- Monthly cashflow
- —
- DSCR
- —
- Eligible?
- —
Personal DTI + credit; lowest rate.
DSCR
20% down · 8.5% · 30yr
- Down + closing
- —
- Monthly P&I
- —
- Monthly cashflow
- —
- DSCR
- —
- Eligible?
- —
No personal income docs; deal must DSCR.
Hard money
10% down · 12.0% · 12mo
- Down + closing
- —
- Monthly P&I
- —
- Monthly cashflow
- —
- DSCR
- —
- Eligible?
- —
Short-term bridge; refi at stabilization.
Rent comps 10 comps
| Address | Beds | Baths | Sqft | Rent | $/sqft | DOM | Units | Dist |
|---|---|---|---|---|---|---|---|---|
| 149 Tompkins St Unit 2 Pittston, PA | 2.0 | 1.0 | 737 | $1,100 | $1.49 | 21d | 1 | 0.68mi |
| 24 E Columbus Ave Pittston, PA | 2.0 | 1.0 | 896 | $1,200 | $1.34 | 21d | 1 | 1.02mi |
| 109 Main St Pittston, PA | 2.0–3.0 | 2.0 | 1070 | $1,300 | $1.21 | 13d | 1 | 1.06mi |
| 13 Kennedy St Pittston, PA | 2.0 | 1.0 | 700 | $1,800 | $2.57 | 13d | 1 | 1.20mi |
| 14 S Main St Pittston, PA | 2.0 | 1.0 | 725 | $1,850 | $2.55 | 13d | 1 | 1.25mi |
| 187 Wyoming Ave Wyoming, PA | 2.0 | 1.0 | 700 | $1,300 | $1.86 | 21d | 1 | 1.30mi |
| 306 Roosevelt St Exeter, PA | 2.0 | 1.0 | 1004 | $1,175 | $1.17 | 13d | 1 | 1.39mi |
| 118 1/2 Broad St Pittston, PA | 2.0 | 1.0 | 950 | $1,200 | $1.26 | 13d | 1 | 1.39mi |
| 3 Butler St Unit 1-D Pittston, PA | 2.0 | 1.0 | 810 | $1,175 | $1.45 | 13d | 1 | 1.39mi |
| 333 Exeter Ave West Pittston, PA | 2.0 | 1.0 | 700 | $1,500 | $2.14 | 21d | 1 | 1.49mi |
Listing history 15 events
-
2026-06-18days on market $129,000 Active 47 DOM
-
2026-06-17days on market $129,000 Active 46 DOM
-
2026-06-16pricedays on market $129,000 Active 45 DOM
-
2026-06-15days on market $155,000 Active 44 DOM
-
2026-06-14days on market $155,000 Active 42 DOM
-
2026-06-13days on market $155,000 Active 41 DOM
-
2026-06-10days on market $155,000 Active 39 DOM
-
2026-06-09days on market $155,000 Active 38 DOM
-
2026-06-08days on market $155,000 Active 37 DOM
-
2026-06-07days on market $155,000 Active 36 DOM
-
2026-06-02days on market $155,000 Active 31 DOM
-
2026-06-01days on market $155,000 Active 30 DOM
-
2026-05-31days on market $155,000 Active 29 DOM
-
2026-05-30days on market $155,000 Active 28 DOM
-
2026-05-01$174,900 Active 1046-char remark
ⓘ Source: listings_history table (triggers on properties + properties_extension) + one-shot
backfill from property_details.listing_events for pre-trigger history.
Tax reassessment forecast PA · Partial reset (capped growth)
- Current annual tax
- $1,674 · $139/mo
- Projected year-2 tax
- $1,856 · $155/mo
- Expected delta
- +$182/yr (+$15/mo · 10.9%)
ⓘ Screening estimate from a state-policy table — verify with the county assessor before closing.
Climate risk First Street
- Flood 5/10 Major FEMA zone X (unshaded) · 27% chance over 30 yrs
- Wildfire 1/10 Low
- Heat 4/10 Moderate 7 d/yr ≥96°F today · 16 d/yr by 30 yrs out
- Wind 3/10 Moderate 4% chance of damaging wind over 30 yrs
- Air quality 2/10 Low 1 unhealthy d/yr today · 2 by 30 yrs out
Nearby sold comps map
Loading sold comps map…
Walkable amenities ~0.75 mi
Loading nearby amenities…
Taxation est. · year 1
- Rental income
- $15,915
- − Mortgage interest
- −$7,226
- − Property taxes
- −$1,674
- − Insurance
- −$645
- − Repairs & maintenance
- −$1,273
- − Management
- −$1,273
- − Depreciation
- −$3,753
- Taxable income
- $71
- Est. tax owed @ 24.0%
- −$17
- After-tax cash flow
- $2,119/yr
For passive investors: Depreciation is non-cash, so a rental often shows a tax loss while cash-flowing — sheltering income. Rental losses are passive: they offset passive income freely, and up to $25,000/yr can offset ordinary (W-2) income if you actively participate and your MAGI is under $100k (phasing out to $0 by $150k); unused losses carry forward. On sale, claimed depreciation is recaptured at up to 25%, and gains may owe capital-gains tax (a 1031 exchange can defer both). Figures are a year-1 estimate at your 24.0% rate — not tax advice; consult a CPA.
Schools (NCES district)
- District
- Pittston Area SD
- NCES district ID
- 4219200
- Math proficiency
- 30% ▼ -12.00%
- Reading proficiency
- 40% ▼ -19.00%
- Median HH income
- $45,316
- Composite
- 29.86/100
- National rank
- #6409
- State rank
- #418 of 539 in PA
Livability — Jenkins
No livability data for this city. (Only ~50 U.S. cities are tracked.)
Census & demographics
- Population (ZIP)
- 16,418
Population outlook (Luzerne County) Hauer SSP2
- Today (2025)
- 319,505 people
- By 2030
- 319,943 · +0.1%
- By 2040
- 322,643 · +1.0%
- By 2050
- 330,817 · +3.5%
- By 2075
- 379,145 · +18.7%
- By 2100
- 431,908 · +35.2%
Race, ethnicity, and origin ACS 2023
- Neighborhood character
- Predominantly White (85%)
- Race & ethnicity
- White 85% Hispanic / Latino 6% Two or more races 5% Black 4%
- Hispanic origin (detail)
- Puerto Rican 4%
- Common ancestry
- Romanian 19% Scotch-Irish 2% Iranian 1%
- Foreign-born
- 3% · Canada, Jamaica
- Languages at home
- 93% English-only · Spanish 4% Other Indo-European 1% Chinese 1%
Political lean MEDSL · Luzerne
- 2024 margin
- R (+19.2) · D 40.0% · R 59.2%
- 2008→2024 swing
- -27.6pp toward R · 2008: 8.4pp · 2024: -19.2pp
- All cycles
- 2024: R+19.2 2020: R+14.4 2016: R+19.6 2012: D+4.8 2008: D+8.4
Not yet ingested
- Civics
- —
Market trends
- HPI YoY
- ▼ -102.89%
- Current HPI
- 191.973
- Rent YoY
- —
- Metro
- —
- State GDP YoY
- ▲ 1.68%
- F500 in state
- 34
Industry mix (Fortune 500 HQ in PA)
| Industry | F500 HQs | Revenue |
|---|---|---|
| Healthcare | 2 | $309B |
|
||
| Insurance | 2 | $27B |
|
||
| Telecommunications / Media | 1 | $124B |
|
||
| Industrial Distribution | 1 | $22B |
|
||
| Financial Services | 1 | $20B |
|
||
| Chemicals / Materials | 1 | $18B |
|
||
Price history
-26.2% since first listed3 events — show timeline
- 2026-06-16 Price Changed $129,000 PMAR
- 2026-05-20 Price Changed $155,000 PMAR
- 2026-05-01 Listed $174,900 PMAR
Property tax history
+1.6%/yrLatest (2026): $1,674 · +2.5% YoY. Source: county tax records.
Cash-flow waterfall
monthlySold comps — $/sqft
last 12 mo · ≤1 miLoading sold comps…