 🏷️ Likely Rental
None · Greeneville, TN
Flood risk 1/10 · Minimal
- FEMA flood zone
- X (unshaded)
- Chance of flooding over 30 yrs
- 0.0%
- Est. flood insurance / yr
- $507 – $1,088
Fire risk 4/10 · Minor
- Est. fire insurance / yr
- $949 – $1,763
Heat risk 5/10 · Moderate
- Hot days now (above 101°F)
- 7 days/yr
- Hot days in 30 yrs
- 21 days/yr
Wind risk 2/10 · Minimal
- Chance of severe wind over 30 yrs
- —
Air-quality risk 2/10 · Minimal
- Unhealthy air days now
- 1 days/yr
- Unhealthy air days in 30 yrs
- 1 days/yr
Risk factors via First Street. Map © Google.
Why this score? — see what drove the D grade
The composite is a weighted blend of 9 inputs, each scored 0–100. Each bar is that input's sub-score; the figure is the points it added to the 100-point composite (weight × sub-score).
- Cash flow +15.0/30.0
- ARV discount +7.5/15.0
- 1% rule +5.0/10.0
- DSCR +5.0/10.0
- Livability +3.3/5.0
- Schools +2.7/10.0
- Rent growth +2.5/5.0
- Condition / age +2.5/5.0
- Appreciation +0.0/10.0
$950
🖨 Deal sheet 📄 Offer letter ✓ Due diligence
Listing remarks
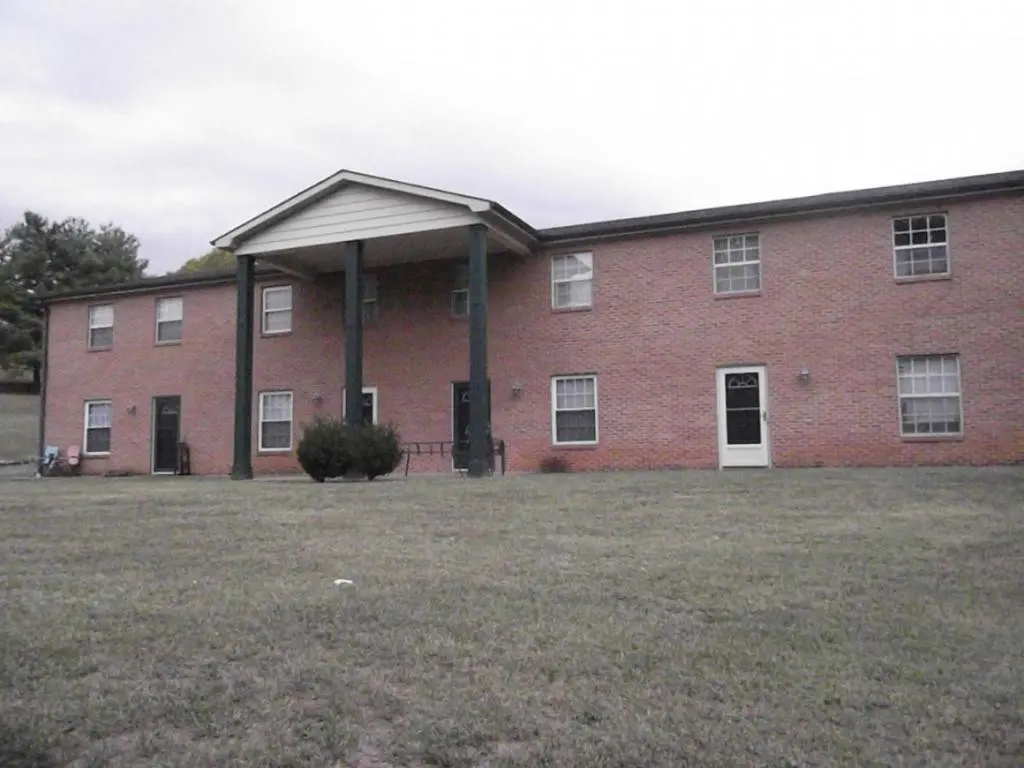
2 Bedroom Townhouse in the city of Greeneville with the 2 bedrooms & 1 Bath upstairs and ½ Bath downstairs. Apartment is furnished with Stove, Refrigerator and Dishwasher and Water. The Apartment building also furnishes a Laundry Mat and it is beside this apartment with Washers and Dryers. Also furnished is a dumpster on the grounds for you to put your trash. Rooms are spacious and located close to Schools, Grocery Store, Restaurants, Service Stations, Hospital and Shopping in downtown is 3 minutes away.
Key facts
- Furnished with stove
- Laundry mat
- 2 bedroom townhouse
Tags
Property features AI
Exterior
- Parking: Parking pad
- Utilities: Public water; Cable available and connected; Electricity connected; Water connected
- Home design: Townhouse; Two levels
- Construction: Brick construction; Slab foundation
- Exterior features: Level topography; Sidewalks
Interior
- Kitchen: Dishwasher; Electric range; Refrigerator
- Flooring: Vinyl flooring; Laminate flooring
- Bathrooms: 1 full bathroom; 1 half bathroom
- Heating & cooling: Heat pump heating; Heat pump cooling
- Interior features: Soaking tub; Insulated windows
Neighborhood map
What this means for you Summary
Snapshot
- This is a 2-bed/1.5-bath single-family listed at $950.
Deal economics
- At list price, monthly cash flow is $878 ($11k/yr) — positive.
- The deal already cash-flows at list — no discount required.
- Meets the 1% rule at list price ($1k rent vs $950).
- Recommended offer: $935 (1.6% below list) — sets the bar for market timing.
- Cap rate 1115.4% vs local median 2.7% in Greeneville — top-decile yield for the area; either an underpriced asset or a hidden risk that comps aren't pricing in. Stress-test before assuming the spread holds.
Location & tenants
- Location reads 66/100 on livability (#125 in TN) — a middle-class / working-renter tenant base. Strengths: cost of living A+, housing A+, health & safety A+; Watch: amenities F, commute F, employment F.
- Greeneville (town): math 31% / reading 34% proficiency, ranked #45 of 139 in TN (top 32%) — families likely to look elsewhere, expect single-tenant / working-renter base with shorter leases.
- Zoned schools: Eastview Elementary (math 32% / reading 37%, grade F, #319 of 952 statewide, top 37%, 360 students, 0% FRL); Greeneville Middle School (math 28% / reading 26%, grade F, #128 of 333 statewide, top 40%, 571 students, 0% FRL); Greeneville High School (math 42% / reading 55%, grade D, #13 of 332 statewide, top 4%, 958 students, 0% FRL) — zoned schools average 0% FRL vs 42% district-wide (42 pts lower); this property's tenant base skews higher-income than the district average.
- Market conditions: 224 active listings in the ZIP; 333 units permitted in Greene County in 2024 (72 in 5+ unit buildings).
Forward outlook
- Local home prices are declining (-3.0%/yr); year-one equity from $6 of loan paydown is wiped out by about $28 of value loss. Plan a longer hold.
- Greene County population projected to shrink 8% by 2050 — rents likely to lag national; underwrite the cash flow, not the appreciation.
- At projected returns (-3.0% appreciation + 3.0% rent growth), your $266 cash investment doubles in ~1 year — after that, you're playing with house money.
Negotiation context
- It's been on market 24 days — a 2% lower offer ($935) is reasonable based on typical stale-listing flexibility.
Risks & watch-outs
- Climate carrying-cost: extreme-heat days projected 7→21/yr by 2055 (HVAC capex compounding) — expect insurance premiums to compound above CPI over the hold.
Questions for the listing agent
- Built in 1979 — when were the roof, HVAC, electrical panel, plumbing, and water heater last replaced?
- Is there a deadline driving the sale (1031 exchange, divorce, estate, relocation)? That informs how much negotiation room exists.
- Schools are D-rated, which usually means shorter tenancies and higher turnover. Who's the typical renter profile here, and what's been the actual vacancy rate?
- The area grade is low — what's the realistic commute time and amenity access for the typical tenant pool here? Any planned neighborhood developments (good or bad) we should know about?
- What's the average days-on-market for RENTAL listings here right now (not sales)? A rising rental-DOM trend means longer vacancies and softer asking-rent achievability than the comps imply.
- What's the recent tenant-quality profile in this submarket — average credit score on applications, eviction rate, late-payment / NSF rate, and stable-employment percentage? A property-management company in the area should have these aggregated.
- How much new for-sale + rental construction is in the pipeline within 1–3 miles? Heavy new supply typically softens prices + rents 12–24 months out; constrained supply supports both.
Investment metrics
- 1% rule
- 117.87% ✓
- Cap rate
- 1115.43%
- Cash-on-cash
- 3961.21%
- DSCR
- 177.25
- GRM
- 0.1
CMA / ARV
- ARV (on-the-fly)
- $154,800
- Comps found
- 12
Show comp detail 12 sales within ~0.75 mi
| Address | Dist | Beds/Ba | Sqft | Sold | Price | $/sf | Match |
|---|---|---|---|---|---|---|---|
| 103 Skyview Dr #1 | 0.00mi | 2/1.5 | 900 (0%) | 0mo | $950 | $1 | 100 |
| 1006 E Church St | 0.10mi | 2/1.0 | 936 (+4%) | 5mo | $195,000 | $208 | 82 |
| 413 Bernard Ave | 0.42mi | 2/1.0 | 896 (-0%) | 5mo | $170,000 | $190 | 73 |
| 802 East Church Street St | 0.42mi | 2/1.0 | 918 (+2%) | 7mo | $100,000 | $109 | 69 |
| 1001 Church St | 0.11mi | 2/1.0 | 934 (+4%) | 21mo | $161,000 | $172 | 69 |
| 604 East Church Hill Rd | 0.58mi | 2/1.0 | 882 (-2%) | 4mo | $75,000 | $85 | 64 |
| 457 Bernard Ave | 0.49mi | 2/1.0 | 954 (+6%) | 3mo | $136,000 | $143 | 62 |
| 613 Barton Ridge Rd | 0.17mi | 2/1.0 | 821 (-9%) | 20mo | $50,000 | $61 | 59 |
| 400 Juniper St | 0.54mi | 2/1.0 | 916 (+2%) | 19mo | $185,000 | $202 | 54 |
| 322 Cypress St | 0.61mi | 2/1.0 | 811 (-10%) | 13mo | $216,000 | $266 | 43 |
| 201 Cypress St | 0.71mi | 3/1.0 (+1) | 912 (+1%) | 20mo | $175,000 | $192 | 41 |
| 303 Bernard Ave | 0.49mi | 2/1.0 | 810 (-10%) | 21mo | $55,000 | $68 | 41 |
Match score weights: distance 35% · size 25% · config 20% · recency 20%. Top-matched comps best support the ARV.
Projected returns pro-forma
-3.0% appreciation · 3.0% rent growth · sell at horizon
- IRR
- —
- Equity multiple
- 210.73×
- Total profit
- $55,788
- Equity at exit
- $142
- IRR
- —
- Equity multiple
- 454.61×
- Total profit
- $120,659
- Equity at exit
- $82
Cash invested: $266 (down + closing). Projections, not guarantees.
Landlord ↔ Tenant lean methodology
- Overall (STATE)
- 87 Strongly Landlord-Friendly
- State Tennessee
- 87 Strongly Landlord-Friendly · R+13
- County
- — inherits STATE
- City
- — inherits STATE
ZIP-level market 37745
- Home prices YoY
- -6.0%
- Active inventory
- 224
- Price-to-rent
- 0.1×
Monthly cashflow live
- Estimated rent
- $1,120 medium interval (Pro) →
- Mortgage (P&I)
- −$5
- Tax est. 1.5%
- −$1 /mo · $14/yr
- Insurance
- −$0
- HOA
- −$0
- Vacancy / Maint / Mgmt
- −$235
- Net cashflow
- $878
Break-even live
UW: 25.0% down · 7.5% · 30yr · 1.5% tax · 5.0% vac · 8.0% maint · 8.0% mgmt
Financing live
Cash to close
- Down payment
- $238
- Closing costs
- $28
- Reserves months
- —
- Total cash needed
- —
Loan-product check · same deal, 3 products live
Conventional
25% down · 7.5% · 30yr
- Down + closing
- —
- Monthly P&I
- —
- Monthly cashflow
- —
- DSCR
- —
- Eligible?
- —
Personal DTI + credit; lowest rate.
DSCR
20% down · 8.5% · 30yr
- Down + closing
- —
- Monthly P&I
- —
- Monthly cashflow
- —
- DSCR
- —
- Eligible?
- —
No personal income docs; deal must DSCR.
Hard money
10% down · 12.0% · 12mo
- Down + closing
- —
- Monthly P&I
- —
- Monthly cashflow
- —
- DSCR
- —
- Eligible?
- —
Short-term bridge; refi at stabilization.
Listing history 9 events
-
2026-06-09days on market $950 Active 24 DOM
-
2026-06-08days on market $950 Active 23 DOM
-
2026-06-07days on market $950 Active 22 DOM
-
2026-06-03days on market $950 Active 18 DOM
-
2026-06-02days on market $950 Active 17 DOM
-
2026-06-01days on market $950 Active 16 DOM
-
2026-05-31days on market $950 Active 15 DOM
-
2026-05-30days on market $950 Active 14 DOM
-
2026-05-16$950 Active
ⓘ Source: listings_history table (triggers on properties + properties_extension) + one-shot
backfill from property_details.listing_events for pre-trigger history.
Climate risk First Street
- Flood 1/10 Low FEMA zone X (unshaded) · 0% chance over 30 yrs
- Wildfire 4/10 Moderate
- Heat 5/10 Major 7 d/yr ≥101°F today · 21 d/yr by 30 yrs out
- Wind 2/10 Low
- Air quality 2/10 Low 1 unhealthy d/yr today · 1 by 30 yrs out
Nearby sold comps map
Loading sold comps map…
Walkable amenities ~0.75 mi
Loading nearby amenities…
Taxation est. · year 1
- Rental income
- $13,437
- − Mortgage interest
- −$53
- − Property taxes
- −$14
- − Insurance
- −$5
- − Repairs & maintenance
- −$1,075
- − Management
- −$1,075
- − Depreciation
- −$28
- Taxable income
- $11,188
- Est. tax owed @ 24.0%
- −$2,685
- After-tax cash flow
- $7,852/yr
For passive investors: Depreciation is non-cash, so a rental often shows a tax loss while cash-flowing — sheltering income. Rental losses are passive: they offset passive income freely, and up to $25,000/yr can offset ordinary (W-2) income if you actively participate and your MAGI is under $100k (phasing out to $0 by $150k); unused losses carry forward. On sale, claimed depreciation is recaptured at up to 25%, and gains may owe capital-gains tax (a 1031 exchange can defer both). Figures are a year-1 estimate at your 24.0% rate — not tax advice; consult a CPA.
Schools (NCES district)
- District
- Greeneville
- NCES district ID
- 4701500
- Math proficiency
- 31% ▼ -15.00%
- Reading proficiency
- 34% ▼ -7.00%
- Median HH income
- $32,683
- Composite
- 26.62/100
- National rank
- #7176
- State rank
- #45 of 139 in TN
Livability — Greeneville
- Score
- 66/100
- State rank
- #125
- US rank
- #11825
Category grades
Schools grade is shown separately in the Schools card above.
Census & demographics
- Census place
- Greeneville, TN
- County
- Greene County · 45,638 people
- City population
- 45,638
- Metro
- Greeneville, TN
- Population (ZIP)
- 21,090
- Household income
- $57,159
- Rent vs Own
- Severe rent burden
- 359.0
Population outlook (Greene County) Hauer SSP2
- Today (2025)
- 68,624 people
- By 2030
- 68,114 · -0.7%
- By 2040
- 66,167 · -3.6%
- By 2050
- 63,038 · -8.1%
- By 2075
- 55,274 · -19.5%
- By 2100
- 45,527 · -33.7%
Race, ethnicity, and origin ACS 2023
- Neighborhood character
- Predominantly White (86%)
- Race & ethnicity
- White 86% Hispanic / Latino 8% Two or more races 5% Black 4%
- Hispanic origin (detail)
- Mexican 6%
- Common ancestry
- Slovak 2% Serbian 2% Romanian 1%
- Foreign-born
- 2% · Canada
- Languages at home
- 94% English-only · Spanish 4% Chinese 1%
Political lean MEDSL · Greene
- 2024 margin
- Solid R (+65.7) · D 16.6% · R 82.3% · Other 1.2%
- 2008→2024 swing
- -25.0pp toward R · 2008: -40.7pp · 2024: -65.7pp
- All cycles
- 2024: R+65.7 2020: R+60.7 2016: R+61.0 2012: R+46.0 2008: R+40.7
Not yet ingested
- Civics
- —
Market trends
- HPI YoY
- ▼ -18.99%
- Current HPI
- 295.4621
- Rent YoY
- —
- Metro
- Greeneville, TN
- State GDP YoY
- ▲ 2.78%
- F500 in state
- 22
Industry mix (Fortune 500 HQ in TN)
| Industry | F500 HQs | Revenue |
|---|---|---|
| Healthcare | 3 | $91B |
|
||
| Retail | 3 | $72B |
|
||
| Transportation / Logistics | 1 | $88B |
|
||
| Paper / Packaging | 1 | $19B |
|
||
| Insurance | 1 | $13B |
|
||
| Energy | 1 | $12B |
|
||
Cash-flow waterfall
monthlySold comps — $/sqft
last 12 mo · ≤1 miLoading sold comps…