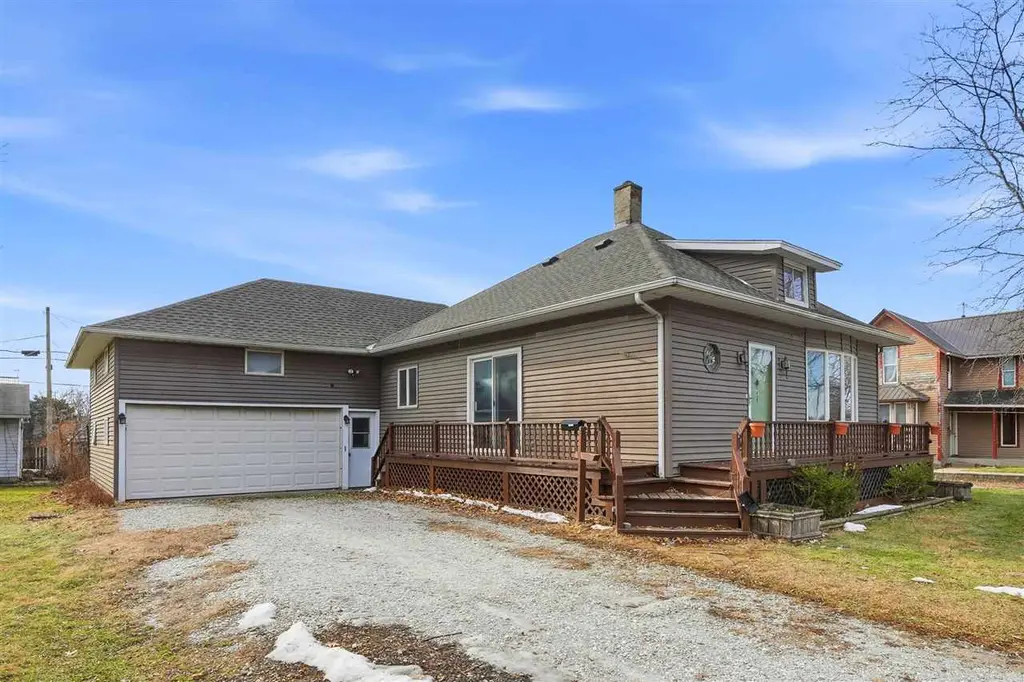
827 W Madison St · Washington, IA
Flood risk 1/10 · Minimal
- FEMA flood zone
- X (unshaded)
- Chance of flooding over 30 yrs
- 0.0%
- Est. flood insurance / yr
- $473 – $860
Fire risk 3/10 · Minor
- Est. fire insurance / yr
- $902 – $1,676
Heat risk 3/10 · Minor
- Hot days now (above 106°F)
- 7 days/yr
- Hot days in 30 yrs
- 16 days/yr
Wind risk 2/10 · Minimal
- Chance of severe wind over 30 yrs
- —
Air-quality risk 2/10 · Minimal
- Unhealthy air days now
- 1 days/yr
- Unhealthy air days in 30 yrs
- 1 days/yr
Risk factors via First Street. Map © Google.
Why this score? — see what drove the C- grade
The composite is a weighted blend of 9 inputs, each scored 0–100. Each bar is that input's sub-score; the figure is the points it added to the 100-point composite (weight × sub-score).
- ARV discount +15.0/15.0
- Cash flow +14.0/30.0
- Schools +4.9/10.0
- 1% rule +4.7/10.0
- DSCR +4.2/10.0
- Livability +4.0/5.0
- Rent growth +2.5/5.0
- Condition / age +2.5/5.0
- Appreciation +0.0/10.0
$139,900
🖨 Deal sheet 📄 Offer letter ✓ Due diligence
Listing remarks MLS
Four-bedroom home with strong potential for remodel or rental investment. The primary bedroom includes a convenient half bath, and laundry is located on the main level. The property offers a functional layout, full basement with usable room, and solid bones ready for updates. Recent improvements include a new roof in 2022 and an updated breaker box in 2023. The home is being sold as is, offering an opportunity for buyers looking to update and add value.
Key facts
- Updated breaker box
- Convenient half bath
- Full basement
Tags
Neighborhood map
What this means for you Summary
Snapshot
- This is a 4-bed/2.5-bath single-family listed at $140k.
Deal economics
- At list price, monthly cash flow is $18 ($215/yr) — positive.
- The deal already cash-flows at list — no discount required.
- To meet the 1% rule (rent ≥ 1% of price), the offer needs to be $136k (2.6% below list).
- Recommended offer: $123k (12.0% below list) — sets the bar for market timing.
- Cap rate 6.4% vs local median 3.2% in Washington — top-decile yield for the area; either an underpriced asset or a hidden risk that comps aren't pricing in. Stress-test before assuming the spread holds.
Location & tenants
- Location reads 79/100 on livability (#114 in IA, #2,173 nationally) — a middle-class / working-renter tenant base. Strengths: cost of living A+, housing A+, health & safety A+; Watch: employment C-, commute F.
- Washington Community School District (town): math 53% / reading 62% proficiency, ranked #254 of 289 in IA (top 88%) — acceptable for families but not a draw, mixed tenant base, ~2y average lease.
- Market conditions: 69 active listings in the ZIP; 42 units permitted in Washington County in 2024 (12 in 5+ unit buildings).
Forward outlook
- Local home prices are declining (-3.0%/yr); year-one equity from $967 of loan paydown is wiped out by about $4k of value loss. Plan a longer hold.
- Washington County population projected at +6% by 2050 — modest demand growth; plan on rents tracking national, not racing it.
Negotiation context
- It's been on market 156 days — a 12% lower offer ($123k) is reasonable based on typical stale-listing flexibility.
- 2 sale attempts since 14y ago with the ask held roughly flat each time — persistent listings suggest the price (not the market) is what's stuck; bring a comps-based counter.
- Current owner paid $77k; list at $140k implies a 82% gain — meaningful room to come down on a strong offer.
Risks & watch-outs
- Watch-outs: built in 1917 — expect roof / HVAC / electrical / plumbing capex.
Questions for the listing agent
- It's been on market 156 days. Have you received any prior offers? Is the seller open to a 12% concession, seller financing, or rate buy-down credit?
- Built in 1917 — when were the roof, HVAC, electrical panel, plumbing, and water heater last replaced?
- Why hasn't it sold? Are there any deal-killer items the seller is aware of (foundation, flood, title, zoning, code violations)?
- Is there a deadline driving the sale (1031 exchange, divorce, estate, relocation)? That informs how much negotiation room exists.
- Schools are B-rated — typically a magnet for longer-tenancy family renters. What's the average tenant stay here, and is there a school-zone premium baked into asking?
- What's the average days-on-market for RENTAL listings here right now (not sales)? A rising rental-DOM trend means longer vacancies and softer asking-rent achievability than the comps imply.
- What's the recent tenant-quality profile in this submarket — average credit score on applications, eviction rate, late-payment / NSF rate, and stable-employment percentage? A property-management company in the area should have these aggregated.
- How much new for-sale + rental construction is in the pipeline within 1–3 miles? Heavy new supply typically softens prices + rents 12–24 months out; constrained supply supports both.
Investment metrics
- 1% rule
- 0.97% ✗
- Cap rate
- 6.45%
- Cash-on-cash
- 0.55%
- DSCR
- 1.02
- GRM
- 8.6
CMA / ARV
- ARV (median comp)
- $167,702
- List price
- $139,900
- Delta
- -16.58%
- Verdict
- UNDERPRICED
- Comps
- 20 within 1.0 mi
Show comp detail 12 sales within ~0.75 mi
| Address | Dist | Beds/Ba | Sqft | Sold | Price | $/sf | Match |
|---|---|---|---|---|---|---|---|
| 827 W Madison St | 0.00mi | 4/2.0 | 1,770 (0%) | 0mo | $131,000 | $74 | 98 |
| 515 W Monroe St | 0.28mi | 3/2.0 (-1) | 1,830 (+3%) | 2mo | $209,900 | $115 | 73 |
| 527 W Madison St | 0.24mi | 4/2.5 | 1,976 (+12%) | 0mo | $230,000 | $116 | 69 |
| 502 S 2nd Ave | 0.65mi | 4/2.0 | 1,728 (-2%) | 2mo | $217,500 | $126 | 62 |
| 415 S Ave D | 0.29mi | 4/1.5 | 1,568 (-11%) | 3mo | $163,000 | $104 | 61 |
| 221 S Ave. D | 0.31mi | 4/1.0 | 1,958 (+11%) | 2mo | $100,000 | $51 | 60 |
| 308 N Avenue C | 0.54mi | 4/2.0 | 1,678 (-5%) | 5mo | $91,000 | $54 | 60 |
| 618 W Main St | 0.30mi | 3/1.0 (-1) | 1,913 (+8%) | 3mo | $157,500 | $82 | 59 |
| 515 W Main St | 0.34mi | 3/1.5 (-1) | 1,660 (-6%) | 10mo | $250,000 | $151 | 56 |
| 839 S Marion Ave | 0.60mi | 4/1.5 | 1,664 (-6%) | 8mo | $118,000 | $71 | 52 |
| 315 W Washington Blvd | 0.41mi | 3/1.5 (-1) | 1,536 (-13%) | 5mo | $196,000 | $128 | 45 |
| 526 S Marion Ave | 0.52mi | 3/1.5 (-1) | 1,536 (-13%) | 9mo | $66,000 | $43 | 37 |
Match score weights: distance 35% · size 25% · config 20% · recency 20%. Top-matched comps best support the ARV.
Projected returns pro-forma
-3.0% appreciation · 3.0% rent growth · sell at horizon
- IRR
- -15.4%
- Equity multiple
- 0.45×
- Total profit
- $-21,451
- Equity at exit
- $20,860
- IRR
- -6.7%
- Equity multiple
- 0.57×
- Total profit
- $-16,897
- Equity at exit
- $12,096
Cash invested: $39,172 (down + closing). Projections, not guarantees.
Landlord ↔ Tenant lean methodology
- Overall (STATE)
- 83 Strongly Landlord-Friendly
- State Iowa
- 83 Strongly Landlord-Friendly · R+6
- County
- — inherits STATE
- City
- — inherits STATE
ZIP-level market 52353
- Home prices YoY
- -9.8%
- Active inventory
- 69
- Price-to-rent
- 8.6×
Monthly cashflow live
- Estimated rent
- $1,362 medium interval (Pro) →
- Mortgage (P&I)
- −$734
- Tax from tax record
- −$266 /mo · $3,194/yr
- Insurance
- −$58
- HOA
- −$0
- Vacancy / Maint / Mgmt
- −$286
- Net cashflow
- $18
Break-even live
UW: 25.0% down · 7.5% · 30yr · 1.5% tax · 5.0% vac · 8.0% maint · 8.0% mgmt
Financing live
Cash to close
- Down payment
- $34,975
- Closing costs
- $4,197
- Reserves months
- —
- Total cash needed
- —
Loan-product check · same deal, 3 products live
Conventional
25% down · 7.5% · 30yr
- Down + closing
- —
- Monthly P&I
- —
- Monthly cashflow
- —
- DSCR
- —
- Eligible?
- —
Personal DTI + credit; lowest rate.
DSCR
20% down · 8.5% · 30yr
- Down + closing
- —
- Monthly P&I
- —
- Monthly cashflow
- —
- DSCR
- —
- Eligible?
- —
No personal income docs; deal must DSCR.
Hard money
10% down · 12.0% · 12mo
- Down + closing
- —
- Monthly P&I
- —
- Monthly cashflow
- —
- DSCR
- —
- Eligible?
- —
Short-term bridge; refi at stabilization.
Listing history 13 events
-
2026-06-13days on market $139,900 Active 156 DOM
-
2026-06-12days on market $139,900 Active 155 DOM
-
2026-06-09days on market $139,900 Active 152 DOM
-
2026-06-08days on market $139,900 Active 151 DOM
-
2026-06-07days on market $139,900 Active 150 DOM
-
2026-06-04days on market $139,900 Active 146 DOM
-
2026-06-02days on market $139,900 Active 145 DOM
-
2026-06-01days on market $139,900 Active 144 DOM
-
2026-05-31days on market $139,900 Active 143 DOM
-
2026-05-31days on market $139,900 Active 142 DOM
-
2026-01-08$139,900 Active 457-char remark
Show marketing remark (457 chars)
Four-bedroom home with strong potential for remodel or rental investment. The primary bedroom includes a convenient half bath, and laundry is located on the main level. The property offers a functional layout, full basement with usable room, and solid bones ready for updates. Recent improvements include a new roof in 2022 and an updated breaker box in 2023. The home is being sold as is, offering an opportunity for buyers looking to update and add value.
-
2012-10-18soldstatus $77,000
-
2012-04-23$79,900
ⓘ Source: listings_history table (triggers on properties + properties_extension) + one-shot
backfill from property_details.listing_events for pre-trigger history.
Tax reassessment forecast IA · Partial reset (capped growth)
- Current annual tax
- $3,194 · $266/mo
- Projected year-2 tax
- $3,194 · $266/mo
- Expected delta
- $0/yr ($0/mo · 0.0%)
ⓘ Screening estimate from a state-policy table — verify with the county assessor before closing.
Climate risk First Street
- Flood 1/10 Low FEMA zone X (unshaded) · 0% chance over 30 yrs
- Wildfire 3/10 Moderate
- Heat 3/10 Moderate 7 d/yr ≥106°F today · 16 d/yr by 30 yrs out
- Wind 2/10 Low
- Air quality 2/10 Low 1 unhealthy d/yr today · 1 by 30 yrs out
Nearby sold comps map
Loading sold comps map…
Walkable amenities ~0.75 mi
Loading nearby amenities…
Taxation est. · year 1
- Rental income
- $16,345
- − Mortgage interest
- −$7,837
- − Property taxes
- −$3,194
- − Insurance
- −$700
- − Repairs & maintenance
- −$1,308
- − Management
- −$1,308
- − Depreciation
- −$4,070
- Taxable loss
- −$2,070
- Est. tax savings @ 24.0%
- +$497
- After-tax cash flow
- $712/yr
For passive investors: Depreciation is non-cash, so a rental often shows a tax loss while cash-flowing — sheltering income. Rental losses are passive: they offset passive income freely, and up to $25,000/yr can offset ordinary (W-2) income if you actively participate and your MAGI is under $100k (phasing out to $0 by $150k); unused losses carry forward. On sale, claimed depreciation is recaptured at up to 25%, and gains may owe capital-gains tax (a 1031 exchange can defer both). Figures are a year-1 estimate at your 24.0% rate — not tax advice; consult a CPA.
Schools (NCES district)
- District
- Washington Community School District
- NCES district ID
- 1930240
- Math proficiency
- 53% ▲ 2.00%
- Reading proficiency
- 62% ▲ 3.00%
- Median HH income
- $49,190
- Composite
- 48.89/100
- National rank
- #2078
- State rank
- #254 of 289 in IA
Livability — Washington
- Score
- 79/100
- State rank
- #114
- US rank
- #2173
Category grades
Schools grade is shown separately in the Schools card above.
Census & demographics
- Census place
- Washington, IA
- City population
- 9,072
- Population (ZIP)
- 9,072
Population outlook (Washington County) Hauer SSP2
- Today (2025)
- 23,102 people
- By 2030
- 23,487 · +1.7%
- By 2040
- 24,164 · +4.6%
- By 2050
- 24,595 · +6.5%
- By 2075
- 25,969 · +12.4%
- By 2100
- 24,700 · +6.9%
Race, ethnicity, and origin ACS 2023
- Neighborhood character
- Predominantly White (84%)
- Race & ethnicity
- White 84% Hispanic / Latino 12% Two or more races 5%
- Hispanic origin (detail)
- Mexican 8%
- Common ancestry
- Slovak 3% Portuguese 2% Romanian 2%
- Foreign-born
- 6% · Canada, China
- Languages at home
- 92% English-only · Spanish 7% Chinese 1%
Political lean MEDSL · Washington
- 2024 margin
- Strong R (+24.4) · D 37.2% · R 61.6% · Other 1.2%
- 2008→2024 swing
- -23.7pp toward R · 2008: -0.7pp · 2024: -24.4pp
- All cycles
- 2024: R+24.4 2020: R+20.5 2016: R+20.6 2012: R+4.2 2008: R+0.7
Not yet ingested
- Civics
- —
Market trends
- HPI YoY
- ▼ -25.25%
- Current HPI
- 231.7933
- Rent YoY
- —
- Metro
- —
- State GDP YoY
- ▲ 2.48%
- F500 in state
- 4
Industry mix (Fortune 500 HQ in IA)
| Industry | F500 HQs | Revenue |
|---|---|---|
| Financial Services | 1 | $16B |
|
||
| Retail / Convenience | 1 | $15B |
|
||
Price history
+75.1% since first listed3 events — show timeline
- 2026-01-08 Listed $139,900 ICAARMLS
- 2012-10-18 Sold (Public Records) $77,000 Public Records
- 2012-04-23 Listed $79,900 ICAARMLS
Property tax history
+4.4%/yrLatest (2025): $3,194 · +2.5% YoY. Source: county tax records.
Cash-flow waterfall
monthlySold comps — $/sqft
last 12 mo · ≤1 miLoading sold comps…