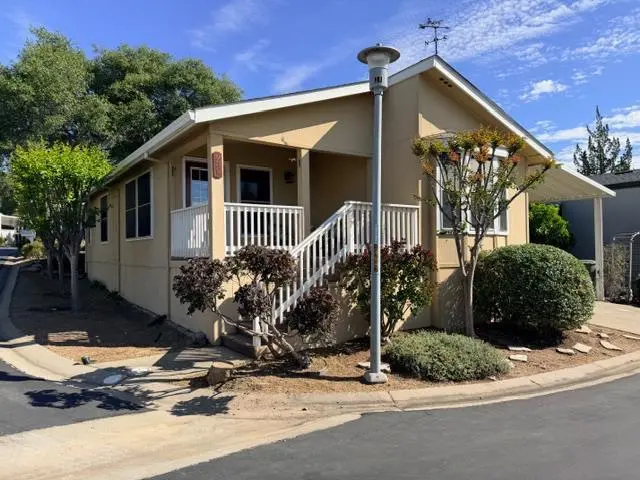
245 Northwood Dr · Folsom, CA
Flood risk 3/10 · Minor
- FEMA flood zone
- X (unshaded)
- Chance of flooding over 30 yrs
- 0.12%
- Est. flood insurance / yr
- $507 – $1,088
Fire risk 3/10 · Minor
- Est. fire insurance / yr
- $659 – $1,223
Heat risk 7/10 · Major
- Hot days now (above 103°F)
- 7 days/yr
- Hot days in 30 yrs
- 15 days/yr
Wind risk 1/10 · Minimal
- Chance of severe wind over 30 yrs
- —
Air-quality risk 10/10 · Severe
- Unhealthy air days now
- 30 days/yr
- Unhealthy air days in 30 yrs
- 38 days/yr
Risk factors via First Street. Map © Google.
Why this score? — see what drove the C grade
The composite is a weighted blend of 9 inputs, each scored 0–100. Each bar is that input's sub-score; the figure is the points it added to the 100-point composite (weight × sub-score).
- Cash flow +27.4/30.0
- DSCR +9.6/10.0
- 1% rule +7.5/10.0
- ARV discount +3.9/15.0
- Livability +3.6/5.0
- Rent growth +2.9/5.0
- Condition / age +2.5/5.0
- Schools +2.4/10.0
- Appreciation +0.0/10.0
$205,950
🖨 Deal sheet 📄 Offer letter ✓ Due diligence
Listing remarks
Newer, Gorgeous Home in Folsom's only 5 Star Senior Park, on 75 acres, Lake w/ fountain, Pool, Spa, Sauna, Huge Game Room, Lots of things to do! Large Living Room w/ Vaulted ceilings, as well as Huge Kitchen w/ vaulted ceilings, Separate Dining room, Indoor laundry, spacious Bedrooms and baths. Space rent $965 mo. Water included. Trash and Sewer about $126mo. So many activities. Plus community garden, RV parking $40mo. , 2 miles of trails, plenty of guest parking. You will love all the activities provided by our Social Club. Rarely does a newer home like this come on the market. Hurry on this one!
Key facts
- Spa
- Sauna
- Community garden
Tags
Property features AI
Finance
- Other: Located at 245 Northwood Dr, Folsom, CA 95630; Directions: Folsom Auburn to Pinebrook Entrance, turn right on Overbrook, left on Northwood to home on right side, across from guest parking.
- Financial info: Land lease: No (listed land lease amount exists but excluded)
- HOA & community: Not part of an association; Senior community; Community has 336 units
Exterior
- Parking: Attached covered parking; Guest parking available
- Utilities: Individual electric meter; Individual gas meter; Natural gas connected; Public water; Public sewer; Electric: Other
- Home design: Manufactured in park; Double wide; Built in 2002
- Construction: Composition roof; Karsten make (mobile home); Skirt: Other
- Exterior features: Carport awning; Porch awning; Storage shed(s); Close to clubhouse; Corner lot
Interior
- Kitchen: Free standing gas range; Dishwasher; Disposal; Microwave; Breakfast area; Pantry cabinet; Laminate countertops
- Bedrooms: 2 bedrooms
- Flooring: Laminate
- Bathrooms: 2 full bathrooms; Double sinks; Shower stall(s)
- Heating & cooling: Central heating; Central cooling; Ceiling fans
- Interior features: Cathedral ceiling; Dual-pane full windows; Porch
- Laundry & utility: Stacked washer and dryer included; Laundry inside
Neighborhood map
What this means for you Summary
Snapshot
- This is a 2-bed/2.0-bath manufactured listed at $206k.
Deal economics
- At list price, monthly cash flow is $604 ($7k/yr) — positive.
- The deal already cash-flows at list — no discount required.
- Meets the 1% rule at list price ($3k rent vs $206k).
- Recommended offer: $200k (3.0% below list) — sets the bar for market timing.
- Cap rate 9.8% vs local median 2.5% in Folsom — top-decile yield for the area; either an underpriced asset or a hidden risk that comps aren't pricing in. Stress-test before assuming the spread holds.
Location & tenants
- Location reads 72/100 on livability (#190 in CA) — a middle-class / working-renter tenant base. Strengths: employment A+, housing A+, schools A; Watch: amenities D, commute F, cost of living F.
- Folsom-Cordova Unified (urban): math 25% / reading 25% proficiency, ranked #365 of 517 in CA (top 71%) — low school quality limits family demand, transient renter base, plan for 1-2y turnover.
- Market conditions: Rents rising (+1.7%/yr); 422 active listings in the ZIP; 3 comparable units currently listed for rent nearby; rentals leasing fast (median 8d on market — plan ~1-2 weeks tenant-placement turnaround); high-income renter base; 6,825 units permitted in Sacramento County in 2024 (1,752 in 5+ unit buildings).
Forward outlook
- Local home prices are declining (-3.0%/yr); year-one equity from $1k of loan paydown is wiped out by about $6k of value loss. Plan a longer hold.
- Sacramento County population projected at +17% by 2050 — long-run rental-demand tailwind backs the buy-and-hold thesis.
Negotiation context
- It's been on market 52 days — a 3% lower offer ($200k) is reasonable based on typical stale-listing flexibility.
Risks & watch-outs
- Climate carrying-cost: extreme-heat days projected 7→15/yr by 2055 (HVAC capex compounding) — expect insurance premiums to compound above CPI over the hold.
Questions for the listing agent
- It's been on market 52 days. Have you received any prior offers? Is the seller open to a 3% concession, seller financing, or rate buy-down credit?
- Is there a deadline driving the sale (1031 exchange, divorce, estate, relocation)? That informs how much negotiation room exists.
- Schools are A-rated — typically a magnet for longer-tenancy family renters. What's the average tenant stay here, and is there a school-zone premium baked into asking?
- What's the average days-on-market for RENTAL listings here right now (not sales)? A rising rental-DOM trend means longer vacancies and softer asking-rent achievability than the comps imply.
- What's the recent tenant-quality profile in this submarket — average credit score on applications, eviction rate, late-payment / NSF rate, and stable-employment percentage? A property-management company in the area should have these aggregated.
- How much new for-sale + rental construction is in the pipeline within 1–3 miles? Heavy new supply typically softens prices + rents 12–24 months out; constrained supply supports both.
Investment metrics
- 1% rule
- 1.25% ✓
- Cap rate
- 9.81%
- Cash-on-cash
- 12.57%
- DSCR
- 1.56
- GRM
- 6.7
CMA / ARV
- ARV (on-the-fly)
- $190,762
- Comps found
- 12
Show comp detail 12 sales within ~0.75 mi
| Address | Dist | Beds/Ba | Sqft | Sold | Price | $/sf | Match |
|---|---|---|---|---|---|---|---|
| 276 Meadowrock Way | 0.05mi | 2/2.0 | 1,344 (+1%) | 1mo | $180,000 | $134 | 96 |
| 155 Leafwood Way | 0.26mi | 2/2.0 | 1,248 (-6%) | 1mo | $185,000 | $148 | 76 |
| 230 Northlake Dr | 0.10mi | 2/1.5 | 1,440 (+8%) | 7mo | $299,500 | $208 | 74 |
| 95 Shadowbrook Ct | 0.20mi | 2/2.0 | 1,440 (+8%) | 4mo | $170,000 | $118 | 74 |
| 320 Stonebrook Dr | 0.20mi | 2/2.0 | 1,440 (+8%) | 5mo | $165,950 | $115 | 73 |
| 330 Stonebrook Dr | 0.20mi | 2/2.0 | 1,440 (+8%) | 7mo | $206,450 | $143 | 72 |
| 294 Danielle Way | 0.58mi | 2/2.0 | 1,344 (+1%) | 8mo | $200,000 | $149 | 65 |
| 440 Nugget | 0.32mi | 2/2.0 | 1,444 (+8%) | 7mo | $219,000 | $152 | 65 |
| 431 Nugget Dr | 0.33mi | 2/2.0 | 1,440 (+8%) | 8mo | $175,000 | $122 | 65 |
| 347 Danielle Way | 0.55mi | 2/2.0 | 1,248 (-6%) | 2mo | $138,000 | $111 | 62 |
| 342 Danielle Way | 0.56mi | 2/2.0 | 1,440 (+8%) | 5mo | $155,000 | $108 | 56 |
| 246 Danielle Way | 0.61mi | 2/2.0 | 1,162 (-13%) | 1mo | $190,000 | $164 | 49 |
Match score weights: distance 35% · size 25% · config 20% · recency 20%. Top-matched comps best support the ARV.
Projected returns pro-forma
-3.0% appreciation · 1.72% rent growth · sell at horizon
- IRR
- 0.9%
- Equity multiple
- 1.03×
- Total profit
- $1,872
- Equity at exit
- $30,708
- IRR
- 9.2%
- Equity multiple
- 1.66×
- Total profit
- $38,271
- Equity at exit
- $17,807
Cash invested: $57,666 (down + closing). Projections, not guarantees.
Landlord ↔ Tenant lean methodology
- Overall (STATE)
- 18 Strongly Tenant-Friendly
- State California
- 18 Strongly Tenant-Friendly · D+13
- County
- — inherits STATE
- City
- — inherits STATE
ZIP-level market 95630
- Rents YoY
- 1.7%
- Active inventory
- 422
- Price-to-rent
- 6.7×
Monthly cashflow live
- Estimated rent
- $2,566 medium interval (Pro) →
- Mortgage (P&I)
- −$1,080
- Tax est. 1.5%
- −$257 /mo · $3,089/yr
- Insurance
- −$86
- HOA
- −$0
- Vacancy / Maint / Mgmt
- −$539
- Net cashflow
- $604
Break-even live
UW: 25.0% down · 7.5% · 30yr · 1.5% tax · 5.0% vac · 8.0% maint · 8.0% mgmt
Financing live
Cash to close
- Down payment
- $51,488
- Closing costs
- $6,178
- Reserves months
- —
- Total cash needed
- —
Loan-product check · same deal, 3 products live
Conventional
25% down · 7.5% · 30yr
- Down + closing
- —
- Monthly P&I
- —
- Monthly cashflow
- —
- DSCR
- —
- Eligible?
- —
Personal DTI + credit; lowest rate.
DSCR
20% down · 8.5% · 30yr
- Down + closing
- —
- Monthly P&I
- —
- Monthly cashflow
- —
- DSCR
- —
- Eligible?
- —
No personal income docs; deal must DSCR.
Hard money
10% down · 12.0% · 12mo
- Down + closing
- —
- Monthly P&I
- —
- Monthly cashflow
- —
- DSCR
- —
- Eligible?
- —
Short-term bridge; refi at stabilization.
Rent comps 3 comps
| Address | Beds | Baths | Sqft | Rent | $/sqft | DOM | Units | Dist |
|---|---|---|---|---|---|---|---|---|
| 340 Caples Dr Folsom, CA | 3.0 | 2.5 | 1423 | $2,795 | $1.96 | 7d | 1 | 1.15mi |
| 288 Marsalla Dr Folsom, CA | 3.0 | 2.0 | 1130 | $2,495 | $2.21 | 43d | 1 | 1.23mi |
| 1600 Canyon Terrace Ln Folsom, CA | 1.0–3.0 | 1.0–2.0 | 955 | $2,348 | $2.46 | 1d | 18 | 1.47mi |
Listing history 1 events
-
2026-05-31status $205,950 Pending 52 DOM
ⓘ Source: listings_history table (triggers on properties + properties_extension) + one-shot
backfill from property_details.listing_events for pre-trigger history.
Climate risk First Street
- Flood 3/10 Moderate FEMA zone X (unshaded) · 12% chance over 30 yrs
- Wildfire 3/10 Moderate
- Heat 7/10 Severe 7 d/yr ≥103°F today · 15 d/yr by 30 yrs out
- Wind 1/10 Low
- Air quality 10/10 Extreme 30 unhealthy d/yr today · 38 by 30 yrs out
Nearby sold comps map
Loading sold comps map…
Walkable amenities ~0.75 mi
Loading nearby amenities…
Taxation est. · year 1
- Rental income
- $30,794
- − Mortgage interest
- −$11,536
- − Property taxes
- −$3,089
- − Insurance
- −$1,030
- − Repairs & maintenance
- −$2,464
- − Management
- −$2,464
- − Depreciation
- −$5,991
- Taxable income
- $4,220
- Est. tax owed @ 24.0%
- −$1,013
- After-tax cash flow
- $6,235/yr
For passive investors: Depreciation is non-cash, so a rental often shows a tax loss while cash-flowing — sheltering income. Rental losses are passive: they offset passive income freely, and up to $25,000/yr can offset ordinary (W-2) income if you actively participate and your MAGI is under $100k (phasing out to $0 by $150k); unused losses carry forward. On sale, claimed depreciation is recaptured at up to 25%, and gains may owe capital-gains tax (a 1031 exchange can defer both). Figures are a year-1 estimate at your 24.0% rate — not tax advice; consult a CPA.
Schools (NCES district)
- District
- Folsom-Cordova Unified
- NCES district ID
- 0613890
- Math proficiency
- 25% ▼ -27.00%
- Reading proficiency
- 25% ▼ -38.00%
- Median HH income
- $75,408
- Composite
- 24.49/100
- National rank
- #7656
- State rank
- #365 of 517 in CA
Livability — Folsom
- Score
- 72/100
- State rank
- #190
- US rank
- #6125
Category grades
Schools grade is shown separately in the Schools card above.
Census & demographics
- Census place
- Folsom, CA
- County
- Sacramento County · 1,539,646 people
- City population
- 79,484
- Metro
- Sacramento-Roseville-Folsom, CA
- Population (ZIP)
- 79,484
- Household income
- $139,642
- Rent vs Own
- Severe rent burden
- 1651.0
Population outlook (Sacramento County) Hauer SSP2
- Today (2025)
- 1,660,763 people
- By 2030
- 1,732,990 · +4.3%
- By 2040
- 1,855,755 · +11.7%
- By 2050
- 1,941,335 · +16.9%
- By 2075
- 2,046,162 · +23.2%
- By 2100
- 1,961,444 · +18.1%
Race, ethnicity, and origin ACS 2023
- Neighborhood character
- Diverse neighborhood (Simpson 0.61)
- Race & ethnicity
- White 58% Asian 20% Hispanic / Latino 13% Two or more races 11% Black 3%
- Hispanic origin (detail)
- Mexican 9% Puerto Rican 1%
- Common ancestry
- Italian 4% Slovak 2% Portuguese 2%
- Foreign-born
- 20% · Canada, China, Vietnam
- Languages at home
- 75% English-only · Other Indo-European 7% Spanish 5% Other Asian/Pacific 5%
Political lean MEDSL · Sacramento
- 2024 margin
- D (+19.7) · D 58.1% · R 38.4% · Other 3.5%
- 2008→2024 swing
- +0.7pp no change · 2008: 19.0pp · 2024: 19.7pp
- All cycles
- 2024: D+19.7 2020: D+25.3 2016: D+23.7 2012: D+16.3 2008: D+19.0
Not yet ingested
- Civics
- —
Market trends
- HPI YoY
- ▼ -240.39%
- Current HPI
- 286.0579
- Rent YoY
- ▲ 1.72%
- Metro
- Sacramento-Roseville-Folsom, CA
- State GDP YoY
- ▲ 3.21%
- F500 in state
- 116
Industry mix (Fortune 500 HQ in CA)
| Industry | F500 HQs | Revenue |
|---|---|---|
| Technology | 27 | $1,492B |
|
||
| Financial Services | 3 | $174B |
|
||
| Retail | 3 | $44B |
|
||
| Insurance | 3 | $26B |
|
||
| Media / Entertainment | 2 | $115B |
|
||
| Pharmaceuticals / Biotech | 2 | $62B |
|
||
Property tax history
-0.9%/yrLatest (2025): $297 · -2.3% YoY. Source: county tax records.
Cash-flow waterfall
monthlySold comps — $/sqft
last 12 mo · ≤1 miLoading sold comps…