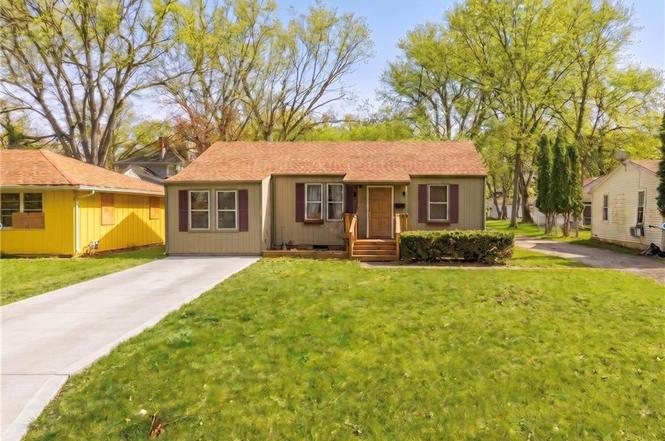
2511 Race Ave · Independence, MO
Flood risk 1/10 · Minimal
- FEMA flood zone
- X (unshaded)
- Chance of flooding over 30 yrs
- 0.0%
- Est. flood insurance / yr
- $507 – $1,088
Fire risk 1/10 · Minimal
- Est. fire insurance / yr
- $1,054 – $1,958
Heat risk 4/10 · Minor
- Hot days now (above 106°F)
- 7 days/yr
- Hot days in 30 yrs
- 17 days/yr
Wind risk 2/10 · Minimal
- Chance of severe wind over 30 yrs
- —
Air-quality risk 3/10 · Minor
- Unhealthy air days now
- 3 days/yr
- Unhealthy air days in 30 yrs
- 3 days/yr
Risk factors via First Street. Map © Google.
Why this score? — see what drove the D+ grade
The composite is a weighted blend of 9 inputs, each scored 0–100. Each bar is that input's sub-score; the figure is the points it added to the 100-point composite (weight × sub-score).
- Cash flow +15.0/30.0
- ARV discount +7.5/15.0
- 1% rule +5.0/10.0
- DSCR +5.0/10.0
- Livability +4.1/5.0
- Rent growth +3.9/5.0
- Schools +2.7/10.0
- Condition / age +2.5/5.0
- Appreciation +0.0/10.0
$30,000
🖨 Deal sheet 📄 Offer letter ✓ Due diligence
Listing remarks
Calling all fans of fixer-uppers! This home is in need of major TLC, so bring your vision and elbow grease and take advantage of this steal of a deal. With an estimated ARV of $190,000, you’re looking at a TON of potential for instant equity! Create the perfect spot just for you or flip it into a cash-flowing rental, close to parks, walking trails, main road/highway access and popular shopping.
Key facts
- 7,816 sq ft lot
- Built 1956
- Listed 4 days
Property features AI
Finance
- Other: Above-grade living area approximately 1,414 (estimated)
- HOA & community: No association fees; No community maintenance provided
Exterior
- Parking: Off-street parking
- Utilities: Public water; Public sewer
- Home design: Single-family ranch home; Residential property
- Construction: Wood siding; Composition roof; Built approximately 51–75 years ago; Slab foundation
- Exterior features: Lot approximately 7,816 square feet; Flood plain status: unknown
Interior
- Bedrooms: 2 bedrooms
- Flooring: Carpet flooring
- Bathrooms: 2 full bathrooms
- Heating & cooling: No heating; No cooling
- Interior features: Eat-in kitchen
- Laundry & utility: Laundry on main level
Neighborhood map
What this means for you Summary
Snapshot
- This is a 2-bed/2.0-bath single-family listed at $30k.
Deal economics
- At list price, monthly cash flow is $750 ($9k/yr) — positive.
- The deal already cash-flows at list — no discount required.
- Meets the 1% rule at list price ($1k rent vs $30k).
- Cap rate 36.3% vs local median 5.0% in Independence — top-decile yield for the area; either an underpriced asset or a hidden risk that comps aren't pricing in. Stress-test before assuming the spread holds.
Location & tenants
- Location reads 82/100 on livability (#10 in MO, #1,296 nationally) — a professional / high-income tenant draw. Strengths: amenities A+, commute A+, cost of living A+; Watch: schools C-, employment D+, crime F.
- Independence 30 (suburban): math 26% / reading 38% proficiency, ranked #252 of 324 in MO (top 78%) — families likely to look elsewhere, expect single-tenant / working-renter base with shorter leases.
- Market conditions: Rents rising fast (+5.4%/yr); 127 active listings in the ZIP; 21 comparable units currently listed for rent nearby; rentals at typical pace (median 21d on market — plan ~3-4 weeks tenant-placement turnaround); 4,002 units permitted in Jackson County in 2024 (2,271 in 5+ unit buildings).
Forward outlook
- Local home prices are declining (-3.0%/yr); year-one equity from $207 of loan paydown is wiped out by about $900 of value loss. Plan a longer hold.
- Jackson County population projected at +4% by 2050 — modest demand growth; plan on rents tracking national, not racing it.
- At projected returns (-3.0% appreciation + 5.4% rent growth), your $8k cash investment doubles in ~2 years — after that, you're playing with house money.
Negotiation context
- Only 4 days on market — expect competitive offers; lowballing is unlikely to land.
Risks & watch-outs
- Watch-outs: property tax is 4.7% of price; built in 1956 — expect roof / HVAC / electrical / plumbing capex.
Questions for the listing agent
- Built in 1956 — when were the roof, HVAC, electrical panel, plumbing, and water heater last replaced?
- Property tax is high relative to price — has the assessment been appealed recently, and will the sale trigger a re-assessment?
- Is there a deadline driving the sale (1031 exchange, divorce, estate, relocation)? That informs how much negotiation room exists.
- Crime grade is F in this area — have there been break-ins, vandalism, or insurance claims at this property in the last 3 years? What carrier currently insures it and at what premium?
- The area grade is low — what's the realistic commute time and amenity access for the typical tenant pool here? Any planned neighborhood developments (good or bad) we should know about?
- What's the average days-on-market for RENTAL listings here right now (not sales)? A rising rental-DOM trend means longer vacancies and softer asking-rent achievability than the comps imply.
- What's the recent tenant-quality profile in this submarket — average credit score on applications, eviction rate, late-payment / NSF rate, and stable-employment percentage? A property-management company in the area should have these aggregated.
- How much new for-sale + rental construction is in the pipeline within 1–3 miles? Heavy new supply typically softens prices + rents 12–24 months out; constrained supply supports both.
Investment metrics
- 1% rule
- 4.38% ✓
- Cap rate
- 36.29%
- Cash-on-cash
- 107.13%
- DSCR
- 5.77
- GRM
- 1.9
CMA / ARV
- ARV (on-the-fly)
- $190,890
- Comps found
- 12
Show comp detail 12 sales within ~0.75 mi
| Address | Dist | Beds/Ba | Sqft | Sold | Price | $/sf | Match |
|---|---|---|---|---|---|---|---|
| 2700 Englewood Ter | 0.15mi | 3/2.0 (+1) | 1,335 (-6%) | 2mo | $205,000 | $154 | 77 |
| 2917 Englewood Ter | 0.42mi | 3/2.0 (+1) | 1,463 (+4%) | 4mo | $196,000 | $134 | 66 |
| 2521 & 2525 Race Ave | 0.05mi | 3/2.0 (+1) | 1,592 (+13%) | 8mo | $100,000 | $63 | 65 |
| 10816 E 27th St | 0.34mi | 3/2.0 (+1) | 1,296 (-8%) | 2mo | $148,000 | $114 | 64 |
| 2320 S Vermont Ave | 0.31mi | 3/2.0 (+1) | 1,260 (-11%) | 1mo | $220,000 | $175 | 62 |
| 2916 S Mason Ave | 0.58mi | 3/2.0 (+1) | 1,517 (+7%) | 3mo | $205,000 | $135 | 53 |
| 1403 W Bryson St | 0.43mi | 3/2.5 (+1) | 1,284 (-9%) | 9mo | $225,000 | $175 | 50 |
| 2005 S Northern Blvd | 0.71mi | 2/1.0 | 1,300 (-8%) | 2mo | $136,900 | $105 | 48 |
| 11105 Sheley Rd | 0.61mi | 3/1.5 (+1) | 1,508 (+7%) | 8mo | $179,900 | $119 | 47 |
| 2020 S Vermont Ave | 0.54mi | 2/2.5 | 1,596 (+13%) | 7mo | $199,000 | $125 | 46 |
| 2916 S Northern Blvd | 0.64mi | 2/1.0 | 1,216 (-14%) | 2mo | $190,000 | $156 | 41 |
| 1218 W 25th Ter S | 0.65mi | 3/2.5 (+1) | 1,600 (+13%) | 7mo | $219,900 | $137 | 34 |
Match score weights: distance 35% · size 25% · config 20% · recency 20%. Top-matched comps best support the ARV.
Projected returns pro-forma
-3.0% appreciation · 5.43% rent growth · sell at horizon
- IRR
- —
- Equity multiple
- 6.51×
- Total profit
- $46,259
- Equity at exit
- $4,473
- IRR
- —
- Equity multiple
- 14.84×
- Total profit
- $116,241
- Equity at exit
- $2,594
Cash invested: $8,400 (down + closing). Projections, not guarantees.
Landlord ↔ Tenant lean methodology
- Overall (STATE)
- 81 Strongly Landlord-Friendly
- State Missouri
- 81 Strongly Landlord-Friendly · R+10
- County
- — inherits STATE
- City
- — inherits STATE
ZIP-level market 64052
- Home prices YoY
- -34.6%
- Rents YoY
- 5.4%
- Active inventory
- 127
- Price-to-rent
- 1.9×
Monthly cashflow live
- Estimated rent
- $1,313 high interval (Pro) →
- Mortgage (P&I)
- −$157
- Tax from tax record
- −$117 /mo · $1,406/yr
- Insurance
- −$12
- HOA
- −$0
- Vacancy / Maint / Mgmt
- −$276
- Net cashflow
- $750
Break-even live
UW: 25.0% down · 7.5% · 30yr · 1.5% tax · 5.0% vac · 8.0% maint · 8.0% mgmt
Financing live
Cash to close
- Down payment
- $7,500
- Closing costs
- $900
- Reserves months
- —
- Total cash needed
- —
Loan-product check · same deal, 3 products live
Conventional
25% down · 7.5% · 30yr
- Down + closing
- —
- Monthly P&I
- —
- Monthly cashflow
- —
- DSCR
- —
- Eligible?
- —
Personal DTI + credit; lowest rate.
DSCR
20% down · 8.5% · 30yr
- Down + closing
- —
- Monthly P&I
- —
- Monthly cashflow
- —
- DSCR
- —
- Eligible?
- —
No personal income docs; deal must DSCR.
Hard money
10% down · 12.0% · 12mo
- Down + closing
- —
- Monthly P&I
- —
- Monthly cashflow
- —
- DSCR
- —
- Eligible?
- —
Short-term bridge; refi at stabilization.
Rent comps 21 comps
| Address | Beds | Baths | Sqft | Rent | $/sqft | DOM | Units | Dist |
|---|---|---|---|---|---|---|---|---|
| 2256 S Sterling Ave Independence, MO | 3.0 | 1.5 | 1284 | $1,399 | $1.09 | 16d | 1 | 0.45mi |
| 10604 E 26th St S Independence, MO | 3.0 | 1.0 | 1068 | $1,610 | $1.51 | 7d | 1 | 0.48mi |
| 2110 S Sterling Ave Independence, MO | 3.0 | 2.0 | 1722 | $1,849 | $1.07 | 16d | 1 | 0.55mi |
| 10817 E 19th Ter S Independence, MO | 3.0 | 1.0 | 1428 | $1,801 | $1.26 | 16d | 1 | 0.71mi |
| 1810 S Vermont Ave Independence, MO | 2.0 | 1.0 | 950 | $948 | $1.00 | 43d | 1 | 0.78mi |
| 11709 E Winner Rd Independence, MO | 3.0 | 1.5 | 1300 | $1,195 | $0.92 | 16d | 1 | 0.85mi |
| 10714 E 19th St S Independence, MO | 2.0 | 1.0 | 1010 | $895 | $0.89 | 3d | 1 | 0.86mi |
| 10323 E 20th St S Independence, MO | 3.0 | 1.0 | 936 | $1,400 | $1.50 | 43d | 1 | 0.88mi |
| 3213 S Ash Ave Independence, MO | 2.0 | 1.0 | 879 | $1,195 | $1.36 | 7d | 1 | 1.04mi |
| 724 S Grand Ave Independence, MO | 2.0 | 2.0 | 1000 | $1,149 | $1.15 | 43d | 1 | 1.05mi |
| 523 S Crysler Ave Unit A Independence, MO | 2.0 | 1.0 | 900 | $650 | $0.72 | 23d | 1 | 1.06mi |
| 11616 E 16th St S Independence, MO | 2.0 | 1.0 | 1016 | $1,125 | $1.11 | 43d | 1 | 1.09mi |
| 9613 E 25th Ter S Independence, MO | 3.0 | 1.0 | 1214 | $1,545 | $1.27 | 23d | 1 | 1.12mi |
| 1502 S Pleasant St Independence, MO | 3.0 | 2.0 | 1200 | $1,399 | $1.17 | 43d | 1 | 1.16mi |
| 1425 S Northern Blvd Independence, MO | 3.0 | 1.5 | 1275 | $1,200 | $0.94 | 7d | 1 | 1.21mi |
| 10119 E Winner Rd Unit 2 Independence, MO | 1.0 | 1.0 | 1000 | $1,045 | $1.04 | 21d | 1 | 1.26mi |
| 11418 E 13th St S Independence, MO | 2.0 | 1.0 | 1760 | $1,100 | $0.62 | 43d | 1 | 1.27mi |
| 2702 S Glenwood Ave Independence, MO | 3.0 | 1.0 | 1056 | $1,555 | $1.47 | 23d | 1 | 1.35mi |
| 321 W South Ave Unit 11 Independence, MO | 3.0 | 2.0 | 1000 | $1,275 | $1.27 | 21d | 1 | 1.38mi |
| 321 W South Ave Unit 9 Independence, MO | 2.0 | 1.5 | 980 | $1,295 | $1.32 | 43d | 1 | 1.38mi |
| 321 W South Ave Unit 8 Independence, MO | 2.0 | 1.5 | 980 | $1,895 | $1.93 | 1d | 1 | 1.38mi |
Listing history 4 events
-
2026-06-16statusdays on market $30,000 Pending 4 DOM
-
2026-06-15days on market $30,000 Active 3 DOM
-
2026-06-13remarks 397-char remark
-
2026-06-13$30,000 Active 1 DOM
ⓘ Source: listings_history table (triggers on properties + properties_extension) + one-shot
backfill from property_details.listing_events for pre-trigger history.
Tax reassessment forecast MO · Resets to sale price
- Current annual tax
- $1,406 · $117/mo
- Projected year-2 tax
- $1,406 · $117/mo
- Expected delta
- $0/yr ($0/mo · 0.0%)
ⓘ Screening estimate from a state-policy table — verify with the county assessor before closing.
Climate risk First Street
- Flood 1/10 Low FEMA zone X (unshaded) · 0% chance over 30 yrs
- Wildfire 1/10 Low
- Heat 4/10 Moderate 7 d/yr ≥106°F today · 17 d/yr by 30 yrs out
- Wind 2/10 Low
- Air quality 3/10 Moderate 3 unhealthy d/yr today · 3 by 30 yrs out
Nearby sold comps map
Loading sold comps map…
Walkable amenities ~0.75 mi
Loading nearby amenities…
Taxation est. · year 1
- Rental income
- $15,750
- − Mortgage interest
- −$1,680
- − Property taxes
- −$1,406
- − Insurance
- −$150
- − Repairs & maintenance
- −$1,260
- − Management
- −$1,260
- − Depreciation
- −$873
- Taxable income
- $9,122
- Est. tax owed @ 24.0%
- −$2,189
- After-tax cash flow
- $6,810/yr
For passive investors: Depreciation is non-cash, so a rental often shows a tax loss while cash-flowing — sheltering income. Rental losses are passive: they offset passive income freely, and up to $25,000/yr can offset ordinary (W-2) income if you actively participate and your MAGI is under $100k (phasing out to $0 by $150k); unused losses carry forward. On sale, claimed depreciation is recaptured at up to 25%, and gains may owe capital-gains tax (a 1031 exchange can defer both). Figures are a year-1 estimate at your 24.0% rate — not tax advice; consult a CPA.
Schools (NCES district)
- District
- Independence 30
- NCES district ID
- 2915480
- Math proficiency
- 26% ▼ -8.00%
- Reading proficiency
- 38% ▼ -5.00%
- Median HH income
- $41,843
- Composite
- 27.04/100
- National rank
- #7054
- State rank
- #252 of 324 in MO
Livability — Independence
- Score
- 82/100
- State rank
- #10
- US rank
- #1296
Category grades
Schools grade is shown separately in the Schools card above.
Census & demographics
- Census place
- Independence, MO
- County
- Jackson County · 687,798 people
- City population
- 117,675
- Metro
- Kansas City, MO-KS
- Population (ZIP)
- 22,138
- Household income
- $59,007
- Rent vs Own
- Severe rent burden
- 965.0
Population outlook (Jackson County) Hauer SSP2
- Today (2025)
- 719,589 people
- By 2030
- 731,456 · +1.6%
- By 2040
- 746,689 · +3.8%
- By 2050
- 749,289 · +4.1%
- By 2075
- 736,227 · +2.3%
- By 2100
- 668,210 · -7.1%
Race, ethnicity, and origin ACS 2023
- Neighborhood character
- Diverse neighborhood (Simpson 0.56)
- Race & ethnicity
- White 62% Hispanic / Latino 23% Two or more races 15% Black 7% Asian 2%
- Hispanic origin (detail)
- Mexican 15%
- Common ancestry
- Italian 12% Slovak 2% Lithuanian 2%
- Foreign-born
- 11% · Canada, China
- Languages at home
- 85% English-only · Spanish 13% Other Asian/Pacific 1%
Political lean MEDSL · Jackson
- 2024 margin
- D (+19.3) · D 58.9% · R 39.5% · Other 1.6%
- 2008→2024 swing
- -6.1pp toward R · 2008: 25.4pp · 2024: 19.3pp
- All cycles
- 2024: D+19.3 2020: D+22.0 2016: D+16.6 2012: D+19.0 2008: D+25.4
Not yet ingested
- Civics
- —
Market trends
- HPI YoY
- ▼ -160.06%
- Current HPI
- 302.1124
- Rent YoY
- ▲ 5.43%
- Metro
- Kansas City, MO-KS
- State GDP YoY
- ▲ 1.84%
- F500 in state
- 20
Industry mix (Fortune 500 HQ in MO)
| Industry | F500 HQs | Revenue |
|---|---|---|
| Healthcare | 1 | $163B |
|
||
| Insurance | 1 | $21B |
|
||
| Industrial Technology | 1 | $17B |
|
||
| Retail | 1 | $16B |
|
||
| Industrial Distribution | 1 | $10B |
|
||
| Utilities | 1 | $9B |
|
||
Price history
1 event — show timeline
- 2026-06-12 Listed $30,000 Heartland MLS as Distributed by MLS Grid
Property tax history
+6.2%/yrLatest (2025): $1,406 · -58.5% YoY. Source: county tax records.
Cash-flow waterfall
monthlySold comps — $/sqft
last 12 mo · ≤1 miLoading sold comps…