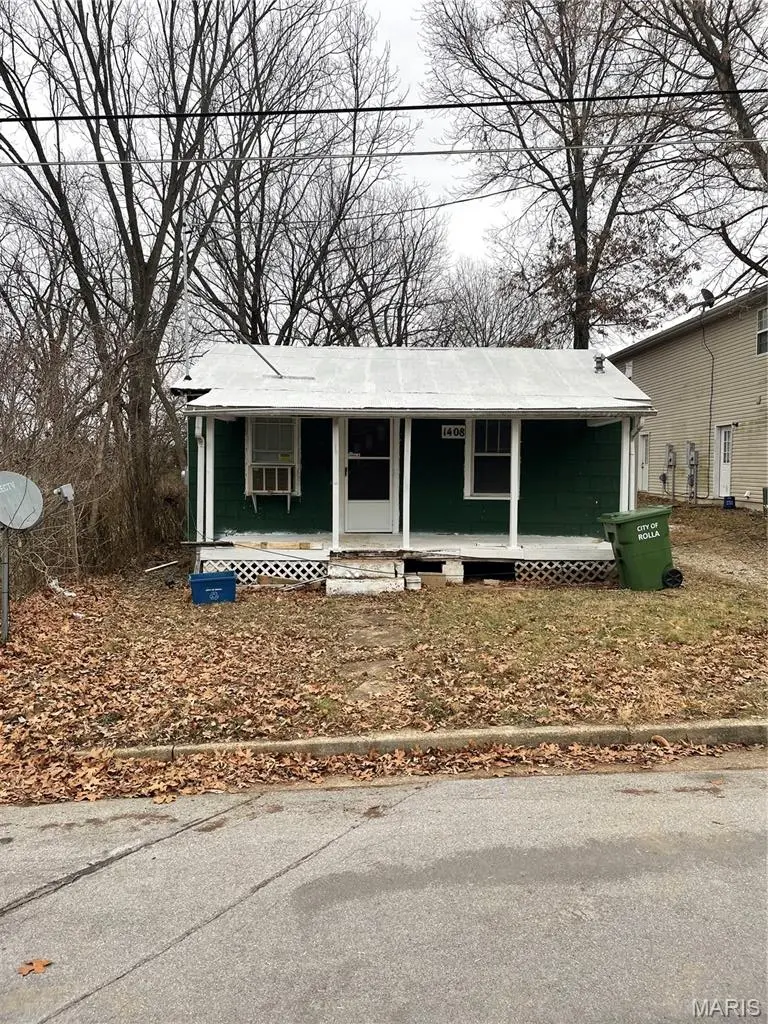
1408 Martin St · Rolla, MO
Flood risk 1/10 · Minimal
- FEMA flood zone
- X (unshaded)
- Chance of flooding over 30 yrs
- 0.0%
- Est. flood insurance / yr
- $507 – $1,088
Fire risk 5/10 · Moderate
- Est. fire insurance / yr
- $1,054 – $1,958
Heat risk 4/10 · Minor
- Hot days now (above 107°F)
- 7 days/yr
- Hot days in 30 yrs
- 19 days/yr
Wind risk 2/10 · Minimal
- Chance of severe wind over 30 yrs
- —
Air-quality risk 1/10 · Minimal
- Unhealthy air days now
- 0 days/yr
- Unhealthy air days in 30 yrs
- 0 days/yr
Risk factors via First Street. Map © Google.
Why this score? — see what drove the B+ grade
The composite is a weighted blend of 9 inputs, each scored 0–100. Each bar is that input's sub-score; the figure is the points it added to the 100-point composite (weight × sub-score).
- Cash flow +30.0/30.0
- ARV discount +15.0/15.0
- DSCR +10.0/10.0
- 1% rule +8.5/10.0
- Rent growth +5.0/5.0
- Livability +3.7/5.0
- Schools +3.6/10.0
- Condition / age +2.5/5.0
- Appreciation +0.0/10.0
$65,000
🖨 Deal sheet 📄 Offer letter ✓ Due diligence
Listing remarks
Constructed in 1942, this distinguished single-family residence , presents a unique opportunity for an investor. this small bungalow has historical charm with contemporary potential. This property offers an exceptional investment opportunity. Call today.
Key facts
- 4,356 sq ft lot
- Built 1942
- Listed 45 days
Property features AI
Finance
- Other: Living area reported as 792; Lot about 0.1 acre
- Financial info: Lease not considered; No second mortgage indicated
Exterior
- Utilities: Public water; Public sewer; Single-phase electric; Cable available; Electricity connected; Propane leased; Sewer connected
- Home design: Single-family residence; One story; Residential property
- Construction: Construction materials: Unknown
- Exterior features: Back yard
Interior
- Kitchen: Gas range; Refrigerator
- Bedrooms: 1 bedroom on the main level
- Bathrooms: 1 full bathroom on the main level
- Heating & cooling: Other heating; Wall-mounted cooling unit(s)
- Interior features: Crawl space basement; 4 total rooms
- Laundry & utility: Washer and dryer included
Neighborhood map
What this means for you Summary
Snapshot
- This is a 2-bed/1.0-bath single-family listed at $65k.
Deal economics
- At list price, monthly cash flow is $306 ($4k/yr) — positive.
- The deal already cash-flows at list — no discount required.
- Meets the 1% rule at list price ($880 rent vs $65k).
- Recommended offer: $63k (3.0% below list) — sets the bar for market timing.
- Cap rate 11.9% vs local median 3.5% in Rolla — top-decile yield for the area; either an underpriced asset or a hidden risk that comps aren't pricing in. Stress-test before assuming the spread holds.
Location & tenants
- Location reads 73/100 on livability (#76 in MO) — a middle-class / working-renter tenant base. Strengths: cost of living A+, health & safety A+, housing A-; Watch: crime D, commute F, employment D-.
- Rolla 31 (town): math 38% / reading 48% proficiency, ranked #118 of 324 in MO (top 36%) — families likely to look elsewhere, expect single-tenant / working-renter base with shorter leases.
- Zoned schools: Harry S. Truman Elem. (math 42% / reading 47%, grade F, #413 of 1,115 statewide, top 42%, 431 students, 51% FRL); Rolla Sr. High (math 25% / reading 61%, grade F, #211 of 521 statewide, top 41%, 1,323 students, 34% FRL) — zoned schools at 42% FRL track the district average.
- Market conditions: Rents rising fast (+10.2%/yr); 268 active listings in the ZIP; 2 comparable units currently listed for rent nearby; 162 units permitted in Phelps County in 2024 (83 in 5+ unit buildings).
Forward outlook
- Local home prices are declining (-3.0%/yr); year-one equity from $449 of loan paydown is wiped out by about $2k of value loss. Plan a longer hold.
- Phelps County population projected at -12% by 2050 — secular population decline; favor cash flow + early exit over multi-decade hold.
- At projected returns (-3.0% appreciation + 8.0% rent growth), your $18k cash investment doubles in ~5 years — after that, you're playing with house money.
Negotiation context
- It's been on market 46 days — a 3% lower offer ($63k) is reasonable based on typical stale-listing flexibility.
Risks & watch-outs
- Watch-outs: built in 1942 — expect roof / HVAC / electrical / plumbing capex.
- Climate carrying-cost: moderate wildfire risk — expect insurance premiums to compound above CPI over the hold.
Questions for the listing agent
- It's been on market 46 days. Have you received any prior offers? Is the seller open to a 3% concession, seller financing, or rate buy-down credit?
- Built in 1942 — when were the roof, HVAC, electrical panel, plumbing, and water heater last replaced?
- Is there a deadline driving the sale (1031 exchange, divorce, estate, relocation)? That informs how much negotiation room exists.
- Schools are B-rated — typically a magnet for longer-tenancy family renters. What's the average tenant stay here, and is there a school-zone premium baked into asking?
- Crime grade is D in this area — have there been break-ins, vandalism, or insurance claims at this property in the last 3 years? What carrier currently insures it and at what premium?
- What's the average days-on-market for RENTAL listings here right now (not sales)? A rising rental-DOM trend means longer vacancies and softer asking-rent achievability than the comps imply.
- What's the recent tenant-quality profile in this submarket — average credit score on applications, eviction rate, late-payment / NSF rate, and stable-employment percentage? A property-management company in the area should have these aggregated.
- How much new for-sale + rental construction is in the pipeline within 1–3 miles? Heavy new supply typically softens prices + rents 12–24 months out; constrained supply supports both.
Investment metrics
- 1% rule
- 1.35% ✓
- Cap rate
- 11.95%
- Cash-on-cash
- 20.19%
- DSCR
- 1.90
- GRM
- 6.2
CMA / ARV
- ARV (median comp)
- $88,229
- List price
- $65,000
- Delta
- -26.33%
- Verdict
- UNDERPRICED
- Comps
- 20 within 1.0 mi
Show comp detail 10 sales within ~0.75 mi
| Address | Dist | Beds/Ba | Sqft | Sold | Price | $/sf | Match |
|---|---|---|---|---|---|---|---|
| 1506 Heller St | 0.07mi | 2/1.0 | 784 (-1%) | 3mo | $147,000 | $188 | 92 |
| 1307 Gulf Ave | 0.08mi | 2/1.0 | 704 (-11%) | 2mo | $25,000 | $36 | 76 |
| 803 East 14th St | 0.20mi | 2/1.0 | 832 (+5%) | 14mo | $160,000 | $192 | 71 |
| 1501 Spencer St | 0.12mi | 2/1.0 | 750 (-5%) | 22mo | $115,000 | $153 | 67 |
| 1401 Ozark St | 0.24mi | 2/1.0 | 840 (+6%) | 14mo | $139,900 | $167 | 67 |
| 721 E 12th St | 0.27mi | 2/1.0 | 888 (+12%) | 1mo | $145,000 | $163 | 66 |
| 804 E 5th St | 0.57mi | 2/1.0 | 792 (0%) | 9mo | $130,000 | $164 | 66 |
| 1609 Martin St | 0.12mi | 3/1.0 (+1) | 884 (+12%) | 17mo | $150,900 | $171 | 56 |
| 710 E 6th St | 0.54mi | 2/1.0 | 900 (+14%) | 10mo | $127,000 | $141 | 43 |
| 808 E 5th St | 0.56mi | 2/1.0 | 900 (+14%) | 19mo | $119,000 | $132 | 36 |
Match score weights: distance 35% · size 25% · config 20% · recency 20%. Top-matched comps best support the ARV.
Projected returns pro-forma
-3.0% appreciation · 8.0% rent growth · sell at horizon
- IRR
- 17.5%
- Equity multiple
- 1.75×
- Total profit
- $13,595
- Equity at exit
- $9,692
- IRR
- 29.1%
- Equity multiple
- 4.19×
- Total profit
- $58,012
- Equity at exit
- $5,620
Cash invested: $18,200 (down + closing). Projections, not guarantees.
Landlord ↔ Tenant lean methodology
- Overall (STATE)
- 81 Strongly Landlord-Friendly
- State Missouri
- 81 Strongly Landlord-Friendly · R+10
- County
- — inherits STATE
- City
- — inherits STATE
ZIP-level market 65401
- Home prices YoY
- -26.4%
- Rents YoY
- 10.2%
- Active inventory
- 268
- Price-to-rent
- 6.2×
Monthly cashflow live
- Estimated rent
- $880 medium interval (Pro) →
- Mortgage (P&I)
- −$341
- Tax from tax record
- −$21 /mo · $249/yr
- Insurance
- −$27
- HOA
- −$0
- Vacancy / Maint / Mgmt
- −$185
- Net cashflow
- $306
Break-even live
UW: 25.0% down · 7.5% · 30yr · 1.5% tax · 5.0% vac · 8.0% maint · 8.0% mgmt
Financing live
Cash to close
- Down payment
- $16,250
- Closing costs
- $1,950
- Reserves months
- —
- Total cash needed
- —
Loan-product check · same deal, 3 products live
Conventional
25% down · 7.5% · 30yr
- Down + closing
- —
- Monthly P&I
- —
- Monthly cashflow
- —
- DSCR
- —
- Eligible?
- —
Personal DTI + credit; lowest rate.
DSCR
20% down · 8.5% · 30yr
- Down + closing
- —
- Monthly P&I
- —
- Monthly cashflow
- —
- DSCR
- —
- Eligible?
- —
No personal income docs; deal must DSCR.
Hard money
10% down · 12.0% · 12mo
- Down + closing
- —
- Monthly P&I
- —
- Monthly cashflow
- —
- DSCR
- —
- Eligible?
- —
Short-term bridge; refi at stabilization.
Rent comps 2 comps
| Address | Beds | Baths | Sqft | Rent | $/sqft | DOM | Units | Dist |
|---|---|---|---|---|---|---|---|---|
| 2099 Vienna Rd Unit D Rolla, MO | 2.0 | 1.0 | 750 | $950 | $1.27 | 43d | 1 | 0.93mi |
| 701 N State St Unit B Rolla, MO | 3.0 | 2.0 | 1100 | $850 | $0.77 | 43d | 1 | 0.99mi |
Listing history 17 events
-
2026-06-19days on market $65,000 Active 46 DOM
-
2026-06-18days on market $65,000 Active 45 DOM
-
2026-06-17days on market $65,000 Active 44 DOM
-
2026-06-16days on market $65,000 Active 43 DOM
-
2026-06-15days on market $65,000 Active 42 DOM
-
2026-06-14days on market $65,000 Active 40 DOM
-
2026-06-12days on market $65,000 Active 39 DOM
-
2026-06-09days on market $65,000 Active 36 DOM
-
2026-06-08days on market $65,000 Active 35 DOM
-
2026-06-07days on market $65,000 Active 34 DOM
-
2026-06-02days on market $65,000 Active 29 DOM
-
2026-06-01days on market $65,000 Active 28 DOM
-
2026-05-31days on market $65,000 Active 27 DOM
-
2026-05-30days on market $65,000 Active 26 DOM
-
2026-05-05$65,000 Active 254-char remark
-
2026-05-04historical $65,000 254-char remark
-
2004-08-26soldstatus
ⓘ Source: listings_history table (triggers on properties + properties_extension) + one-shot
backfill from property_details.listing_events for pre-trigger history.
Tax reassessment forecast MO · Resets to sale price
- Current annual tax
- $249 · $21/mo
- Projected year-2 tax
- $630 · $53/mo
- Expected delta
- +$382/yr (+$32/mo · 153.3%)
ⓘ Screening estimate from a state-policy table — verify with the county assessor before closing.
Climate risk First Street
- Flood 1/10 Low FEMA zone X (unshaded) · 0% chance over 30 yrs
- Wildfire 5/10 Major
- Heat 4/10 Moderate 7 d/yr ≥107°F today · 19 d/yr by 30 yrs out
- Wind 2/10 Low
- Air quality 1/10 Low 0 unhealthy d/yr today · 0 by 30 yrs out
Nearby sold comps map
Loading sold comps map…
Walkable amenities ~0.75 mi
Loading nearby amenities…
Taxation est. · year 1
- Rental income
- $10,556
- − Mortgage interest
- −$3,641
- − Property taxes
- −$249
- − Insurance
- −$325
- − Repairs & maintenance
- −$844
- − Management
- −$844
- − Depreciation
- −$1,891
- Taxable income
- $2,761
- Est. tax owed @ 24.0%
- −$663
- After-tax cash flow
- $3,012/yr
For passive investors: Depreciation is non-cash, so a rental often shows a tax loss while cash-flowing — sheltering income. Rental losses are passive: they offset passive income freely, and up to $25,000/yr can offset ordinary (W-2) income if you actively participate and your MAGI is under $100k (phasing out to $0 by $150k); unused losses carry forward. On sale, claimed depreciation is recaptured at up to 25%, and gains may owe capital-gains tax (a 1031 exchange can defer both). Figures are a year-1 estimate at your 24.0% rate — not tax advice; consult a CPA.
Schools (NCES district)
- District
- Rolla 31
- NCES district ID
- 2926890
- Math proficiency
- 38% ▼ -9.00%
- Reading proficiency
- 48% ▼ -7.00%
- Median HH income
- $40,057
- Composite
- 36.0/100
- National rank
- #4786
- State rank
- #118 of 324 in MO
Livability — Rolla
- Score
- 73/100
- State rank
- #76
- US rank
- #5115
Category grades
Schools grade is shown separately in the Schools card above.
Census & demographics
- Census place
- Rolla, MO
- County
- Phelps County · 42,017 people
- City population
- 32,714
- Metro
- Rolla, MO
- Population (ZIP)
- 32,714
- Household income
- $56,081
- Rent vs Own
- Severe rent burden
- 1122.0
Population outlook (Phelps County) Hauer SSP2
- Today (2025)
- 44,188 people
- By 2030
- 43,524 · -1.5%
- By 2040
- 41,211 · -6.7%
- By 2050
- 38,977 · -11.8%
- By 2075
- 33,846 · -23.4%
- By 2100
- 27,828 · -37.0%
Race, ethnicity, and origin ACS 2023
- Neighborhood character
- Predominantly White (84%)
- Race & ethnicity
- White 84% Two or more races 6% Asian 4% Hispanic / Latino 3% Black 3%
- Common ancestry
- Lithuanian 4% Italian 2% Slovak 2%
- Foreign-born
- 6% · China, Canada
- Languages at home
- 93% English-only · Chinese 2% Spanish 1% Other Indo-European 1%
Political lean MEDSL · Phelps
- 2024 margin
- Solid R (+42.9) · D 27.9% · R 70.8% · Other 1.3%
- 2008→2024 swing
- -20.7pp toward R · 2008: -22.2pp · 2024: -42.9pp
- All cycles
- 2024: R+42.9 2020: R+40.1 2016: R+42.9 2012: R+33.5 2008: R+22.2
Not yet ingested
- Civics
- —
Market trends
- HPI YoY
- ▼ -61.69%
- Current HPI
- 172.421
- Rent YoY
- ▲ 10.25%
- Metro
- Rolla, MO
- State GDP YoY
- ▲ 1.84%
- F500 in state
- 20
Industry mix (Fortune 500 HQ in MO)
| Industry | F500 HQs | Revenue |
|---|---|---|
| Healthcare | 1 | $163B |
|
||
| Insurance | 1 | $21B |
|
||
| Industrial Technology | 1 | $17B |
|
||
| Retail | 1 | $16B |
|
||
| Industrial Distribution | 1 | $10B |
|
||
| Utilities | 1 | $9B |
|
||
Price history
+0.0% since first listed3 events — show timeline
- 2026-05-05 Listed $65,000 MARIS as Distributed by MLS Grid
- 2026-05-04 Coming Soon $65,000 MARIS as Distributed by MLS Grid
- 2004-08-26 Sold (Public Records) — Public Records
Property tax history
+3.0%/yrLatest (2025): $249 · +3.8% YoY. Source: county tax records.
Cash-flow waterfall
monthlySold comps — $/sqft
last 12 mo · ≤1 miLoading sold comps…