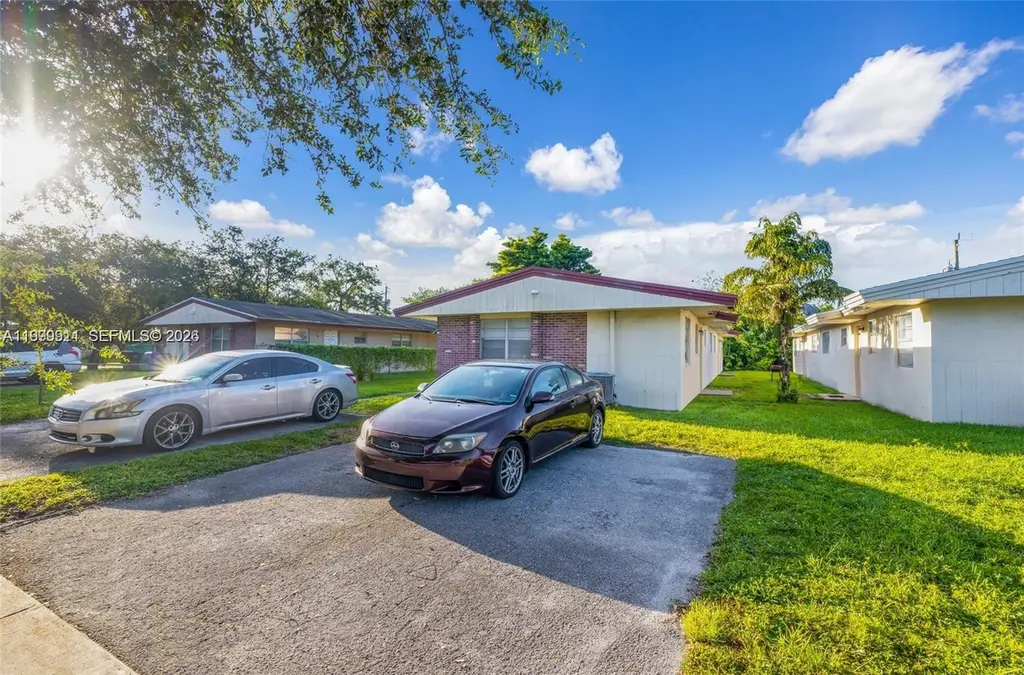
 Duplex
5706 Lincoln St · Hollywood, FL
Flood risk 1/10 · Minimal
- FEMA flood zone
- X (shaded)
- Chance of flooding over 30 yrs
- 0.0%
- Est. flood insurance / yr
- $507 – $1,088
Fire risk 1/10 · Minimal
- Est. fire insurance / yr
- $947 – $1,759
Heat risk 10/10 · Severe
- Hot days now (above 105°F)
- 7 days/yr
- Hot days in 30 yrs
- 28 days/yr
Wind risk 10/10 · Severe
- Chance of severe wind over 30 yrs
- 99.0%
Air-quality risk 2/10 · Minimal
- Unhealthy air days now
- 2 days/yr
- Unhealthy air days in 30 yrs
- 2 days/yr
Risk factors via First Street. Map © Google.
Why this score? — see what drove the F grade
The composite is a weighted blend of 9 inputs, each scored 0–100. Each bar is that input's sub-score; the figure is the points it added to the 100-point composite (weight × sub-score).
- Cash flow +8.8/30.0
- ARV discount +7.5/15.0
- Schools +4.1/10.0
- Livability +3.8/5.0
- Rent growth +3.1/5.0
- 1% rule +2.6/10.0
- Condition / age +2.5/5.0
- DSCR +2.4/10.0
- Appreciation +0.0/10.0
$599,000
🖨 Deal sheet 📄 Offer letter ✓ Due diligence
Multi-family units
County records classify this as Multi-Family (2-4 Unit). Listing-text estimate: 2 units. confirmed
Listing remarks
Unique investment opportunity in Central Hollywood! This well-maintained duplex features two spacious 2-bedroom, 2-bathroom units, each leased at $2,000/month ($4,000 total) with leases in place through March 2027, providing strong and stable cash flow. Each unit is equipped with separate electric meters and central A/C, adding efficiency and tenant appeal. The property offers upside potential through future rent increases, ample on-site parking, and is ideally located near the Florida's Turnpike, Interstate 95, and the Seminole Hard Rock Hotel & Casino, making it a prime income-producing asset in a high-demand rental area.
Key facts
- Central a/c
- 4 parking spots
- Built 1974
Tags
Property features AI
Finance
- Other: Rent includes gardener, hot water, pest control, sewer, trash collection and water
- Financial info: Each unit currently shows $2,000 monthly rent; Units indicated as leased
Exterior
- Parking: Total of 4 parking spaces; Parking spaces for units
- Utilities: Cable available; Septic tank
- Home design: Single-story property; Resale
- Construction: Block construction; Shingle roof
- Exterior features: Less than quarter acre lot; Zoned RM-9
Interior
- Bedrooms: Two 2-bedroom units (each unit has 2 bedrooms)
- Flooring: Tile
- Bathrooms: Each unit has 2 full bathrooms
- Heating & cooling: Central heating; Central air conditioning
- Interior features: Tile flooring; Florida room
Neighborhood map
What this means for you Summary
Snapshot
- This is a 2 × 2-bed/2.0-bath units multifamily listed at $599k.
Deal economics
- At list price, monthly cash flow is $-490 ($-6k/yr) — negative. Per door: $-245/mo.
- To cash-flow at today's rent, offer at most $512k (14.5% below list).
- To meet the 1% rule (rent ≥ 1% of price), the offer needs to be $457k (23.6% below list).
- Recommended offer: $457k (23.6% below list) — sets the bar for 1% rule.
- Cap rate 5.3% vs local median 3.2% in Hollywood — top-decile yield for the area; either an underpriced asset or a hidden risk that comps aren't pricing in. Stress-test before assuming the spread holds.
Location & tenants
- Location reads 76/100 on livability (#232 in FL, #3,548 nationally) — a middle-class / working-renter tenant base. Strengths: commute A+, housing A+, crime B+; Watch: amenities D.
- Broward (suburban): math 42% / reading 53% proficiency, ranked #46 of 73 in FL (top 63%) — families likely to look elsewhere, expect single-tenant / working-renter base with shorter leases.
- Market conditions: Rents rising (+2.4%/yr); 529 active listings in the ZIP; 40 comparable units currently listed for rent nearby; rentals at typical pace (median 18d on market — plan ~3-4 weeks tenant-placement turnaround); 2,111 units permitted in Broward County in 2024 (1,265 in 5+ unit buildings).
- At $4,574/mo this rent would consume 77% of the median local household income ($71k/yr) (locally 2151% of renters already pay >50% of income on rent) — very limited rent-growth headroom before tenants either downsize or default.
Forward outlook
- Local home prices are declining (-3.0%/yr); year-one equity from $4k of loan paydown is wiped out by about $18k of value loss. Plan a longer hold.
- Broward County population projected at +34% by 2050 — long-run rental-demand tailwind backs the buy-and-hold thesis.
Negotiation context
- It's been on market 64 days — a 6% lower offer ($563k) is reasonable based on typical stale-listing flexibility.
- 2 sale attempts since 2y ago with the ask held roughly flat each time — persistent listings suggest the price (not the market) is what's stuck; bring a comps-based counter.
- Current owner paid $52k; list at $599k implies a 1052% gain — meaningful room to come down on a strong offer.
Risks & watch-outs
- Climate carrying-cost: severe wind risk, 99% chance of damaging wind over 30y; extreme-heat days projected 7→28/yr by 2055 (HVAC capex compounding) — expect insurance premiums to compound above CPI over the hold.
Questions for the listing agent
- What do current leases actually rent for vs. the listed asking? Can we see a recent rent roll and the last 12 months of T-12 income?
- It's been on market 64 days. Have you received any prior offers? Is the seller open to a 24% concession, seller financing, or rate buy-down credit?
- Can we see the unit-by-unit rent roll, current vacancy, and any below-market leases? What's the average tenancy length?
- What capital expenditures (roof, boiler, parking lot, exteriors) have been made in the last 5 years, and what's planned in the next 2?
- Built in 1974 — when were the roof, HVAC, electrical panel, plumbing, and water heater last replaced?
- Why hasn't it sold? Are there any deal-killer items the seller is aware of (foundation, flood, title, zoning, code violations)?
- Is there a deadline driving the sale (1031 exchange, divorce, estate, relocation)? That informs how much negotiation room exists.
- The area grade is low — what's the realistic commute time and amenity access for the typical tenant pool here? Any planned neighborhood developments (good or bad) we should know about?
- What's the average days-on-market for RENTAL listings here right now (not sales)? A rising rental-DOM trend means longer vacancies and softer asking-rent achievability than the comps imply.
- What's the recent tenant-quality profile in this submarket — average credit score on applications, eviction rate, late-payment / NSF rate, and stable-employment percentage? A property-management company in the area should have these aggregated.
- How much new apartment / multifamily construction is in the pipeline within 1–3 miles? Heavy new supply (>2% of stock underway) typically softens rents 12–24 months out; light construction supports rent growth.
Investment metrics
- 1% rule
- 0.76% ✗
- Cap rate
- 5.31%
- Cash-on-cash
- -3.51%
- DSCR
- 0.84
- GRM
- 10.9
CMA / ARV
No comps found within radius.
Projected returns pro-forma
-3.0% appreciation · 2.41% rent growth · sell at horizon
- IRR
- -22.8%
- Equity multiple
- 0.22×
- Total profit
- $-130,956
- Equity at exit
- $89,313
- IRR
- -18.8%
- Equity multiple
- 0.02×
- Total profit
- $-165,015
- Equity at exit
- $51,791
Cash invested: $167,720 (down + closing). Projections, not guarantees.
Landlord ↔ Tenant lean methodology
- Overall (STATE)
- 87 Strongly Landlord-Friendly
- State Florida
- 87 Strongly Landlord-Friendly · R+3
- County
- — inherits STATE
- City
- — inherits STATE
ZIP-level market 33021
- Rents YoY
- 2.4%
- Active inventory
- 529
- Price-to-rent
- 21.8×
Monthly cashflow live
- Estimated rent
- $4,574 high interval (Pro) →
- Mortgage (P&I)
- −$3,141
- Tax from tax record
- −$713 /mo · $8,558/yr
- Insurance
- −$250
- HOA
- −$0
- Vacancy / Maint / Mgmt
- −$961
- Net cashflow
- $-490
Break-even live
2-unit breakdown (identical units grouped — click to expand)
| Units | Beds | Baths | Est. rent |
|---|---|---|---|
| 2× units | 2 | 2 | $4,574 |
| #1 | 2 | 2 | $2,287 |
| #2 | 2 | 2 | $2,287 |
| Total (2 units) | $4,574 | ||
UW: 25.0% down · 7.5% · 30yr · 1.5% tax · 5.0% vac · 8.0% maint · 8.0% mgmt
Financing live
Cash to close
- Down payment
- $149,750
- Closing costs
- $17,970
- Reserves months
- —
- Total cash needed
- —
Loan-product check · same deal, 3 products live
Conventional
25% down · 7.5% · 30yr
- Down + closing
- —
- Monthly P&I
- —
- Monthly cashflow
- —
- DSCR
- —
- Eligible?
- —
Personal DTI + credit; lowest rate.
DSCR
20% down · 8.5% · 30yr
- Down + closing
- —
- Monthly P&I
- —
- Monthly cashflow
- —
- DSCR
- —
- Eligible?
- —
No personal income docs; deal must DSCR.
Hard money
10% down · 12.0% · 12mo
- Down + closing
- —
- Monthly P&I
- —
- Monthly cashflow
- —
- DSCR
- —
- Eligible?
- —
Short-term bridge; refi at stabilization.
Rent comps 40 comps
| Address | Beds | Baths | Sqft | Rent | $/sqft | DOM | Units | Dist |
|---|---|---|---|---|---|---|---|---|
| 5743 Lincoln St Unit 1 Hollywood, FL | 2.0 | 1.0 | 1728 | $2,250 | $1.30 | 17d | 1 | 0.09mi |
| 910 N 56th Ave Unit 1 Hollywood, FL | 2.0 | 1.0 | 1640 | $1,950 | $1.19 | 7d | 1 | 0.15mi |
| 630 N 58th Ave Hollywood, FL | 2.0 | 1.0 | 2208 | $2,100 | $0.95 | 7d | 1 | 0.15mi |
| 5815 Lincoln St Unit B Hollywood, FL | 3.0 | 3.0 | 1475 | $3,200 | $2.17 | 5d | 1 | 0.15mi |
| 5749-5753 Grant St Hollywood, FL | 2.0 | 1.0 | 2141 | $2,200 | $1.03 | 13d | 1 | 0.16mi |
| 5640 Hayes St Unit 5640 Hollywood, FL | 3.0 | 3.0 | 1568 | $3,200 | $2.04 | 24d | 1 | 0.17mi |
| 5820 Grant St Unit Back Hollywood, FL | 2.0 | 1.0 | 2524 | $2,000 | $0.79 | 7d | 1 | 0.19mi |
| 5820 Grant St Unit Back Hollywood, FL | 2.0 | 1.0 | 2524 | $2,000 | $0.79 | 24d | 1 | 0.19mi |
| 5735 Hayes St Unit 5735 Hollywood, FL | 3.0 | 2.0 | 2357 | $3,500 | $1.48 | 4d | 1 | 0.23mi |
| 5735 Hayes St Hollywood, FL | 3.0 | 2.0 | 2357 | $3,500 | $1.48 | 17d | 1 | 0.23mi |
| 5735 Hayes St Hollywood, FL | 3.0 | 2.0 | 2357 | $3,500 | $1.48 | 2d | 1 | 0.23mi |
| 5421 Buchanan St Hollywood, FL | 3.0 | 2.0 | 2020 | $6,500 | $3.22 | 24d | 1 | 0.24mi |
| 410 N 58th Ave #408 Hollywood, FL | 1.0 | 1.0 | 1705 | $1,450 | $0.85 | 24d | 1 | 0.28mi |
| 410 N 58th Ave #408 Hollywood, FL | 1.0 | 1.0 | 1705 | $1,450 | $0.85 | 2d | 1 | 0.28mi |
| 5605 Taylor St Unit 1 Hollywood, FL | 1.0 | 1.0 | 1400 | $2,100 | $1.50 | 15d | 1 | 0.29mi |
| 5914 Taylor St Unit 1-2 Hollywood, FL | 3.0 | 2.0 | 2250 | $2,750 | $1.22 | 20d | 1 | 0.40mi |
| 6021 Polk St Unit 4 Hollywood, FL | 1.0 | 1.0 | 2266 | $1,400 | $0.62 | 17d | 1 | 0.49mi |
| 201 Columbus Pkwy Unit A Hollywood, FL | 1.0 | 1.0 | 1662 | $2,350 | $1.41 | 15d | 1 | 0.50mi |
| 201 Columbus Pkwy Unit A Hollywood, FL | 1.0 | 1.0 | 1662 | $1,850 | $1.11 | 4d | 1 | 0.50mi |
| 201 Columbus Pkwy Unit B Hollywood, FL | 1.0 | 1.0 | 1662 | $2,050 | $1.23 | 2d | 1 | 0.50mi |
| 1112 N 61st Ave Unit B Hollywood, FL | 1.0 | 1.0 | 2984 | $1,600 | $0.54 | 7d | 1 | 0.52mi |
| 1112 N 61st Ave Unit B Hollywood, FL | 1.0 | 1.0 | 2984 | $1,700 | $0.57 | 24d | 1 | 0.52mi |
| 321 E Chaminade Dr Hollywood, FL | 3.0 | 2.0 | 1591 | $4,200 | $2.64 | 24d | 1 | 0.53mi |
| 414 NW 60th Way Unit 2 Hollywood, FL | 2.0 | 1.0 | 1749 | $2,400 | $1.37 | 24d | 1 | 0.54mi |
| 1521 N 59th Ter Unit B Hollywood, FL | 2.0 | 1.0 | 2609 | $1,800 | $0.69 | 17d | 1 | 0.54mi |
| 400 N 60th Way Unit A Hollywood, FL | 2.0 | 1.5 | 1566 | $2,300 | $1.47 | 24d | 1 | 0.55mi |
| 4815 Johnson St Hollywood, FL | 3.0 | 2.0 | 1635 | $4,000 | $2.45 | 24d | 1 | 0.60mi |
| 4815 Johnson St Hollywood, FL | 3.0 | 2.0 | 1635 | $4,000 | $2.45 | 5d | 1 | 0.60mi |
| 5612 Harding St Unit 5612 Hollywood, FL | 3.0 | 2.5 | 2000 | $5,200 | $2.60 | 24d | 1 | 0.63mi |
| 5612 Harding St Hollywood, FL | 3.0 | 2.5 | 2000 | $6,000 | $3.00 | 24d | 1 | 0.63mi |
| 304 N 61st Ter Unit 324 Hollywood, FL | 3.0 | 2.0 | 1420 | $2,700 | $1.90 | 24d | 1 | 0.67mi |
| 5842 Harding St Unit R Hollywood, FL | 1.0 | 1.0 | 1875 | $1,350 | $0.72 | 10d | 1 | 0.71mi |
| 4630 Buchanan St Hollywood, FL | 3.0 | 2.0 | 1992 | $3,500 | $1.76 | 24d | 1 | 0.71mi |
| 6237 Polk St Unit REAR Hollywood, FL | 3.0 | 2.0 | 2026 | $2,650 | $1.31 | 22d | 1 | 0.77mi |
| 6316 Lincoln St Unit 6316 Hollywood, FL | 3.0 | 2.0 | 2364 | $2,950 | $1.25 | 24d | 1 | 0.80mi |
| 6331 Pierce St Unit 1 Hollywood, FL | 2.0 | 2.0 | 2170 | $2,100 | $0.97 | 5d | 1 | 0.84mi |
| 6328 Pierce St Unit 0 Hollywood, FL | 3.0 | 2.0 | 2101 | $2,700 | $1.29 | 5d | 1 | 0.84mi |
| 6328 Pierce St Unit 0 Hollywood, FL | 3.0 | 2.0 | 2101 | $2,800 | $1.33 | 24d | 1 | 0.84mi |
| 4410 Buchanan St Hollywood, FL | 3.0 | 3.0 | 2167 | $7,499 | $3.46 | 15d | 1 | 0.86mi |
| 2142 Siena Way Hollywood, FL | 3.0 | 2.5 | 1608 | $2,950 | $1.83 | 24d | 1 | 0.86mi |
Listing history 17 events
-
2026-06-18days on market $599,000 Active 64 DOM
-
2026-06-17days on market $599,000 Active 63 DOM
-
2026-06-16days on market $599,000 Active 62 DOM
-
2026-06-15days on market $599,000 Active 61 DOM
-
2026-06-13days on market $599,000 Active 59 DOM
-
2026-06-09days on market $599,000 Active 55 DOM
-
2026-06-08days on market $599,000 Active 54 DOM
-
2026-06-07days on market $599,000 Active 53 DOM
-
2026-06-04days on market $599,000 Active 50 DOM
-
2026-06-03days on market $599,000 Active 49 DOM
-
2026-06-02days on market $599,000 Active 48 DOM
-
2026-06-01days on market $599,000 Active 47 DOM
-
2026-05-31days on market $599,000 Active 46 DOM
-
2026-04-15$599,000 Active
-
2024-11-09historical
-
2024-10-03$620,000 Active
-
1975-06-01soldstatus $52,000
ⓘ Source: listings_history table (triggers on properties + properties_extension) + one-shot
backfill from property_details.listing_events for pre-trigger history.
Tax reassessment forecast FL · Resets to sale price
- Current annual tax
- $8,558 · $713/mo
- Projected year-2 tax
- $8,558 · $713/mo
- Expected delta
- $0/yr ($0/mo · 0.0%)
ⓘ Screening estimate from a state-policy table — verify with the county assessor before closing.
Climate risk First Street
- Flood 1/10 Low FEMA zone X (shaded) · 0% chance over 30 yrs
- Wildfire 1/10 Low
- Heat 10/10 Extreme 7 d/yr ≥105°F today · 28 d/yr by 30 yrs out
- Wind 10/10 Extreme 99% chance of damaging wind over 30 yrs
- Air quality 2/10 Low 2 unhealthy d/yr today · 2 by 30 yrs out
Nearby sold comps map
Loading sold comps map…
Walkable amenities ~0.75 mi
Loading nearby amenities…
Taxation est. · year 1
- Rental income
- $54,888
- − Mortgage interest
- −$33,553
- − Property taxes
- −$8,558
- − Insurance
- −$2,995
- − Repairs & maintenance
- −$4,391
- − Management
- −$4,391
- − Depreciation
- −$17,425
- Taxable loss
- −$16,426
- Est. tax savings @ 24.0%
- +$3,942
- After-tax cash flow
- $-1,944/yr
For passive investors: Depreciation is non-cash, so a rental often shows a tax loss while cash-flowing — sheltering income. Rental losses are passive: they offset passive income freely, and up to $25,000/yr can offset ordinary (W-2) income if you actively participate and your MAGI is under $100k (phasing out to $0 by $150k); unused losses carry forward. On sale, claimed depreciation is recaptured at up to 25%, and gains may owe capital-gains tax (a 1031 exchange can defer both). Figures are a year-1 estimate at your 24.0% rate — not tax advice; consult a CPA.
Schools (NCES district)
- District
- Broward
- NCES district ID
- 1200180
- Math proficiency
- 42% ▼ -18.00%
- Reading proficiency
- 53% ▼ -5.00%
- Median HH income
- $52,139
- Composite
- 40.88/100
- National rank
- #3621
- State rank
- #46 of 73 in FL
Livability — Hollywood
- Score
- 76/100
- State rank
- #232
- US rank
- #3548
Category grades
Schools grade is shown separately in the Schools card above.
Census & demographics
- Census place
- Hollywood, FL
- County
- Broward County · 1,963,430 people
- City population
- 109,079
- Metro
- Miami-Fort Lauderdale-Pompano Beach, FL
- Population (ZIP)
- 48,464
- Household income
- $71,318
- Rent vs Own
- Severe rent burden
- 2151.0
Population outlook (Broward County) Hauer SSP2
- Today (2025)
- 2,207,033 people
- By 2030
- 2,360,704 · +7.0%
- By 2040
- 2,661,208 · +20.6%
- By 2050
- 2,946,698 · +33.5%
- By 2075
- 3,602,273 · +63.2%
- By 2100
- 3,970,984 · +79.9%
Race, ethnicity, and origin ACS 2023
- Neighborhood character
- Diverse neighborhood (Simpson 0.65)
- Race & ethnicity
- White 45% Hispanic / Latino 37% Two or more races 17% Black 13% Asian 3%
- Hispanic origin (detail)
- Puerto Rican 5% Cuban 10% Dominican 2%
- Common ancestry
- Romanian 3% Scotch-Irish 2% Hispanic 2%
- Foreign-born
- 35% · Canada, Jamaica, Dominican Republic
- Languages at home
- 53% English-only · Spanish 33% French/Haitian/Cajun 4% Russian/Polish/Slavic 2%
Political lean MEDSL · Broward
- 2024 margin
- D (+17.0) · D 58.0% · R 41.0%
- 2008→2024 swing
- -17.8pp toward R · 2008: 34.7pp · 2024: 17.0pp
- All cycles
- 2024: D+17.0 2020: D+29.8 2016: D+35.0 2012: D+34.9 2008: D+34.7
Not yet ingested
- Civics
- —
Market trends
- HPI YoY
- ▼ -404.28%
- Current HPI
- 429.7129
- Rent YoY
- ▲ 2.41%
- Metro
- Miami-Fort Lauderdale-Pompano Beach, FL
- State GDP YoY
- ▲ 3.28%
- F500 in state
- 36
Industry mix (Fortune 500 HQ in FL)
| Industry | F500 HQs | Revenue |
|---|---|---|
| Industrial Technology | 2 | $29B |
|
||
| Insurance | 2 | $17B |
|
||
| Retail | 1 | $60B |
|
||
| Technology Distribution | 1 | $58B |
|
||
| Homebuilding | 1 | $35B |
|
||
| Technology Manufacturing | 1 | $35B |
|
||
Price history
+1051.9% since first listed4 events — show timeline
- 2026-04-15 Listed $599,000 MARMLS
- 2024-11-09 Listing Removed — MARMLS
- 2024-10-03 Listed $620,000 MARMLS
- 1975-06-01 Sold (Public Records) $52,000 Public Records
Property tax history
+9.5%/yrLatest (2025): $8,558 · +10.5% YoY. Source: county tax records.
Cash-flow waterfall
monthlySold comps — $/sqft
last 12 mo · ≤1 miLoading sold comps…