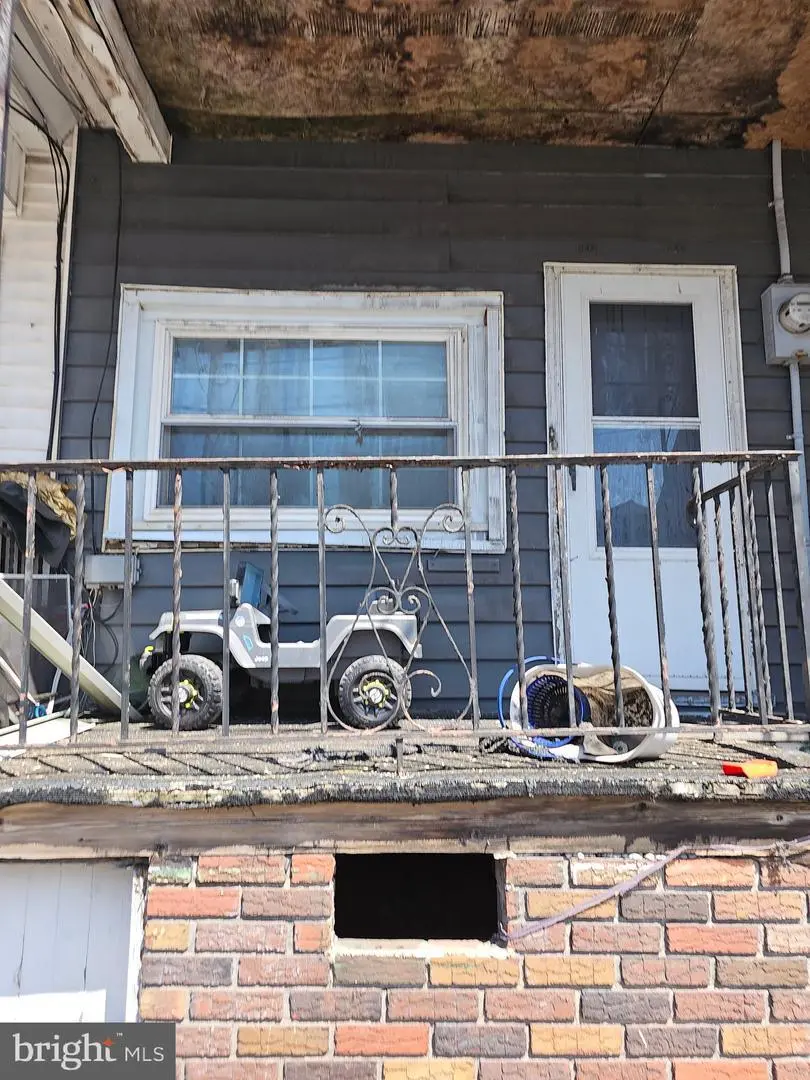
1033 E Centre St · Mahanoy City, PA
Flood risk 7/10 · Major
- FEMA flood zone
- X (unshaded)
- Chance of flooding over 30 yrs
- 0.76%
- Est. flood insurance / yr
- $473 – $860
Fire risk 3/10 · Minor
- Est. fire insurance / yr
- $511 – $949
Heat risk 3/10 · Minor
- Hot days now (above 92°F)
- 8 days/yr
- Hot days in 30 yrs
- 17 days/yr
Wind risk 4/10 · Minor
- Chance of severe wind over 30 yrs
- 7.0%
Air-quality risk 2/10 · Minimal
- Unhealthy air days now
- 1 days/yr
- Unhealthy air days in 30 yrs
- 2 days/yr
Risk factors via First Street. Map © Google.
Why this score? — see what drove the B- grade
The composite is a weighted blend of 9 inputs, each scored 0–100. Each bar is that input's sub-score; the figure is the points it added to the 100-point composite (weight × sub-score).
- Cash flow +30.0/30.0
- 1% rule +10.0/10.0
- DSCR +10.0/10.0
- Appreciation +7.0/10.0
- Livability +3.2/5.0
- ARV discount +3.0/15.0
- Rent growth +2.5/5.0
- Condition / age +2.5/5.0
- Schools +1.7/10.0
$50,000
🖨 Deal sheet 📄 Offer letter ✓ Due diligence
Key facts
- Built 1900
- Listed 42 days
Property features AI
Finance
- Financial info: Improvement assessed value: $5,980; Land assessed value: $1,405; Tax assessed value: $7,385 (2018); Annual tax amount: $730
Exterior
- Parking: On-street parking
- Utilities: Public water; Public sewer
- Home design: End of row/townhouse; Fee simple ownership; Not in a federal flood zone
- Construction: Aluminum siding; Brick/mortar foundation; Estimated year built
- Exterior features: End-of-row townhouse; Above-grade other structures
Interior
- Kitchen: Eat-in kitchen
- Bedrooms: Three bedrooms on the upper level (1st upper level)
- Bathrooms: One full bathroom (all upper levels)
- Heating & cooling: Oil heating; Hot water system (other)
- Interior features: Eat-in kitchen; Partial basement
- Laundry & utility: Laundry located in the basement
Neighborhood map
What this means for you Summary
Snapshot
- This is a 3-bed/1.0-bath single-family listed at $50k.
Deal economics
- At list price, monthly cash flow is $626 ($8k/yr) — positive.
- The deal already cash-flows at list — no discount required.
- Meets the 1% rule at list price ($1k rent vs $50k).
- Recommended offer: $48k (3.0% below list) — sets the bar for market timing.
- Cap rate 22.6% vs local median 11.6% in Mahanoy City — top-decile yield for the area; either an underpriced asset or a hidden risk that comps aren't pricing in. Stress-test before assuming the spread holds.
Location & tenants
- Location reads 65/100 on livability (#1,129 in PA) — a middle-class / working-renter tenant base. Strengths: cost of living A+, health & safety A+, housing A; Watch: schools F, crime F, commute F.
- Mahanoy Area SD (town): math 11% / reading 30% proficiency, ranked #494 of 539 in PA (top 92%) — low school quality limits family demand, transient renter base, plan for 1-2y turnover.
- Market conditions: 43 active listings in the ZIP; 1 comparable units currently listed for rent nearby; 169 units permitted in Schuylkill County in 2024 (0 in 5+ unit buildings).
Forward outlook
- In year one you build about $2k of equity ($346 loan paydown + $2k appreciation (3.9% local appreciation)).
- Schuylkill County population projected at -16% by 2050 — secular population decline; favor cash flow + early exit over multi-decade hold.
- At projected returns (3.9% appreciation + 3.0% rent growth), your $14k cash investment doubles in ~2 years — after that, you're playing with house money.
Negotiation context
- It's been on market 42 days — a 3% lower offer ($48k) is reasonable based on typical stale-listing flexibility.
- 3 sale attempts since 9y ago with the ask held roughly flat each time — persistent listings suggest the price (not the market) is what's stuck; bring a comps-based counter.
- Current owner paid $16k; list at $50k implies a 212% gain — meaningful room to come down on a strong offer.
Risks & watch-outs
- Watch-outs: flood insurance adds $56/mo; built in 1900 — expect roof / HVAC / electrical / plumbing capex.
- Climate carrying-cost: major flood risk — expect insurance premiums to compound above CPI over the hold.
Questions for the listing agent
- It's been on market 42 days. Have you received any prior offers? Is the seller open to a 3% concession, seller financing, or rate buy-down credit?
- Built in 1900 — when were the roof, HVAC, electrical panel, plumbing, and water heater last replaced?
- What's the actual annual flood-insurance premium (NFIP or private), and is the property in a SFHA with mandatory coverage?
- Is there a deadline driving the sale (1031 exchange, divorce, estate, relocation)? That informs how much negotiation room exists.
- Schools are F-rated, which usually means shorter tenancies and higher turnover. Who's the typical renter profile here, and what's been the actual vacancy rate?
- Crime grade is F in this area — have there been break-ins, vandalism, or insurance claims at this property in the last 3 years? What carrier currently insures it and at what premium?
- What's the average days-on-market for RENTAL listings here right now (not sales)? A rising rental-DOM trend means longer vacancies and softer asking-rent achievability than the comps imply.
- What's the recent tenant-quality profile in this submarket — average credit score on applications, eviction rate, late-payment / NSF rate, and stable-employment percentage? A property-management company in the area should have these aggregated.
- How much new for-sale + rental construction is in the pipeline within 1–3 miles? Heavy new supply typically softens prices + rents 12–24 months out; constrained supply supports both.
Investment metrics
- 1% rule
- 2.60% ✓
- Cap rate
- 22.65%
- Cash-on-cash
- 58.41%
- DSCR
- 3.60
- GRM
- 3.2
CMA / ARV
- ARV (median comp)
- $45,456
- List price
- $50,000
- Delta
- 10.00%
- Verdict
- FAIR
- Comps
- 20 within 1.0 mi
Show comp detail 6 sales within ~0.75 mi
| Address | Dist | Beds/Ba | Sqft | Sold | Price | $/sf | Match |
|---|---|---|---|---|---|---|---|
| 828 E Railroad St | 0.11mi | 3/1.5 | 1,120 (-2%) | 11mo | $64,900 | $58 | 80 |
| 1238 Market St | 0.13mi | 3/1.5 | 1,215 (+6%) | 18mo | $47,000 | $39 | 67 |
| 203 Mahanoy St | 0.48mi | 2/1.0 (-1) | 1,200 (+4%) | 9mo | $35,000 | $29 | 57 |
| 201 Mahanoy St | 0.72mi | 3/1.0 | 1,200 (+4%) | 9mo | $35,000 | $29 | 51 |
| 1117 Centre St | 0.03mi | 4/1.0 (+1) | 1,307 (+14%) | 24mo | $65,000 | $50 | 50 |
| 224 Pine St | 0.74mi | 2/1.5 (-1) | 1,300 (+13%) | 6mo | $69,900 | $54 | 31 |
Match score weights: distance 35% · size 25% · config 20% · recency 20%. Top-matched comps best support the ARV.
Projected returns pro-forma
3.94% appreciation · 3.0% rent growth · sell at horizon
- IRR
- 59.8%
- Equity multiple
- 4.46×
- Total profit
- $48,476
- Equity at exit
- $25,178
- IRR
- 58.5%
- Equity multiple
- 9.13×
- Total profit
- $113,773
- Equity at exit
- $41,043
Cash invested: $14,000 (down + closing). Projections, not guarantees.
Landlord ↔ Tenant lean methodology
- Overall (STATE)
- 62 Landlord-Friendly
- State Pennsylvania
- 62 Landlord-Friendly · EVEN
- County
- — inherits STATE
- City
- — inherits STATE
ZIP-level market 17948
- Home prices YoY
- 1.7%
- Active inventory
- 43
- Price-to-rent
- 3.2×
Monthly cashflow live
- Estimated rent
- $1,300 medium interval (Pro) →
- Mortgage (P&I)
- −$262
- Tax est. 1.5%
- −$62 /mo · $750/yr
- Insurance
- −$21
- Flood insurance flood zone
- −$56 /mo · $666/yr
- HOA
- −$0
- Vacancy / Maint / Mgmt
- −$273
- Net cashflow
- $626
Break-even live
UW: 25.0% down · 7.5% · 30yr · 1.5% tax · 5.0% vac · 8.0% maint · 8.0% mgmt
Financing live
Cash to close
- Down payment
- $12,500
- Closing costs
- $1,500
- Reserves months
- —
- Total cash needed
- —
Loan-product check · same deal, 3 products live
Conventional
25% down · 7.5% · 30yr
- Down + closing
- —
- Monthly P&I
- —
- Monthly cashflow
- —
- DSCR
- —
- Eligible?
- —
Personal DTI + credit; lowest rate.
DSCR
20% down · 8.5% · 30yr
- Down + closing
- —
- Monthly P&I
- —
- Monthly cashflow
- —
- DSCR
- —
- Eligible?
- —
No personal income docs; deal must DSCR.
Hard money
10% down · 12.0% · 12mo
- Down + closing
- —
- Monthly P&I
- —
- Monthly cashflow
- —
- DSCR
- —
- Eligible?
- —
Short-term bridge; refi at stabilization.
Rent comps 1 comps
| Address | Beds | Baths | Sqft | Rent | $/sqft | DOM | Units | Dist |
|---|---|---|---|---|---|---|---|---|
| 324 E Market St Mahanoy City, PA | 3.0 | 1.5 | 1314 | $1,300 | $0.99 | 43d | 1 | 0.39mi |
Listing history 21 events
-
2026-06-18days on market $50,000 Active 42 DOM
-
2026-06-17days on market $50,000 Active 41 DOM
-
2026-06-16days on market $50,000 Active 40 DOM
-
2026-06-15days on market $50,000 Active 39 DOM
-
2026-06-13days on market $50,000 Active 37 DOM
-
2026-06-12days on market $50,000 Active 36 DOM
-
2026-06-09days on market $50,000 Active 33 DOM
-
2026-06-08days on market $50,000 Active 32 DOM
-
2026-06-08days on market $50,000 Active 31 DOM
-
2026-06-07days on market $50,000 Active 30 DOM
-
2026-06-04days on market $50,000 Active 27 DOM
-
2026-06-02days on market $50,000 Active 26 DOM
-
2026-06-01days on market $50,000 Active 25 DOM
-
2026-05-31days on market $50,000 Active 24 DOM
-
2026-05-07$50,000 Active
-
2025-12-31historical
-
2025-02-19$39,900 Active
-
2018-07-01historical
-
2017-07-07$15,000
-
2008-05-06soldstatus $16,000
-
1999-02-18soldstatus $8,000
ⓘ Source: listings_history table (triggers on properties + properties_extension) + one-shot
backfill from property_details.listing_events for pre-trigger history.
Climate risk First Street
- Flood 7/10 Severe FEMA zone X (unshaded) · 76% chance over 30 yrs
- Wildfire 3/10 Moderate
- Heat 3/10 Moderate 8 d/yr ≥92°F today · 17 d/yr by 30 yrs out
- Wind 4/10 Moderate 7% chance of damaging wind over 30 yrs
- Air quality 2/10 Low 1 unhealthy d/yr today · 2 by 30 yrs out
Nearby sold comps map
Loading sold comps map…
Walkable amenities ~0.75 mi
Loading nearby amenities…
Taxation est. · year 1
- Rental income
- $15,600
- − Mortgage interest
- −$2,801
- − Property taxes
- −$750
- − Insurance
- −$916
- − Repairs & maintenance
- −$1,248
- − Management
- −$1,248
- − Depreciation
- −$1,455
- Taxable income
- $7,182
- Est. tax owed @ 24.0%
- −$1,724
- After-tax cash flow
- $5,787/yr
For passive investors: Depreciation is non-cash, so a rental often shows a tax loss while cash-flowing — sheltering income. Rental losses are passive: they offset passive income freely, and up to $25,000/yr can offset ordinary (W-2) income if you actively participate and your MAGI is under $100k (phasing out to $0 by $150k); unused losses carry forward. On sale, claimed depreciation is recaptured at up to 25%, and gains may owe capital-gains tax (a 1031 exchange can defer both). Figures are a year-1 estimate at your 24.0% rate — not tax advice; consult a CPA.
Schools (NCES district)
- District
- Mahanoy Area SD
- NCES district ID
- 4214430
- Math proficiency
- 11% ▼ -9.00%
- Reading proficiency
- 30% ▼ -13.00%
- Median HH income
- $36,347
- Composite
- 16.95/100
- National rank
- #9136
- State rank
- #494 of 539 in PA
Livability — Mahanoy City
- Score
- 65/100
- State rank
- #1129
- US rank
- #12973
Category grades
Schools grade is shown separately in the Schools card above.
Census & demographics
- Census place
- Mahanoy City, PA
- Population (ZIP)
- 4,124
Population outlook (Schuylkill County) Hauer SSP2
- Today (2025)
- 137,447 people
- By 2030
- 133,121 · -3.1%
- By 2040
- 124,172 · -9.7%
- By 2050
- 115,611 · -15.9%
- By 2075
- 100,796 · -26.7%
- By 2100
- 86,667 · -36.9%
Race, ethnicity, and origin ACS 2023
- Neighborhood character
- Predominantly White (81%)
- Race & ethnicity
- White 81% Hispanic / Latino 15% Two or more races 9%
- Hispanic origin (detail)
- Mexican 2% Puerto Rican 5% Dominican 8%
- Common ancestry
- Romanian 9% Iranian 3% Hungarian 1%
- Foreign-born
- 6% · Canada
- Languages at home
- 86% English-only · Spanish 11% Arabic 2%
Political lean MEDSL · Schuylkill
- 2024 margin
- Solid R (+42.1) · D 28.5% · R 70.6%
- 2008→2024 swing
- -33.4pp toward R · 2008: -8.7pp · 2024: -42.1pp
- All cycles
- 2024: R+42.1 2020: R+39.9 2016: R+43.4 2012: R+13.4 2008: R+8.7
Not yet ingested
- Civics
- —
Market trends
- HPI YoY
- ▲ 3.94%
- Current HPI
- 234.7484
- Rent YoY
- —
- Metro
- —
- State GDP YoY
- ▲ 1.68%
- F500 in state
- 34
Industry mix (Fortune 500 HQ in PA)
| Industry | F500 HQs | Revenue |
|---|---|---|
| Healthcare | 2 | $309B |
|
||
| Insurance | 2 | $27B |
|
||
| Telecommunications / Media | 1 | $124B |
|
||
| Industrial Distribution | 1 | $22B |
|
||
| Financial Services | 1 | $20B |
|
||
| Chemicals / Materials | 1 | $18B |
|
||
Price history
+525.0% since first listed7 events — show timeline
- 2026-05-07 Listed $50,000 BRIGHT MLS
- 2025-12-31 Listing Removed — BRIGHT MLS
- 2025-02-19 Listed $39,900 BRIGHT MLS
- 2018-07-01 Listing Removed — BRIGHT MLS
- 2017-07-07 Listed $15,000 BRIGHT MLS
- 2008-05-06 Sold (Public Records) $16,000 Public Records
- 1999-02-18 Sold (Public Records) $8,000 Public Records
Property tax history
+13.1%/yrLatest (2026): $2,647 · +223.9% YoY. Source: county tax records.
Cash-flow waterfall
monthlySold comps — $/sqft
last 12 mo · ≤1 miLoading sold comps…