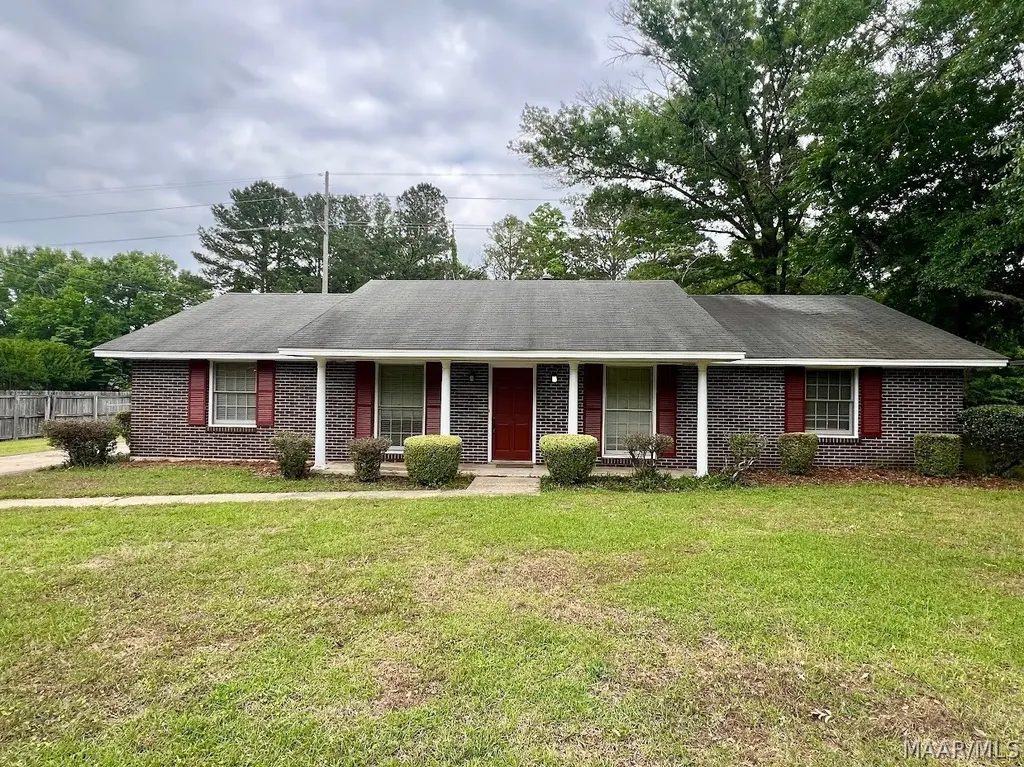
233 Carol Villa Dr · Montgomery, AL
Flood risk 1/10 · Minimal
- FEMA flood zone
- X (unshaded)
- Chance of flooding over 30 yrs
- 0.0%
- Est. flood insurance / yr
- $507 – $1,088
Fire risk 3/10 · Minor
- Est. fire insurance / yr
- $916 – $1,700
Heat risk 7/10 · Major
- Hot days now (above 107°F)
- 7 days/yr
- Hot days in 30 yrs
- 20 days/yr
Wind risk 8/10 · Major
- Chance of severe wind over 30 yrs
- 80.0%
Air-quality risk 4/10 · Minor
- Unhealthy air days now
- 4 days/yr
- Unhealthy air days in 30 yrs
- 5 days/yr
Risk factors via First Street. Map © Google.
Why this score? — see what drove the C grade
The composite is a weighted blend of 9 inputs, each scored 0–100. Each bar is that input's sub-score; the figure is the points it added to the 100-point composite (weight × sub-score).
- Cash flow +21.9/30.0
- ARV discount +12.7/15.0
- DSCR +7.0/10.0
- 1% rule +5.1/10.0
- Rent growth +3.2/5.0
- Livability +3.2/5.0
- Condition / age +2.5/5.0
- Schools +1.7/10.0
- Appreciation +0.0/10.0
$149,900
🖨 Deal sheet 📄 Offer letter ✓ Due diligence
Listing remarks
This 3-bedroom, 2-bath single-family home offers over 1,500 sq. ft. of living space on a spacious 0.45-acre lot — all under $150K! Deals like this are hard to find! With vintage charm, solid bones, a maintained HVAC system, systems in operable conditions this property is perfect for an investor, first-time buyer, or anyone looking for space and opportunity at an affordable price. A little paint, updated flooring, and personal touches could make this home shine. Please schedule your showing appointment today. This is an equitable interest listing where seller is selling only an option contract or assigning an interest in a contract, such as a purchase and sale agreement or a contrac
Key facts
- 0.5 acre lot
- Parking
- Built 1967
Property features AI
Finance
- Other: Information not provided
- Financial info: Information not provided
- HOA & community: Information not provided
Exterior
- Parking: Driveway
- Security: Information not provided
- Utilities: Public water; Public sewer; Electricity available; Cable available; High-speed internet available
- Home design: Single-story brick home; Built per public records
- Construction: Brick construction; Slab foundation
- Exterior features: City lot with mature trees; Irrregular lot dimensions
Interior
- Kitchen: Information not provided
- Bedrooms: Information not provided
- Flooring: Carpet; Tile; Vinyl
- Bathrooms: 2 full bathrooms
- Heating & cooling: Central electric cooling; Multiple heating units
- Interior features: Carpet, tile and vinyl flooring throughout
- Laundry & utility: Electric water heater
Neighborhood map
What this means for you Summary
Snapshot
- This is a 3-bed/2.0-bath single-family listed at $150k.
Deal economics
- At list price, monthly cash flow is $237 ($3k/yr) — positive.
- The deal already cash-flows at list — no discount required.
- Meets the 1% rule at list price ($2k rent vs $150k).
- Recommended offer: $145k (3.0% below list) — sets the bar for market timing.
- Cap rate 8.2% vs local median 6.0% in Montgomery — top-decile yield for the area; either an underpriced asset or a hidden risk that comps aren't pricing in. Stress-test before assuming the spread holds.
Location & tenants
- Location reads 65/100 on livability (#138 in AL) — a middle-class / working-renter tenant base. Strengths: cost of living A+, housing A+; Watch: schools C-, employment D, crime F.
- Montgomery County (urban): math 9% / reading 31% proficiency, ranked #106 of 129 in AL (top 82%) — low school quality limits family demand, transient renter base, plan for 1-2y turnover; 70% free/reduced lunch — lower-income household profile, screen leases tightly.
- Market conditions: Rents rising (+2.6%/yr); 207 active listings in the ZIP; 24 comparable units currently listed for rent nearby; rentals lingering (median 44d on market — plan ~5-8 weeks vacancy on turnover, expect pricing pressure); 54% of comp listings sitting > 30 days — soft ceiling on asking rent; 460 units permitted in Montgomery County in 2024 (37 in 5+ unit buildings).
- This rent runs 31% of the median local income ($59k/yr) — at the standard rent-burdened threshold; future hikes will face affordability resistance.
Forward outlook
- Local home prices are declining (-3.0%/yr); year-one equity from $1k of loan paydown is wiped out by about $4k of value loss. Plan a longer hold.
- Montgomery County population projected to shrink 8% by 2050 — rents likely to lag national; underwrite the cash flow, not the appreciation.
Negotiation context
- It's been on market 31 days — a 3% lower offer ($145k) is reasonable based on typical stale-listing flexibility.
- 2 sale attempts since 29y ago with the ask held roughly flat each time — persistent listings suggest the price (not the market) is what's stuck; bring a comps-based counter.
Risks & watch-outs
- Climate carrying-cost: severe wind risk, 80% chance of damaging wind over 30y; extreme-heat days projected 7→20/yr by 2055 (HVAC capex compounding) — expect insurance premiums to compound above CPI over the hold.
Questions for the listing agent
- It's been on market 31 days. Have you received any prior offers? Is the seller open to a 3% concession, seller financing, or rate buy-down credit?
- Built in 1967 — when were the roof, HVAC, electrical panel, plumbing, and water heater last replaced?
- Is there a deadline driving the sale (1031 exchange, divorce, estate, relocation)? That informs how much negotiation room exists.
- Crime grade is F in this area — have there been break-ins, vandalism, or insurance claims at this property in the last 3 years? What carrier currently insures it and at what premium?
- What's the average days-on-market for RENTAL listings here right now (not sales)? A rising rental-DOM trend means longer vacancies and softer asking-rent achievability than the comps imply.
- What's the recent tenant-quality profile in this submarket — average credit score on applications, eviction rate, late-payment / NSF rate, and stable-employment percentage? A property-management company in the area should have these aggregated.
- How much new for-sale + rental construction is in the pipeline within 1–3 miles? Heavy new supply typically softens prices + rents 12–24 months out; constrained supply supports both.
Investment metrics
- 1% rule
- 1.01% ✓
- Cap rate
- 8.19%
- Cash-on-cash
- 6.77%
- DSCR
- 1.30
- GRM
- 8.2
CMA / ARV
- ARV (on-the-fly)
- $169,290
- Comps found
- 12
Show comp detail 12 sales within ~0.75 mi
| Address | Dist | Beds/Ba | Sqft | Sold | Price | $/sf | Match |
|---|---|---|---|---|---|---|---|
| 616 Wanda Ct | 0.40mi | 3/2.0 | 1,611 (+5%) | 2mo | $185,000 | $115 | 72 |
| 217 Cornell Rd | 0.73mi | 3/2.0 | 1,549 (+1%) | 4mo | $174,500 | $113 | 61 |
| 130 Devon Ct | 0.16mi | 3/2.0 | 1,333 (-13%) | 12mo | $173,900 | $130 | 60 |
| 5202 Surrey Rd | 0.42mi | 3/2.0 | 1,755 (+14%) | 2mo | $157,000 | $89 | 55 |
| 650 Sandhurst Dr | 0.50mi | 3/2.0 | 1,638 (+6%) | 14mo | $145,000 | $89 | 54 |
| 228 Cornell Rd | 0.74mi | 3/2.0 | 1,497 (-3%) | 11mo | $150,000 | $100 | 52 |
| 468 E Vanderbilt Loop | 0.74mi | 3/2.0 | 1,552 (+1%) | 15mo | $170,000 | $110 | 52 |
| 643 Sandhurst Dr | 0.47mi | 3/2.0 | 1,765 (+15%) | 9mo | $212,000 | $120 | 46 |
| 205 Cornell Rd | 0.70mi | 4/2.0 (+1) | 1,663 (+8%) | 6mo | $163,000 | $98 | 44 |
| 457 E Vanderbilt Loop | 0.75mi | 4/2.0 (+1) | 1,509 (-2%) | 20mo | $122,500 | $81 | 41 |
| 5902 Carmel Dr | 0.68mi | 3/2.0 | 1,392 (-10%) | 16mo | $160,000 | $115 | 39 |
| 5912 Carmel Dr | 0.68mi | 3/2.0 | 1,355 (-12%) | 21mo | $145,500 | $107 | 31 |
Match score weights: distance 35% · size 25% · config 20% · recency 20%. Top-matched comps best support the ARV.
Projected returns pro-forma
-3.0% appreciation · 2.65% rent growth · sell at horizon
- IRR
- -6.3%
- Equity multiple
- 0.77×
- Total profit
- $-9,760
- Equity at exit
- $22,351
- IRR
- 2.9%
- Equity multiple
- 1.21×
- Total profit
- $8,664
- Equity at exit
- $12,961
Cash invested: $41,972 (down + closing). Projections, not guarantees.
Landlord ↔ Tenant lean methodology
- Overall (STATE)
- 90 Strongly Landlord-Friendly
- State Alabama
- 90 Strongly Landlord-Friendly · R+15
- County
- — inherits STATE
- City
- — inherits STATE
ZIP-level market 36109
- Home prices YoY
- -20.1%
- Rents YoY
- 2.6%
- Active inventory
- 207
- Price-to-rent
- 8.2×
Monthly cashflow live
- Estimated rent
- $1,516 high interval (Pro) →
- Mortgage (P&I)
- −$786
- Tax from tax record
- −$112 /mo · $1,349/yr
- Insurance
- −$62
- HOA
- −$0
- Vacancy / Maint / Mgmt
- −$318
- Net cashflow
- $237
Break-even live
UW: 25.0% down · 7.5% · 30yr · 1.5% tax · 5.0% vac · 8.0% maint · 8.0% mgmt
Financing live
Cash to close
- Down payment
- $37,475
- Closing costs
- $4,497
- Reserves months
- —
- Total cash needed
- —
Loan-product check · same deal, 3 products live
Conventional
25% down · 7.5% · 30yr
- Down + closing
- —
- Monthly P&I
- —
- Monthly cashflow
- —
- DSCR
- —
- Eligible?
- —
Personal DTI + credit; lowest rate.
DSCR
20% down · 8.5% · 30yr
- Down + closing
- —
- Monthly P&I
- —
- Monthly cashflow
- —
- DSCR
- —
- Eligible?
- —
No personal income docs; deal must DSCR.
Hard money
10% down · 12.0% · 12mo
- Down + closing
- —
- Monthly P&I
- —
- Monthly cashflow
- —
- DSCR
- —
- Eligible?
- —
Short-term bridge; refi at stabilization.
Rent comps 24 comps
| Address | Beds | Baths | Sqft | Rent | $/sqft | DOM | Units | Dist |
|---|---|---|---|---|---|---|---|---|
| 336 Davors Dr Montgomery, AL | 3.0 | 2.0 | 1569 | $2,200 | $1.40 | 43d | 1 | 0.25mi |
| 203 Eastdale Rd S Montgomery, AL | 1.0–3.0 | 1.0–2.0 | 931 | $1,290 | $1.39 | 13d | 13 | 0.59mi |
| 455 Eastdale Rd S Montgomery, AL | 1.0–2.0 | 1.0 | 950 | $850 | $0.89 | 13d | 6 | 0.66mi |
| 500 Eastdale Rd S Montgomery, AL | 1.0–3.0 | 1.0–2.5 | 1042 | $900 | $0.86 | 21d | 20 | 0.72mi |
| 5926 Carmel Dr Montgomery, AL | 3.0 | 2.0 | 1158 | $1,200 | $1.04 | 43d | 1 | 0.75mi |
| 5701 E Shirley Ln Montgomery, AL | 1.0–2.0 | 1.0 | 975 | $850 | $0.87 | 13d | 7 | 0.78mi |
| 4536 Wake Forest Dr Montgomery, AL | 3.0 | 2.0 | 1244 | $1,250 | $1.00 | 43d | 1 | 0.83mi |
| 538 Hollow Wood Rd Montgomery, AL | 2.0 | 2.0 | 1053 | $1,100 | $1.04 | 43d | 1 | 0.96mi |
| 6037 Monticello Dr Montgomery, AL | 1.0–2.0 | 1.0–2.0 | 974 | $1,025 | $1.05 | 13d | 3 | 1.05mi |
| 4365 Hillside Oaks Montgomery, AL | 2.0 | 2.0 | 1204 | $1,500 | $1.25 | 43d | 1 | 1.08mi |
| 6320 Burbank Crossing Loop Montgomery, AL | 3.0 | 2.0 | 1238 | $1,600 | $1.29 | 43d | 1 | 1.20mi |
| 323 N Burbank Dr Montgomery, AL | 4.0 | 2.0 | 1584 | $1,381 | $0.87 | 13d | 1 | 1.26mi |
| 5712 Roxboro Dr Montgomery, AL | 4.0 | 2.0 | 1544 | $1,450 | $0.94 | 21d | 1 | 1.29mi |
| 5600 Carmichael Rd Montgomery, AL | 2.0 | 1.0–2.0 | 722 | $1,153 | $1.60 | 43d | 1 | 1.32mi |
| 241 Kroy Dr Montgomery, AL | 4.0 | 2.0 | 1450 | $1,195 | $0.82 | 43d | 1 | 1.39mi |
| 516 Lawndale Ln Montgomery, AL | 3.0 | 1.0 | 1125 | $1,150 | $1.02 | 43d | 1 | 1.41mi |
| 564 Glade Park Loop Unit 1043856P Montgomery, AL | 4.0 | 2.0 | 1496 | $2,736 | $1.83 | 13d | 1 | 1.42mi |
| 633 Groveland Dr Montgomery, AL | 3.0 | 2.0 | 1424 | $1,200 | $0.84 | 43d | 1 | 1.42mi |
| 560 Farmington Rd Montgomery, AL | 4.0 | 2.0 | 2161 | $1,695 | $0.78 | 13d | 1 | 1.44mi |
| 572 Farmington Rd Montgomery, AL | 3.0 | 2.0 | 2106 | $1,495 | $0.71 | 43d | 1 | 1.45mi |
| 535 Lawndale Ln Montgomery, AL | 4.0 | 1.5 | 1260 | $1,100 | $0.87 | 13d | 1 | 1.48mi |
| 1421 Stonehenge Rd Montgomery, AL | 1.0–3.0 | 1.0–1.5 | 895 | $1,199 | $1.34 | 43d | 1 | 1.48mi |
| 605 Plantation Way Montgomery, AL | 4.0 | 2.0 | 1519 | $1,200 | $0.79 | 21d | 1 | 1.49mi |
| 713 Amity Ln Montgomery, AL | 4.0 | 2.0 | 1696 | $1,900 | $1.12 | 43d | 1 | 1.49mi |
Listing history 17 events
-
2026-06-18days on market $149,900 Active 31 DOM
-
2026-06-17days on market $149,900 Active 30 DOM
-
2026-06-16days on market $149,900 Active 29 DOM
-
2026-06-15days on market $149,900 Active 28 DOM
-
2026-06-14days on market $149,900 Active 26 DOM
-
2026-06-13days on market $149,900 Active 25 DOM
-
2026-06-10days on market $149,900 Active 23 DOM
-
2026-06-09days on market $149,900 Active 22 DOM
-
2026-06-08days on market $149,900 Active 21 DOM
-
2026-06-07days on market $149,900 Active 20 DOM
-
2026-06-03days on market $149,900 Active 16 DOM
-
2026-06-02days on market $149,900 Active 15 DOM
-
2026-06-01days on market $149,900 Active 14 DOM
-
2026-05-31days on market $149,900 Active 13 DOM
-
2026-05-30days on market $149,900 Active 12 DOM
-
2026-05-18$149,900 Active
-
1997-01-16$100,000
ⓘ Source: listings_history table (triggers on properties + properties_extension) + one-shot
backfill from property_details.listing_events for pre-trigger history.
Tax reassessment forecast AL · Resets to sale price
- Current annual tax
- $1,349 · $112/mo
- Projected year-2 tax
- $1,349 · $112/mo
- Expected delta
- $0/yr ($0/mo · 0.0%)
ⓘ Screening estimate from a state-policy table — verify with the county assessor before closing.
Climate risk First Street
- Flood 1/10 Low FEMA zone X (unshaded) · 0% chance over 30 yrs
- Wildfire 3/10 Moderate
- Heat 7/10 Severe 7 d/yr ≥107°F today · 20 d/yr by 30 yrs out
- Wind 8/10 Severe 80% chance of damaging wind over 30 yrs
- Air quality 4/10 Moderate 4 unhealthy d/yr today · 5 by 30 yrs out
Nearby sold comps map
Loading sold comps map…
Walkable amenities ~0.75 mi
Loading nearby amenities…
Taxation est. · year 1
- Rental income
- $18,195
- − Mortgage interest
- −$8,397
- − Property taxes
- −$1,349
- − Insurance
- −$750
- − Repairs & maintenance
- −$1,456
- − Management
- −$1,456
- − Depreciation
- −$4,361
- Taxable income
- $428
- Est. tax owed @ 24.0%
- −$103
- After-tax cash flow
- $2,740/yr
For passive investors: Depreciation is non-cash, so a rental often shows a tax loss while cash-flowing — sheltering income. Rental losses are passive: they offset passive income freely, and up to $25,000/yr can offset ordinary (W-2) income if you actively participate and your MAGI is under $100k (phasing out to $0 by $150k); unused losses carry forward. On sale, claimed depreciation is recaptured at up to 25%, and gains may owe capital-gains tax (a 1031 exchange can defer both). Figures are a year-1 estimate at your 24.0% rate — not tax advice; consult a CPA.
Schools (NCES district)
- District
- Montgomery County
- NCES district ID
- 0102430
- Math proficiency
- 9% ▼ -21.00%
- Reading proficiency
- 31% ▼ -1.00%
- Median HH income
- $43,902
- Composite
- 17.24/100
- National rank
- #9093
- State rank
- #106 of 129 in AL
Livability — Montgomery
- Score
- 65/100
- State rank
- #138
- US rank
- #13416
Category grades
Schools grade is shown separately in the Schools card above.
Census & demographics
- Census place
- Montgomery, AL
- County
- Montgomery County · 190,016 people
- City population
- 175,913
- Metro
- Montgomery, AL
- Population (ZIP)
- 23,581
- Household income
- $59,193
- Rent vs Own
- Severe rent burden
- 1039.0
Population outlook (Montgomery County) Hauer SSP2
- Today (2025)
- 224,008 people
- By 2030
- 221,460 · -1.1%
- By 2040
- 214,179 · -4.4%
- By 2050
- 204,912 · -8.5%
- By 2075
- 177,821 · -20.6%
- By 2100
- 145,134 · -35.2%
Race, ethnicity, and origin ACS 2023
- Neighborhood character
- Diverse neighborhood (Simpson 0.60)
- Race & ethnicity
- White 49% Black 39% Hispanic / Latino 8% Two or more races 4%
- Hispanic origin (detail)
- Mexican 4%
- Common ancestry
- Slovak 2% Lithuanian 1% Serbian 1%
- Foreign-born
- 4% · Canada, South Korea
- Languages at home
- 94% English-only · Spanish 5%
Political lean MEDSL · Montgomery
- 2024 margin
- Solid D (+30.7) · D 64.8% · R 34.1% · Other 1.1%
- 2008→2024 swing
- +11.5pp toward D · 2008: 19.2pp · 2024: 30.7pp
- All cycles
- 2024: D+30.7 2020: D+31.5 2016: D+26.2 2012: D+24.3 2008: D+19.2
Not yet ingested
- Civics
- —
Market trends
- HPI YoY
- ▼ -37.64%
- Current HPI
- 149.3867
- Rent YoY
- ▲ 2.65%
- Metro
- Montgomery, AL
- State GDP YoY
- ▲ 2.94%
- F500 in state
- 4
Industry mix (Fortune 500 HQ in AL)
| Industry | F500 HQs | Revenue |
|---|---|---|
| Financial Services | 1 | $8B |
|
||
| Healthcare | 1 | $5B |
|
||
Price history
+49.9% since first listed2 events — show timeline
- 2026-05-18 Listed $149,900 MAAR
- 1997-01-16 Listed $100,000 MAAR
Property tax history
+7.1%/yrLatest (2025): $1,349 · +1.8% YoY. Source: county tax records.
Cash-flow waterfall
monthlySold comps — $/sqft
last 12 mo · ≤1 miLoading sold comps…