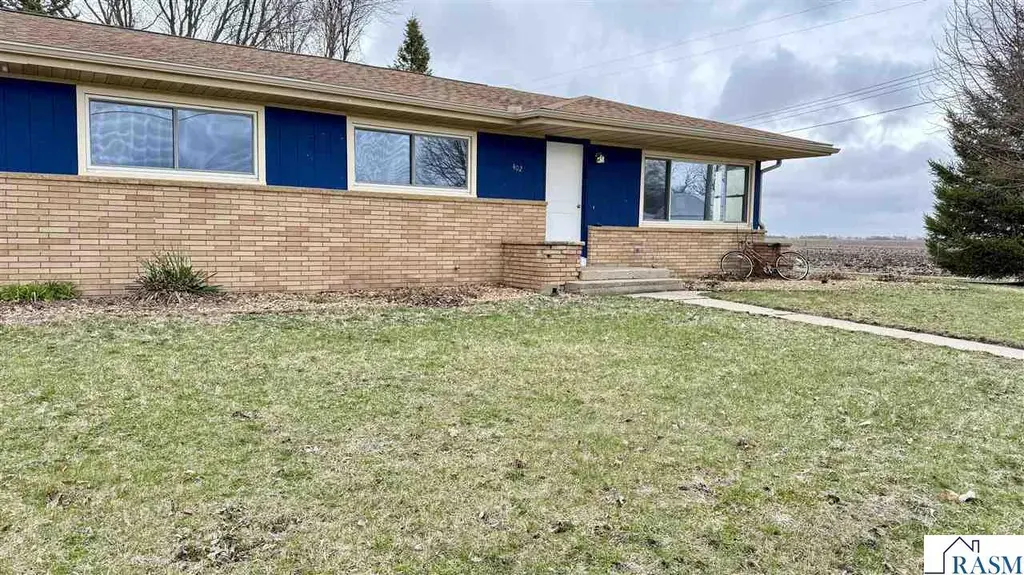
402 E North St · Waldorf, MN
Flood risk 1/10 · Minimal
- FEMA flood zone
- —
- Chance of flooding over 30 yrs
- 0.0%
- Est. flood insurance / yr
- —
Fire risk 1/10 · Minimal
- Est. fire insurance / yr
- $888 – $1,650
Heat risk 2/10 · Minimal
- Hot days now (above 99°F)
- 7 days/yr
- Hot days in 30 yrs
- 15 days/yr
Wind risk 2/10 · Minimal
- Chance of severe wind over 30 yrs
- —
Air-quality risk 1/10 · Minimal
- Unhealthy air days now
- 0 days/yr
- Unhealthy air days in 30 yrs
- 0 days/yr
Risk factors via First Street. Map © Google.
Why this score? — see what drove the D grade
The composite is a weighted blend of 9 inputs, each scored 0–100. Each bar is that input's sub-score; the figure is the points it added to the 100-point composite (weight × sub-score).
- Cash flow +9.2/30.0
- Appreciation +8.8/10.0
- ARV discount +7.5/15.0
- Schools +4.1/10.0
- Livability +3.1/5.0
- 1% rule +2.8/10.0
- DSCR +2.6/10.0
- Rent growth +2.5/5.0
- Condition / age +2.5/5.0
$144,900
🖨 Deal sheet (PDF) 📄 Offer letter ✓ Due diligence
Listing remarks
3 bedrooms, 2 baths, 2,386 sq ft — fully updated in 2025 and move-in ready at $145,900 with just $1,864 in annual taxes. One of the most updated homes available within 30 minutes of Mankato at this price point. The 2025 renovation left almost nothing untouched: new flooring throughout, fresh wall and ceiling paint, painted cabinetry, new countertops, new interior and exterior doors, new base and casing trim, and new basement windows. The kitchen and laundry are fully equipped with a new refrigerator, range, dishwasher, and washer/dryer — everything stays. Three bedrooms on the main level, a full bath and a half bath, and a full unfinished basement ready for your vision — e
Key facts
- New flooring
- New basement windows
- Painted cabinetry
Tags
Property features AI
Finance
- Other: Lot dimensions approximately 73.5 x 10⁹ (0.18 acre)
- Financial info: Tax amount information not included per instructions
- HOA & community: HOA information not provided
Exterior
- Parking: Parking information not provided
- Security: Security information not provided
- Utilities: Public water; Public sewer
- Home design: Single-family residential property; Above-grade finished living area present
- Construction: Brick and wood siding exterior; Built details not provided
- Exterior features: Asphalt roof
Interior
- Kitchen: Cooktop; Range; Dishwasher; Refrigerator
- Bedrooms: Information about bedrooms not provided
- Flooring: Flooring information not provided
- Bathrooms: 1 full bathroom; 1 half bathroom
- Heating & cooling: Propane heating
- Interior features: Dishwasher; Dryer; Cooktop; Range; Refrigerator; Washer; Gas water heater; Sump pump in basement; Unfinished full basement
- Laundry & utility: Washer; Dryer; Gas water heater
Neighborhood map
What this means for you Summary
Snapshot
- This is a 3-bed/1.5-bath single-family listed at $145k.
Deal economics
- At list price, monthly cash flow is $-108 ($-1k/yr) — negative.
- To cash-flow at today's rent, offer at most $129k (10.7% below list).
- To meet the 1% rule (rent ≥ 1% of price), the offer needs to be $113k (21.9% below list).
- Recommended offer: $113k (21.9% below list) — sets the bar for 1% rule.
Location & tenants
- Location reads 62/100 on livability (#698 in MN) — a middle-class / working-renter tenant base. Strengths: cost of living A+, housing A+; Watch: health & safety C-, employment D+, crime D.
- Janesville-Waldorf-Pemberton (rural): math 44% / reading 49% proficiency, ranked #147 of 301 in MN (top 49%) — families likely to look elsewhere, expect single-tenant / working-renter base with shorter leases.
- Zoned schools: Janesville-Waldorf-Pemberton El.Em. (math 62% / reading 52%, grade C+, #265 of 857 statewide, top 35%, 348 students, 34% FRL); Janesville-Waldorf-Pemberton Sec (math 27% / reading 42%, grade F, #306 of 471 statewide, top 70%, 349 students, 35% FRL).
- Market conditions: 4 active listings in the ZIP; 24 units permitted in Waseca County in 2024 (0 in 5+ unit buildings).
Forward outlook
- In year one you build about $12k of equity ($1k loan paydown + $11k appreciation (7.5% local appreciation)).
- By year 4, paydown + projected appreciation supports a ~$41k cash-out refi (75% LTV) — recoverable capital for the next deal without selling this one.
Negotiation context
- It's been on market 77 days — a 6% lower offer ($136k) is reasonable based on typical stale-listing flexibility.
Questions for the listing agent
- What do current leases actually rent for vs. the listed asking? Can we see a recent rent roll and the last 12 months of T-12 income?
- It's been on market 77 days. Have you received any prior offers? Is the seller open to a 22% concession, seller financing, or rate buy-down credit?
- Built in 1960 — when were the roof, HVAC, electrical panel, plumbing, and water heater last replaced?
- Why hasn't it sold? Are there any deal-killer items the seller is aware of (foundation, flood, title, zoning, code violations)?
- Is there a deadline driving the sale (1031 exchange, divorce, estate, relocation)? That informs how much negotiation room exists.
- Crime grade is D in this area — have there been break-ins, vandalism, or insurance claims at this property in the last 3 years? What carrier currently insures it and at what premium?
- The area grade is low — what's the realistic commute time and amenity access for the typical tenant pool here? Any planned neighborhood developments (good or bad) we should know about?
- What's the average days-on-market for RENTAL listings here right now (not sales)? A rising rental-DOM trend means longer vacancies and softer asking-rent achievability than the comps imply.
- What's the recent tenant-quality profile in this submarket — average credit score on applications, eviction rate, late-payment / NSF rate, and stable-employment percentage? A property-management company in the area should have these aggregated.
- How much new for-sale + rental construction is in the pipeline within 1–3 miles? Heavy new supply typically softens prices + rents 12–24 months out; constrained supply supports both.
Investment metrics
- 1% rule
- 0.78% ✗
- Cap rate
- 5.40%
- Cash-on-cash
- -3.18%
- DSCR
- 0.86
- GRM
- 10.7
CMA / ARV
No comps found within radius.
Projected returns pro-forma
7.51% appreciation · 3.0% rent growth · sell at horizon
- IRR
- 16.5%
- Equity multiple
- 2.19×
- Total profit
- $48,402
- Equity at exit
- $105,342
- IRR
- 16.0%
- Equity multiple
- 4.59×
- Total profit
- $145,533
- Equity at exit
- $204,736
Cash invested: $40,572 (down + closing). Projections, not guarantees.
Landlord ↔ Tenant lean methodology
- Overall (STATE)
- 46 Balanced
- State Minnesota
- 46 Balanced · D+2
- County
- — inherits STATE
- City
- — inherits STATE
ZIP-level market 56091
- Home prices YoY
- 3.0%
- Active inventory
- 4
- Price-to-rent
- 10.7×
Monthly cashflow live
- Estimated rent
- $1,131 medium interval (Pro) →
- Mortgage (P&I)
- −$760
- Tax est. 1.5%
- −$181 /mo · $2,174/yr
- Insurance
- −$60
- HOA
- −$0
- Vacancy / Maint / Mgmt
- −$238
- Net cashflow
- $-108
Break-even live
Sensitivity live
| Price | -10% $-7 | -5% $-57 | +0% $-108 | +5% $-158 | +10% $-208 |
|---|---|---|---|---|---|
| Rent | -10% $-197 | -5% $-152 | +0% $-108 | +5% $-63 | +10% $-18 |
| Rate | -1.0pp $-35 | -0.5pp $-71 | base $-108 | +0.5pp $-145 | +1.0pp $-183 |
UW: 25.0% down · 7.5% · 30yr · 1.5% tax · 5.0% vac · 8.0% maint · 8.0% mgmt
Financing live
Cash to close
- Down payment
- $36,225
- Closing costs
- $4,347
- Reserves months
- —
- Total cash needed
- —
Loan-product check · same deal, 3 products live
Conventional
25% down · 7.5% · 30yr
- Down + closing
- —
- Monthly P&I
- —
- Monthly cashflow
- —
- DSCR
- —
- Eligible?
- —
Personal DTI + credit; lowest rate.
DSCR
20% down · 8.5% · 30yr
- Down + closing
- —
- Monthly P&I
- —
- Monthly cashflow
- —
- DSCR
- —
- Eligible?
- —
No personal income docs; deal must DSCR.
Hard money
10% down · 12.0% · 12mo
- Down + closing
- —
- Monthly P&I
- —
- Monthly cashflow
- —
- DSCR
- —
- Eligible?
- —
Short-term bridge; refi at stabilization.
Listing history 21 events
-
2026-06-22days on market $144,900 Active 77 DOM
-
2026-06-21days on market $144,900 Active 76 DOM
-
2026-06-21days on market $144,900 Active 75 DOM
-
2026-06-18days on market $144,900 Active 73 DOM
-
2026-06-17days on market $144,900 Active 72 DOM
-
2026-06-16days on market $144,900 Active 71 DOM
-
2026-06-15days on market $144,900 Active 70 DOM
-
2026-06-13days on market $144,900 Active 68 DOM
-
2026-06-12days on market $144,900 Active 67 DOM
-
2026-06-09days on market $144,900 Active 64 DOM
-
2026-06-08days on market $144,900 Active 63 DOM
-
2026-06-07days on market $144,900 Active 62 DOM
-
2026-06-05days on market $144,900 Active 60 DOM
-
2026-06-04days on market $144,900 Active 58 DOM
-
2026-06-02days on market $144,900 Active 57 DOM
-
2026-06-01days on market $144,900 Active 56 DOM
-
2026-05-31days on market $144,900 Active 55 DOM
-
2026-05-31days on market $144,900 Active 54 DOM
-
2026-05-11price $144,900
-
2026-05-05price $152,900
-
2026-04-07$159,900 Active
ⓘ Source: listings_history table (triggers on properties + properties_extension) + one-shot
backfill from property_details.listing_events for pre-trigger history.
Climate risk First Street
- Flood 1/10 Low 0% chance over 30 yrs
- Wildfire 1/10 Low
- Heat 2/10 Low 7 d/yr ≥99°F today · 15 d/yr by 30 yrs out
- Wind 2/10 Low
- Air quality 1/10 Low 0 unhealthy d/yr today · 0 by 30 yrs out
Nearby sold comps map
Loading sold comps map…
Walkable amenities ~0.75 mi
Loading nearby amenities…
Taxation est. · year 1
- Rental income
- $13,578
- − Mortgage interest
- −$8,117
- − Property taxes
- −$2,174
- − Insurance
- −$724
- − Repairs & maintenance
- −$1,086
- − Management
- −$1,086
- − Depreciation
- −$4,215
- Taxable loss
- −$3,825
- Est. tax savings @ 24.0%
- +$918
- After-tax cash flow
- $-372/yr
For passive investors: Depreciation is non-cash, so a rental often shows a tax loss while cash-flowing — sheltering income. Rental losses are passive: they offset passive income freely, and up to $25,000/yr can offset ordinary (W-2) income if you actively participate and your MAGI is under $100k (phasing out to $0 by $150k); unused losses carry forward. On sale, claimed depreciation is recaptured at up to 25%, and gains may owe capital-gains tax (a 1031 exchange can defer both). Figures are a year-1 estimate at your 24.0% rate — not tax advice; consult a CPA.
Schools (NCES district)
- District
- Janesville-Waldorf-Pemberton
- NCES district ID
- 2791451
- Math proficiency
- 44% ▼ -1.00%
- Reading proficiency
- 49% ▼ -5.00%
- Median HH income
- $59,952
- Composite
- 40.82/100
- National rank
- #3634
- State rank
- #147 of 301 in MN
Livability — Waldorf
- Score
- 62/100
- State rank
- #698
- US rank
- #16808
Category grades
Schools grade is shown separately in the Schools card above.
Census & demographics
- Census place
- Waldorf, MN
- Population (ZIP)
- 267
Population outlook (Waseca County) Hauer SSP2
- Today (2025)
- 19,050 people
- By 2030
- 19,056 · +0.0%
- By 2040
- 19,138 · +0.5%
- By 2050
- 19,359 · +1.6%
- By 2075
- 20,894 · +9.7%
- By 2100
- 22,201 · +16.5%
Race, ethnicity, and origin ACS 2023
- Neighborhood character
- Predominantly White (94%)
- Race & ethnicity
- White 94% Two or more races 3% Hispanic / Latino 2% Asian 2%
- Common ancestry
- Portuguese 12% Romanian 2% Lithuanian 1%
- Foreign-born
- 3% · Canada
- Languages at home
- 96% English-only · Spanish 2% German/W. Germanic 1% Tagalog/Filipino 1%
Political lean MEDSL · Waseca
- 2024 margin
- Solid R (+32.5) · D 32.8% · R 65.3% · Other 1.8%
- 2008→2024 swing
- -24.3pp toward R · 2008: -8.2pp · 2024: -32.5pp
- All cycles
- 2024: R+32.5 2020: R+30.1 2016: R+32.7 2012: R+7.7 2008: R+8.2
Not yet ingested
- Civics
- —
Market trends
- HPI YoY
- ▲ 7.51%
- Current HPI
- 254.8193
- Rent YoY
- —
- Metro
- —
- State GDP YoY
- ▲ 2.41%
- F500 in state
- 34
Industry mix (Fortune 500 HQ in MN)
| Industry | F500 HQs | Revenue |
|---|---|---|
| Healthcare | 2 | $407B |
|
||
| Retail | 2 | $150B |
|
||
| Consumer Goods | 2 | $32B |
|
||
| Industrial Machinery | 2 | $6B |
|
||
| Agriculture | 1 | $40B |
|
||
| Healthcare / Medical Devices | 1 | $32B |
|
||
Price history
-9.4% since first listed3 events — show timeline
- 2026-05-11 Price Changed $144,900 RASM
- 2026-05-05 Price Changed $152,900 RASM
- 2026-04-07 Listed $159,900 RASM
Cash-flow waterfall
monthlySold comps — $/sqft
last 12 mo · ≤1 miLoading sold comps…