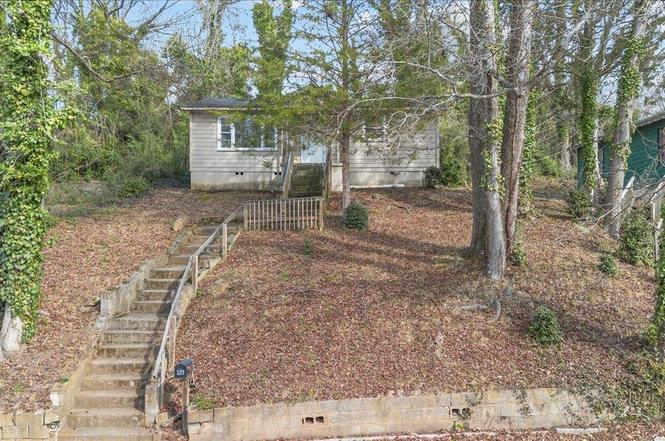
213 Caulder Cir · Spartanburg, SC
Flood risk 1/10 · Minimal
- FEMA flood zone
- X (unshaded)
- Chance of flooding over 30 yrs
- 0.0%
- Est. flood insurance / yr
- $507 – $1,088
Fire risk 3/10 · Minor
- Est. fire insurance / yr
- $783 – $1,453
Heat risk 6/10 · Moderate
- Hot days now (above 105°F)
- 7 days/yr
- Hot days in 30 yrs
- 16 days/yr
Wind risk 2/10 · Minimal
- Chance of severe wind over 30 yrs
- 2.0%
Air-quality risk 4/10 · Minor
- Unhealthy air days now
- 4 days/yr
- Unhealthy air days in 30 yrs
- 4 days/yr
Risk factors via First Street. Map © Google.
Why this score? — see what drove the B grade
The composite is a weighted blend of 9 inputs, each scored 0–100. Each bar is that input's sub-score; the figure is the points it added to the 100-point composite (weight × sub-score).
- Cash flow +27.7/30.0
- ARV discount +15.0/15.0
- DSCR +9.8/10.0
- 1% rule +9.0/10.0
- Livability +3.8/5.0
- Rent growth +3.4/5.0
- Schools +3.1/10.0
- Condition / age +2.5/5.0
- Appreciation +0.0/10.0
$89,000
🖨 Deal sheet 📄 Offer letter ✓ Due diligence
Listing remarks MLS
INVESTOR SPECIAL! This home is waiting for it's new owner to make it one-of-a-kind! 213 Caulder Circle has recently built and renovated homes all around it. ~5 minute drive to Downtown Spartanburg and a short walk or bike ride on the new Mary Wright Greenway bike trail to Rumley and S Converse Parks! Sold as-is. No appraisal required repairs will be made, discuss this with the lender prior to offer submissions.
Key facts
- 7,840 sq ft lot
- Garage
- Listed 114 days
Tags
Property features AI
Finance
- Other: Lead-based paint disclosure required; Residential property disclosure required
- HOA & community: No HOA fees
Exterior
- Parking: See remarks for parking/garage details
- Utilities: Public water; Electric water heater; Public sewer; Public garbage pickup; Electric power
- Home design: Single-story home; Older home (approx. 50+ years); Crawl space foundation
- Construction: Block and wood exterior; Composition shingle roof
- Exterior features: Front porch; Lot gently sloped with some trees; Lot size: 1/2 acre or less
Interior
- Kitchen: Kitchen approximately 13 x 13; Appliances: See remarks
- Bedrooms: Primary bedroom on main level; Two bedrooms on the main level (both approximately 13 x 13)
- Flooring: Carpet; Hardwood; Vinyl
- Bathrooms: One full bathroom (on main level)
- Heating & cooling: Electric heating; Electric cooling
- Interior features: Laminate countertops; See remarks for additional interior features
- Laundry & utility: Laundry located in the kitchen
Neighborhood map
What this means for you Summary
Snapshot
- This is a 2-bed/1.0-bath single-family listed at $89k.
Deal economics
- At list price, monthly cash flow is $269 ($3k/yr) — positive.
- The deal already cash-flows at list — no discount required.
- Meets the 1% rule at list price ($1k rent vs $89k).
- Recommended offer: $81k (9.0% below list) — sets the bar for market timing.
- Cap rate 9.9% vs local median 3.9% in Spartanburg — top-decile yield for the area; either an underpriced asset or a hidden risk that comps aren't pricing in. Stress-test before assuming the spread holds.
Location & tenants
- Location reads 76/100 on livability (#24 in SC, #3,679 nationally) — a middle-class / working-renter tenant base. Strengths: amenities A+, commute A+, cost of living A+; Watch: crime F, employment F.
- Spartanburg 07 (urban): math 34% / reading 41% proficiency, ranked #39 of 80 in SC (top 49%) — families likely to look elsewhere, expect single-tenant / working-renter base with shorter leases; 62% free/reduced lunch — lower-income household profile, screen leases tightly.
- Zoned schools: Mary H. Wright Elementary (math 22% / reading 22%, grade F, #475 of 597 statewide, top 81%, 455 students, 100% FRL) — zoned schools average 100% FRL vs 62% district-wide (38 pts higher); higher-poverty schools than district average — tighter screening recommended.
- Zoned-school proficiency averages 22% at this address vs 38% district-wide (-16 pts) — the specific schools serving this property underperform the Spartanburg 07 average; the district grade overstates school quality for this exact location.
- Market conditions: Rents rising (+3.5%/yr); 234 active listings in the ZIP; 18 comparable units currently listed for rent nearby; rentals at typical pace (median 21d on market — plan ~3-4 weeks tenant-placement turnaround); lower-income renter base — watch delinquency; 3,129 units permitted in Spartanburg County in 2024 (40 in 5+ unit buildings).
Forward outlook
- Local home prices are declining (-3.0%/yr); year-one equity from $615 of loan paydown is wiped out by about $3k of value loss. Plan a longer hold.
- Spartanburg County population projected at +18% by 2050 — long-run rental-demand tailwind backs the buy-and-hold thesis.
- At projected returns (-3.0% appreciation + 3.5% rent growth), your $25k cash investment doubles in ~9 years — after that, you're playing with house money.
Negotiation context
- It's been on market 114 days — a 9% lower offer ($81k) is reasonable based on typical stale-listing flexibility.
- 3 sale attempts since 4y ago with the ask held roughly flat each time — persistent listings suggest the price (not the market) is what's stuck; bring a comps-based counter.
Risks & watch-outs
- Watch-outs: property tax is 2.9% of price.
- Climate carrying-cost: extreme-heat days projected 7→16/yr by 2055 (HVAC capex compounding) — expect insurance premiums to compound above CPI over the hold.
Questions for the listing agent
- It's been on market 114 days. Have you received any prior offers? Is the seller open to a 9% concession, seller financing, or rate buy-down credit?
- Built in 1962 — when were the roof, HVAC, electrical panel, plumbing, and water heater last replaced?
- Property tax is high relative to price — has the assessment been appealed recently, and will the sale trigger a re-assessment?
- Why hasn't it sold? Are there any deal-killer items the seller is aware of (foundation, flood, title, zoning, code violations)?
- Is there a deadline driving the sale (1031 exchange, divorce, estate, relocation)? That informs how much negotiation room exists.
- Schools are D-rated, which usually means shorter tenancies and higher turnover. Who's the typical renter profile here, and what's been the actual vacancy rate?
- Crime grade is F in this area — have there been break-ins, vandalism, or insurance claims at this property in the last 3 years? What carrier currently insures it and at what premium?
- What's the average days-on-market for RENTAL listings here right now (not sales)? A rising rental-DOM trend means longer vacancies and softer asking-rent achievability than the comps imply.
- What's the recent tenant-quality profile in this submarket — average credit score on applications, eviction rate, late-payment / NSF rate, and stable-employment percentage? A property-management company in the area should have these aggregated.
- How much new for-sale + rental construction is in the pipeline within 1–3 miles? Heavy new supply typically softens prices + rents 12–24 months out; constrained supply supports both.
Investment metrics
- 1% rule
- 1.40% ✓
- Cap rate
- 9.92%
- Cash-on-cash
- 12.95%
- DSCR
- 1.58
- GRM
- 5.9
CMA / ARV
- ARV (on-the-fly)
- $154,224
- Comps found
- 12
Show comp detail 12 sales within ~0.75 mi
| Address | Dist | Beds/Ba | Sqft | Sold | Price | $/sf | Match |
|---|---|---|---|---|---|---|---|
| 208B Collins Ave | 0.29mi | 2/2.0 | 954 (+0%) | 1mo | $166,000 | $174 | 82 |
| 308 Appian Dr | 0.15mi | 2/2.0 | 961 (+1%) | 11mo | $203,000 | $211 | 78 |
| 106 Nevada St | 0.15mi | 3/1.0 (+1) | 1,041 (+9%) | 1mo | $119,900 | $115 | 72 |
| 270 Rev Wilson Dr | 0.21mi | 2/1.0 | 832 (-13%) | 1mo | $119,900 | $144 | 68 |
| 128 Owens St | 0.38mi | 3/2.0 (+1) | 960 (+1%) | 10mo | $155,000 | $161 | 64 |
| 382 Caulder Ave Ave | 0.21mi | 2/1.0 | 1,080 (+13%) | 9mo | $72,500 | $67 | 61 |
| 102 Arlo Ct | 0.55mi | 2/1.0 | 881 (-8%) | 3mo | $142,500 | $162 | 60 |
| 163 East Columbia Avenue Ave | 0.21mi | 3/1.0 (+1) | 1,064 (+12%) | 11mo | $167,000 | $157 | 57 |
| 119 George St | 0.40mi | 3/1.0 (+1) | 1,017 (+7%) | 12mo | $178,000 | $175 | 55 |
| 201 South Carolina Ave | 0.49mi | 2/1.5 | 1,050 (+10%) | 4mo | $167,000 | $159 | 54 |
| 609 S Irwin Ave Ave | 0.61mi | 2/1.0 | 1,034 (+9%) | 8mo | $185,000 | $179 | 50 |
| 139 Carolina Ave | 0.41mi | 3/2.0 (+1) | 1,089 (+14%) | 3mo | $179,500 | $165 | 45 |
Match score weights: distance 35% · size 25% · config 20% · recency 20%. Top-matched comps best support the ARV.
Projected returns pro-forma
-3.0% appreciation · 3.46% rent growth · sell at horizon
- IRR
- 3.5%
- Equity multiple
- 1.14×
- Total profit
- $3,367
- Equity at exit
- $13,270
- IRR
- 13.6%
- Equity multiple
- 2.11×
- Total profit
- $27,726
- Equity at exit
- $7,695
Cash invested: $24,920 (down + closing). Projections, not guarantees.
Landlord ↔ Tenant lean methodology
- Overall (STATE)
- 90 Strongly Landlord-Friendly
- State South Carolina
- 90 Strongly Landlord-Friendly · R+6
- County
- — inherits STATE
- City
- — inherits STATE
ZIP-level market 29306
- Home prices YoY
- -29.9%
- Rents YoY
- 3.5%
- Active inventory
- 234
- Price-to-rent
- 5.9×
Monthly cashflow live
- Estimated rent
- $1,250 high interval (Pro) →
- Mortgage (P&I)
- −$467
- Tax from tax record
- −$215 /mo · $2,580/yr
- Insurance
- −$37
- HOA
- −$0
- Vacancy / Maint / Mgmt
- −$263
- Net cashflow
- $269
Break-even live
UW: 25.0% down · 7.5% · 30yr · 1.5% tax · 5.0% vac · 8.0% maint · 8.0% mgmt
Financing live
Cash to close
- Down payment
- $22,250
- Closing costs
- $2,670
- Reserves months
- —
- Total cash needed
- —
Loan-product check · same deal, 3 products live
Conventional
25% down · 7.5% · 30yr
- Down + closing
- —
- Monthly P&I
- —
- Monthly cashflow
- —
- DSCR
- —
- Eligible?
- —
Personal DTI + credit; lowest rate.
DSCR
20% down · 8.5% · 30yr
- Down + closing
- —
- Monthly P&I
- —
- Monthly cashflow
- —
- DSCR
- —
- Eligible?
- —
No personal income docs; deal must DSCR.
Hard money
10% down · 12.0% · 12mo
- Down + closing
- —
- Monthly P&I
- —
- Monthly cashflow
- —
- DSCR
- —
- Eligible?
- —
Short-term bridge; refi at stabilization.
Rent comps 18 comps
| Address | Beds | Baths | Sqft | Rent | $/sqft | DOM | Units | Dist |
|---|---|---|---|---|---|---|---|---|
| 938 Logan St Unit A Spartanburg, SC | 2.0 | 2.5 | 980 | $1,600 | $1.63 | 21d | 1 | 0.47mi |
| 118 Morningside Dr Spartanburg, SC | 2.0 | 1.0 | 800 | $850 | $1.06 | 21d | 1 | 0.56mi |
| 116 Morningside Dr Spartanburg, SC | 2.0 | 1.0 | 800 | $850 | $1.06 | 21d | 1 | 0.57mi |
| 88 W Park Dr Unit H Spartanburg, SC | 2.0 | 1.0 | 950 | $875 | $0.92 | 21d | 1 | 0.64mi |
| 630 S Converse St Spartanburg, SC | 2.0 | 1.0 | 912 | $995 | $1.09 | 21d | 1 | 0.69mi |
| 111 Timothy St Spartanburg, SC | 2.0 | 1.0 | 1100 | $1,600 | $1.45 | 21d | 1 | 0.78mi |
| 102 Harvard Dr Spartanburg, SC | 2.0 | 1.0 | 1000 | $1,300 | $1.30 | 13d | 1 | 0.81mi |
| 334 W Hampton Ave Unit 1 Spartanburg, SC | 2.0 | 1.0 | 895 | $1,100 | $1.23 | 21d | 1 | 0.81mi |
| 624 Crescent Ave Unit 1 Spartanburg, SC | 2.0 | 1.0 | 819 | $1,000 | $1.22 | 21d | 1 | 0.82mi |
| 300 Amherst Dr Spartanburg, SC | 2.0 | 1.0 | 763 | $975 | $1.28 | 13d | 1 | 1.08mi |
| 327 E Kennedy St Spartanburg, SC | 1.0–2.0 | 1.0–2.0 | 806 | $1,654 | $2.05 | 13d | 7 | 1.09mi |
| 149 S Daniel Morgan Ave Unit 2A Spartanburg, SC | 1.0 | 1.0 | 800 | $1,150 | $1.44 | 21d | 1 | 1.11mi |
| 149 S Daniel Morgan Ave Unit 2B Spartanburg, SC | 1.0 | 1.0 | 750 | $1,195 | $1.59 | 21d | 1 | 1.11mi |
| 174 E Main St Spartanburg, SC | 1.0–2.0 | 1.0–2.0 | 760 | $2,295 | $3.02 | 13d | 8 | 1.23mi |
| 142 Magnolia St Unit 104 Spartanburg, SC | 1.0 | 1.0 | 892 | $1,600 | $1.79 | 21d | 1 | 1.30mi |
| 142 Magnolia St Unit 301 Spartanburg, SC | 2.0 | 2.0 | 937 | $1,850 | $1.97 | 21d | 1 | 1.30mi |
| 1097 Union St Spartanburg, SC | 1.0–2.0 | 1.0–2.0 | 951 | $2,009 | $2.11 | 13d | 21 | 1.35mi |
| 142 Magnolia St Unit 101 Spartanburg, SC | 1.0 | 1.0 | 680 | $1,400 | $2.06 | 21d | 1 | 1.36mi |
Listing history 20 events
-
2026-06-18days on market $89,000 Active 114 DOM
-
2026-06-17days on market $89,000 Active 113 DOM
-
2026-06-16days on market $89,000 Active 112 DOM
-
2026-06-15days on market $89,000 Active 111 DOM
-
2026-06-14days on market $89,000 Active 109 DOM
-
2026-06-13days on market $89,000 Active 108 DOM
-
2026-06-10days on market $89,000 Active 106 DOM
-
2026-06-09days on market $89,000 Active 105 DOM
-
2026-06-08days on market $89,000 Active 104 DOM
-
2026-06-07days on market $89,000 Active 103 DOM
-
2026-06-02days on market $89,000 Active 98 DOM
-
2026-06-01days on market $89,000 Active 97 DOM
-
2026-05-31days on market $89,000 Active 96 DOM
-
2026-05-30days on market $89,000 Active 95 DOM
-
2026-02-24$89,000 Active 414-char remark
Show marketing remark (414 chars)
INVESTOR SPECIAL! This home is waiting for it's new owner to make it one-of-a-kind! 213 Caulder Circle has recently built and renovated homes all around it. ~5 minute drive to Downtown Spartanburg and a short walk or bike ride on the new Mary Wright Greenway bike trail to Rumley and S Converse Parks! Sold as-is. No appraisal required repairs will be made, discuss this with the lender prior to offer submissions.
-
2026-02-24$89,000 Active
Show marketing remark (414 chars)
INVESTOR SPECIAL! This home is waiting for it's new owner to make it one-of-a-kind! 213 Caulder Circle has recently built and renovated homes all around it. ~5 minute drive to Downtown Spartanburg and a short walk or bike ride on the new Mary Wright Greenway bike trail to Rumley and S Converse Parks! Sold as-is. No appraisal required repairs will be made, discuss this with the lender prior to offer submissions.
-
2022-04-20historical
-
2022-04-11historical Contingency Contract
-
2022-03-24$99,000 Active
-
2021-09-14soldstatus $80,000
ⓘ Source: listings_history table (triggers on properties + properties_extension) + one-shot
backfill from property_details.listing_events for pre-trigger history.
Tax reassessment forecast SC · Resets to sale price
- Current annual tax
- $2,580 · $215/mo
- Projected year-2 tax
- $2,580 · $215/mo
- Expected delta
- $0/yr ($0/mo · 0.0%)
ⓘ Screening estimate from a state-policy table — verify with the county assessor before closing.
Climate risk First Street
- Flood 1/10 Low FEMA zone X (unshaded) · 0% chance over 30 yrs
- Wildfire 3/10 Moderate
- Heat 6/10 Major 7 d/yr ≥105°F today · 16 d/yr by 30 yrs out
- Wind 2/10 Low 2% chance of damaging wind over 30 yrs
- Air quality 4/10 Moderate 4 unhealthy d/yr today · 4 by 30 yrs out
Nearby sold comps map
Loading sold comps map…
Walkable amenities ~0.75 mi
Loading nearby amenities…
Taxation est. · year 1
- Rental income
- $15,002
- − Mortgage interest
- −$4,985
- − Property taxes
- −$2,580
- − Insurance
- −$445
- − Repairs & maintenance
- −$1,200
- − Management
- −$1,200
- − Depreciation
- −$2,589
- Taxable income
- $2,003
- Est. tax owed @ 24.0%
- −$481
- After-tax cash flow
- $2,746/yr
For passive investors: Depreciation is non-cash, so a rental often shows a tax loss while cash-flowing — sheltering income. Rental losses are passive: they offset passive income freely, and up to $25,000/yr can offset ordinary (W-2) income if you actively participate and your MAGI is under $100k (phasing out to $0 by $150k); unused losses carry forward. On sale, claimed depreciation is recaptured at up to 25%, and gains may owe capital-gains tax (a 1031 exchange can defer both). Figures are a year-1 estimate at your 24.0% rate — not tax advice; consult a CPA.
Schools (NCES district)
- District
- Spartanburg 07
- NCES district ID
- 4503660
- Math proficiency
- 34% ▼ -1.00%
- Reading proficiency
- 41% ▼ -1.00%
- Median HH income
- $35,825
- Composite
- 31.04/100
- National rank
- #6087
- State rank
- #39 of 80 in SC
Livability — Spartanburg
- Score
- 76/100
- State rank
- #24
- US rank
- #3679
Category grades
Schools grade is shown separately in the Schools card above.
Census & demographics
- Census place
- Spartanburg, SC
- County
- Spartanburg County · 258,607 people
- City population
- 120,406
- Metro
- Spartanburg, SC
- Population (ZIP)
- 16,714
- Household income
- $41,356
- Rent vs Own
- Severe rent burden
- 1064.0
Population outlook (Spartanburg County) Hauer SSP2
- Today (2025)
- 325,495 people
- By 2030
- 338,800 · +4.1%
- By 2040
- 363,471 · +11.7%
- By 2050
- 384,156 · +18.0%
- By 2075
- 430,137 · +32.1%
- By 2100
- 442,733 · +36.0%
Race, ethnicity, and origin ACS 2023
- Neighborhood character
- Diverse neighborhood (Simpson 0.61)
- Race & ethnicity
- Black 50% White 36% Hispanic / Latino 10% Two or more races 9% Asian 1%
- Hispanic origin (detail)
- Mexican 7% Puerto Rican 2%
- Common ancestry
- Slovak 1% Serbian 1% Iranian 1%
- Foreign-born
- 7% · Canada
- Languages at home
- 90% English-only · Spanish 7% Other Indo-European 2%
Political lean MEDSL · Spartanburg
- 2024 margin
- Solid R (+33.6) · D 32.6% · R 66.2% · Other 1.2%
- 2008→2024 swing
- -12.0pp toward R · 2008: -21.6pp · 2024: -33.6pp
- All cycles
- 2024: R+33.6 2020: R+27.3 2016: R+30.0 2012: R+23.1 2008: R+21.6
Not yet ingested
- Civics
- —
Market trends
- HPI YoY
- ▼ -90.67%
- Current HPI
- 213.1266
- Rent YoY
- ▲ 3.46%
- Metro
- Spartanburg, SC
- State GDP YoY
- ▲ 4.51%
- F500 in state
- 2
Industry mix (Fortune 500 HQ in SC)
| Industry | F500 HQs | Revenue |
|---|---|---|
| Packaging | 1 | $7B |
|
||
Price history
+11.2% since first listed6 events — show timeline
- 2026-02-24 Listed $89,000 Greater Greenville MLS
- 2026-02-24 Listed $89,000 SPMLS
- 2022-04-20 Listing Removed — Greater Greenville MLS
- 2022-04-11 Contingent — Greater Greenville MLS
- 2022-03-24 Listed $99,000 Greater Greenville MLS
- 2021-09-14 Sold (Public Records) $80,000 Public Records
Property tax history
+9.1%/yrLatest (2025): $2,580 · +0.6% YoY. Source: county tax records.
Cash-flow waterfall
monthlySold comps — $/sqft
last 12 mo · ≤1 miLoading sold comps…