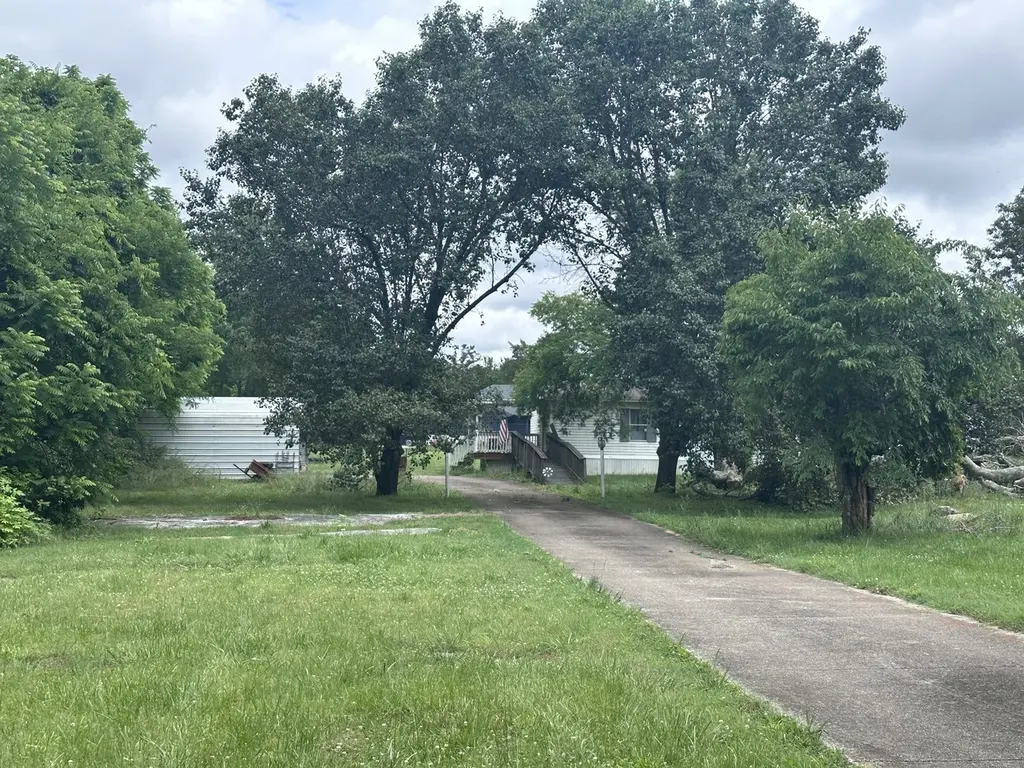
4739 Bradyville Pike · Murfreesboro, TN
Flood risk 1/10 · Minimal
- FEMA flood zone
- X (unshaded)
- Chance of flooding over 30 yrs
- 0.0%
- Est. flood insurance / yr
- $507 – $1,088
Fire risk 3/10 · Minor
- Est. fire insurance / yr
- $949 – $1,763
Heat risk 5/10 · Moderate
- Hot days now (above 105°F)
- 7 days/yr
- Hot days in 30 yrs
- 20 days/yr
Wind risk 4/10 · Minor
- Chance of severe wind over 30 yrs
- 11.0%
Air-quality risk 2/10 · Minimal
- Unhealthy air days now
- 1 days/yr
- Unhealthy air days in 30 yrs
- 2 days/yr
Risk factors via First Street. Map © Google.
Why this score? — see what drove the B- grade
The composite is a weighted blend of 9 inputs, each scored 0–100. Each bar is that input's sub-score; the figure is the points it added to the 100-point composite (weight × sub-score).
- Cash flow +29.4/30.0
- DSCR +10.0/10.0
- ARV discount +7.5/15.0
- 1% rule +7.1/10.0
- Livability +3.8/5.0
- Rent growth +3.6/5.0
- Schools +3.2/10.0
- Condition / age +2.5/5.0
- Appreciation +0.0/10.0
$199,900
🖨 Deal sheet 📄 Offer letter ✓ Due diligence
Listing remarks MLS
Property has been survey and perk site has been recorded with Rutherford County, building site is ready. Lot is perked for 4 bedrooms.
Key facts
- 2.22 acre lot
- 8 parking spots
- Built 1997
Neighborhood map
What this means for you Summary
Snapshot
- This is a 3-bed/2.0-bath other listed at $200k.
Deal economics
- At list price, monthly cash flow is $711 ($9k/yr) — positive.
- The deal already cash-flows at list — no discount required.
- Meets the 1% rule at list price ($2k rent vs $200k).
- Cap rate 10.6% vs local median 3.0% in Murfreesboro — top-decile yield for the area; either an underpriced asset or a hidden risk that comps aren't pricing in. Stress-test before assuming the spread holds.
Location & tenants
- Location reads 76/100 on livability (#10 in TN, #3,499 nationally) — a middle-class / working-renter tenant base. Strengths: amenities A+, housing A+, health & safety A+; Watch: crime D, commute F.
- Rutherford County (suburban): math 34% / reading 37% proficiency, ranked #22 of 139 in TN (top 16%) — families likely to look elsewhere, expect single-tenant / working-renter base with shorter leases.
- Zoned schools: Kittrell Elementary (math 22% / reading 32%, grade F, #496 of 952 statewide, top 55%, 337 students, 0% FRL); Oakland High School (math 10% / reading 49%, grade F, #86 of 332 statewide, top 27%, 1,980 students, 0% FRL) — zoned schools average 0% FRL vs 36% district-wide (36 pts lower); this property's tenant base skews higher-income than the district average.
- Market conditions: Rents rising fast (+4.6%/yr); 241 active listings in the ZIP; 8 comparable units currently listed for rent nearby; rentals leasing fast (median 7d on market — plan ~1-2 weeks tenant-placement turnaround); solid renter incomes; 3,421 units permitted in Rutherford County in 2024 (400 in 5+ unit buildings).
- This rent runs 32% of the median local income ($91k/yr) — at the standard rent-burdened threshold; future hikes will face affordability resistance.
Forward outlook
- Local home prices are declining (-3.0%/yr); year-one equity from $1k of loan paydown is wiped out by about $6k of value loss. Plan a longer hold.
- Rutherford County population projected at +60% by 2050 — long-run rental-demand tailwind backs the buy-and-hold thesis.
- At projected returns (-3.0% appreciation + 4.6% rent growth), your $56k cash investment doubles in ~7 years — after that, you're playing with house money.
Negotiation context
- Only 0 days on market — expect competitive offers; lowballing is unlikely to land.
- 3 sale attempts since 3y ago with the ask held roughly flat each time — persistent listings suggest the price (not the market) is what's stuck; bring a comps-based counter.
- Current owner paid $150k; 33% above their basis — modest negotiation headroom, anchor on the comps not their cost.
Risks & watch-outs
- Climate carrying-cost: extreme-heat days projected 7→20/yr by 2055 (HVAC capex compounding) — expect insurance premiums to compound above CPI over the hold.
Questions for the listing agent
- Is there a deadline driving the sale (1031 exchange, divorce, estate, relocation)? That informs how much negotiation room exists.
- Crime grade is D in this area — have there been break-ins, vandalism, or insurance claims at this property in the last 3 years? What carrier currently insures it and at what premium?
- What's the average days-on-market for RENTAL listings here right now (not sales)? A rising rental-DOM trend means longer vacancies and softer asking-rent achievability than the comps imply.
- What's the recent tenant-quality profile in this submarket — average credit score on applications, eviction rate, late-payment / NSF rate, and stable-employment percentage? A property-management company in the area should have these aggregated.
- How much new for-sale + rental construction is in the pipeline within 1–3 miles? Heavy new supply typically softens prices + rents 12–24 months out; constrained supply supports both.
Investment metrics
- 1% rule
- 1.21% ✓
- Cap rate
- 10.56%
- Cash-on-cash
- 15.24%
- DSCR
- 1.68
- GRM
- 6.9
CMA / ARV
No comps found within radius.
Projected returns pro-forma
-3.0% appreciation · 4.56% rent growth · sell at horizon
- IRR
- 7.5%
- Equity multiple
- 1.30×
- Total profit
- $16,647
- Equity at exit
- $29,806
- IRR
- 18.0%
- Equity multiple
- 2.59×
- Total profit
- $88,753
- Equity at exit
- $17,284
Cash invested: $55,972 (down + closing). Projections, not guarantees.
Landlord ↔ Tenant lean methodology
- Overall (STATE)
- 87 Strongly Landlord-Friendly
- State Tennessee
- 87 Strongly Landlord-Friendly · R+13
- County
- — inherits STATE
- City
- — inherits STATE
ZIP-level market 37127
- Home prices YoY
- -22.0%
- Rents YoY
- 4.6%
- Active inventory
- 241
- Price-to-rent
- 6.9×
Monthly cashflow live
- Estimated rent
- $2,411 high interval (Pro) →
- Mortgage (P&I)
- −$1,048
- Tax from tax record
- −$62 /mo · $742/yr
- Insurance
- −$83
- HOA
- −$0
- Vacancy / Maint / Mgmt
- −$506
- Net cashflow
- $711
Break-even live
UW: 25.0% down · 7.5% · 30yr · 1.5% tax · 5.0% vac · 8.0% maint · 8.0% mgmt
Financing live
Cash to close
- Down payment
- $49,975
- Closing costs
- $5,997
- Reserves months
- —
- Total cash needed
- —
Loan-product check · same deal, 3 products live
Conventional
25% down · 7.5% · 30yr
- Down + closing
- —
- Monthly P&I
- —
- Monthly cashflow
- —
- DSCR
- —
- Eligible?
- —
Personal DTI + credit; lowest rate.
DSCR
20% down · 8.5% · 30yr
- Down + closing
- —
- Monthly P&I
- —
- Monthly cashflow
- —
- DSCR
- —
- Eligible?
- —
No personal income docs; deal must DSCR.
Hard money
10% down · 12.0% · 12mo
- Down + closing
- —
- Monthly P&I
- —
- Monthly cashflow
- —
- DSCR
- —
- Eligible?
- —
Short-term bridge; refi at stabilization.
Rent comps 8 comps
| Address | Beds | Baths | Sqft | Rent | $/sqft | DOM | Units | Dist |
|---|---|---|---|---|---|---|---|---|
| 2415 Nabali Way Murfreesboro, TN | 4.0 | 2.0 | 2237 | $2,510 | $1.12 | 2d | 1 | 0.82mi |
| 2407 Nabali Way Murfreesboro, TN | 4.0 | 2.0 | 2237 | $2,510 | $1.12 | 2d | 1 | 0.83mi |
| 3333 Quintana Dr Murfreesboro, TN | 3.0 | 2.0 | 1853 | $2,360 | $1.27 | 10d | 1 | 0.88mi |
| 2425 Alberto Dr Murfreesboro, TN | 4.0 | 2.5 | 2198 | $2,550 | $1.16 | 1d | 1 | 0.93mi |
| 2413 Alberto Dr Murfreesboro, TN | 4.0 | 2.5 | 2074 | $2,615 | $1.26 | 1d | 1 | 0.94mi |
| 3108 Citrine Dr Murfreesboro, TN | 4.0 | 2.5 | 2018 | $2,450 | $1.21 | 21d | 1 | 1.28mi |
| 3108 Citrine Dr Murfreesboro, TN | 4.0 | 2.5 | 2018 | $2,450 | $1.21 | 7d | 1 | 1.28mi |
| 3016 Pellas Pl Murfreesboro, TN | 3.0 | 2.0 | 1290 | $2,095 | $1.62 | 7d | 1 | 1.37mi |
Listing history 7 events
-
2026-05-26$199,900
-
2026-05-26historical
-
2023-10-17soldstatus $150,000 Closed 135-char remark
Show marketing remark (135 chars)
Property has been survey and perk site has been recorded with Rutherford County, building site is ready. Lot is perked for 4 bedrooms.
-
2023-10-06status Pending 135-char remark
Show marketing remark (135 chars)
Property has been survey and perk site has been recorded with Rutherford County, building site is ready. Lot is perked for 4 bedrooms.
-
2023-09-11$210,000 Active 135-char remark
Show marketing remark (135 chars)
Property has been survey and perk site has been recorded with Rutherford County, building site is ready. Lot is perked for 4 bedrooms.
-
2023-09-01historical 135-char remark
Show marketing remark (135 chars)
Property has been survey and perk site has been recorded with Rutherford County, building site is ready. Lot is perked for 4 bedrooms.
-
2023-07-19$250,000 Active 135-char remark
Show marketing remark (135 chars)
Property has been survey and perk site has been recorded with Rutherford County, building site is ready. Lot is perked for 4 bedrooms.
ⓘ Source: listings_history table (triggers on properties + properties_extension) + one-shot
backfill from property_details.listing_events for pre-trigger history.
Tax reassessment forecast TN · Resets to sale price
- Current annual tax
- $742 · $62/mo
- Projected year-2 tax
- $1,419 · $118/mo
- Expected delta
- +$677/yr (+$56/mo · 91.3%)
ⓘ Screening estimate from a state-policy table — verify with the county assessor before closing.
Climate risk First Street
- Flood 1/10 Low FEMA zone X (unshaded) · 0% chance over 30 yrs
- Wildfire 3/10 Moderate
- Heat 5/10 Major 7 d/yr ≥105°F today · 20 d/yr by 30 yrs out
- Wind 4/10 Moderate 11% chance of damaging wind over 30 yrs
- Air quality 2/10 Low 1 unhealthy d/yr today · 2 by 30 yrs out
Nearby sold comps map
Loading sold comps map…
Walkable amenities ~0.75 mi
Loading nearby amenities…
Taxation est. · year 1
- Rental income
- $28,926
- − Mortgage interest
- −$11,198
- − Property taxes
- −$742
- − Insurance
- −$1,000
- − Repairs & maintenance
- −$2,314
- − Management
- −$2,314
- − Depreciation
- −$5,815
- Taxable income
- $5,544
- Est. tax owed @ 24.0%
- −$1,331
- After-tax cash flow
- $7,200/yr
For passive investors: Depreciation is non-cash, so a rental often shows a tax loss while cash-flowing — sheltering income. Rental losses are passive: they offset passive income freely, and up to $25,000/yr can offset ordinary (W-2) income if you actively participate and your MAGI is under $100k (phasing out to $0 by $150k); unused losses carry forward. On sale, claimed depreciation is recaptured at up to 25%, and gains may owe capital-gains tax (a 1031 exchange can defer both). Figures are a year-1 estimate at your 24.0% rate — not tax advice; consult a CPA.
Schools (NCES district)
- District
- Rutherford County
- NCES district ID
- 4703690
- Math proficiency
- 34% ▼ -11.00%
- Reading proficiency
- 37% ▼ -4.00%
- Median HH income
- $59,872
- Composite
- 31.7/100
- National rank
- #5917
- State rank
- #22 of 139 in TN
Livability — Murfreesboro
- Score
- 76/100
- State rank
- #10
- US rank
- #3499
Category grades
Schools grade is shown separately in the Schools card above.
Census & demographics
- County
- Rutherford County · 327,859 people
- City population
- 222,483
- Metro
- Nashville-Davidson--Murfreesboro--Franklin, TN
- Population (ZIP)
- 21,499
- Household income
- $91,401
- Rent vs Own
- Severe rent burden
- 290.0
Population outlook (Rutherford County) Hauer SSP2
- Today (2025)
- 385,165 people
- By 2030
- 430,283 · +11.7%
- By 2040
- 523,241 · +35.8%
- By 2050
- 616,830 · +60.1%
- By 2075
- 848,777 · +120.4%
- By 2100
- 1,028,900 · +167.1%
Race, ethnicity, and origin ACS 2023
- Neighborhood character
- Majority White (65%)
- Race & ethnicity
- White 65% Black 18% Hispanic / Latino 10% Two or more races 7% Asian 3% Pacific Islander 2%
- Hispanic origin (detail)
- Mexican 4% Puerto Rican 3%
- Common ancestry
- Portuguese 3% Slovak 2% Romanian 2%
- Foreign-born
- 7% · Canada
- Languages at home
- 91% English-only · Spanish 5% Other Asian/Pacific 2% Arabic 1%
Political lean MEDSL · Rutherford
- 2024 margin
- Strong R (+21.8) · D 38.4% · R 60.1% · Other 1.5%
- 2008→2024 swing
- -2.7pp toward R · 2008: -19.1pp · 2024: -21.8pp
- All cycles
- 2024: R+21.8 2020: R+15.4 2016: R+26.1 2012: R+24.7 2008: R+19.1
Not yet ingested
- Civics
- —
Market trends
- HPI YoY
- ▼ -86.46%
- Current HPI
- 306.3085
- Rent YoY
- ▲ 4.56%
- Metro
- Nashville-Davidson--Murfreesboro--Franklin, TN
- State GDP YoY
- ▲ 2.78%
- F500 in state
- 22
Industry mix (Fortune 500 HQ in TN)
| Industry | F500 HQs | Revenue |
|---|---|---|
| Healthcare | 3 | $91B |
|
||
| Retail | 3 | $72B |
|
||
| Transportation / Logistics | 1 | $88B |
|
||
| Paper / Packaging | 1 | $19B |
|
||
| Insurance | 1 | $13B |
|
||
| Energy | 1 | $12B |
|
||
Price history
-20.0% since first listed7 events — show timeline
- 2026-05-26 Listed $199,900 REALTRACS as Distributed by MLS Grid
- 2026-05-26 Listing Removed — REALTRACS as Distributed by MLS Grid
- 2023-10-17 Sold (MLS) $150,000 REALTRACS as Distributed by MLS Grid
- 2023-10-06 Pending — REALTRACS as Distributed by MLS Grid
- 2023-09-11 Listed $210,000 REALTRACS as Distributed by MLS Grid
- 2023-09-01 Listing Removed — REALTRACS as Distributed by MLS Grid
- 2023-07-19 Listed $250,000 REALTRACS as Distributed by MLS Grid
Property tax history
+0.2%/yrLatest (2025): $742 · +0.0% YoY. Source: county tax records.
Cash-flow waterfall
monthlySold comps — $/sqft
last 12 mo · ≤1 miLoading sold comps…