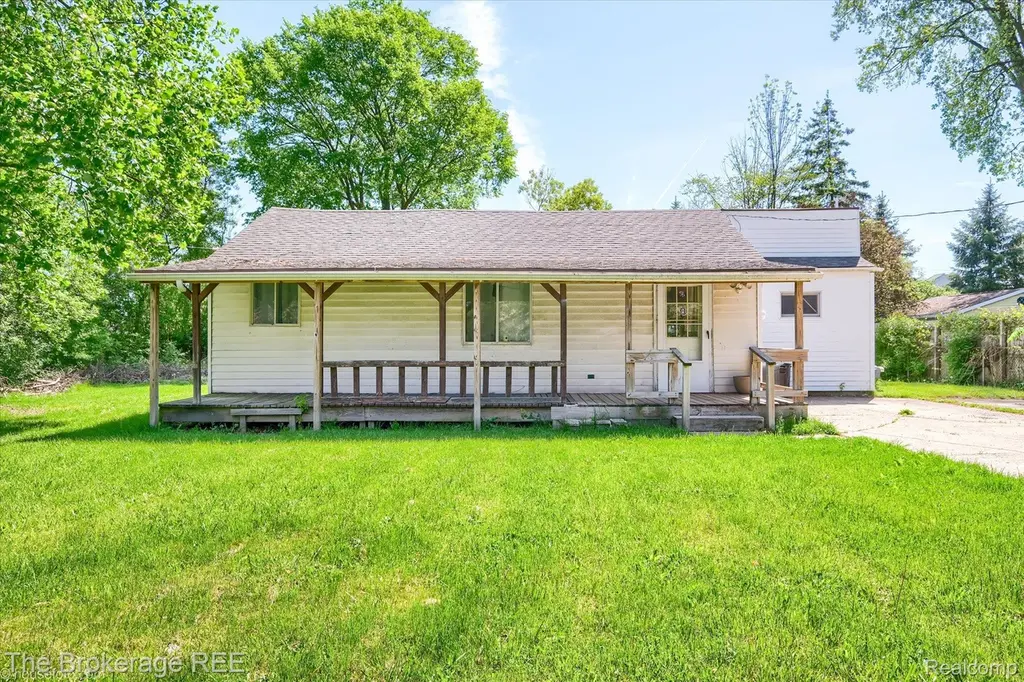
2453 Clarice Ave · Burton, MI
Flood risk 1/10 · Minimal
- FEMA flood zone
- X (unshaded)
- Chance of flooding over 30 yrs
- 0.0%
- Est. flood insurance / yr
- $507 – $1,088
Fire risk 1/10 · Minimal
- Est. fire insurance / yr
- $784 – $1,456
Heat risk 2/10 · Minimal
- Hot days now (above 96°F)
- 7 days/yr
- Hot days in 30 yrs
- 15 days/yr
Wind risk 2/10 · Minimal
- Chance of severe wind over 30 yrs
- —
Air-quality risk 3/10 · Minor
- Unhealthy air days now
- 2 days/yr
- Unhealthy air days in 30 yrs
- 3 days/yr
Risk factors via First Street. Map © Google.
Why this score? — see what drove the B grade
The composite is a weighted blend of 9 inputs, each scored 0–100. Each bar is that input's sub-score; the figure is the points it added to the 100-point composite (weight × sub-score).
- Cash flow +30.0/30.0
- ARV discount +15.0/15.0
- 1% rule +10.0/10.0
- DSCR +10.0/10.0
- Livability +3.1/5.0
- Rent growth +2.5/5.0
- Condition / age +2.5/5.0
- Schools +1.5/10.0
- Appreciation +0.0/10.0
$59,900
🖨 Deal sheet 📄 Offer letter ✓ Due diligence
Listing remarks MLS
Great opportunity in Burton! Located in the Atherton School District, 2453 Clarice offers 3 bedrooms, a spacious yard and tons of potential for the buyer ready to roll up their sleeves and build instant sweat equity. Whether you are looking for your next investment property, fixer upper or affordable place to make your own, this home is loaded with possibilities. Convenient location near schools, shopping, restaurants and expressways. Bring your vision, tool belt and creativity because at only $59,900 this opportunity will not last long. Cash or conventional financing preferred. Call today for your private showing!
Key facts
- Spacious yard
- Near schools
- Near shopping
Tags
Property features AI
Finance
- Other: Lot approximately 0.35 acres (dimensions: 98 x 151 x 100 x 149); Located in the MILLER HEIGHTS subdivision
- Financial info: Annual tax information available
Exterior
- Parking: Detached garage (1 car)
- Utilities: Private well water; Public sewer
- Home design: Single-family residence; One story; Ground-level entry with steps; Vinyl siding
- Construction: Block foundation; Asphalt roof; Built with vinyl siding
- Exterior features: Covered porch; Fenced yard; Dirt road access
Interior
- Kitchen: Free-standing electric range
- Bathrooms: One full bathroom
- Heating & cooling: Forced air heating; Natural gas heating; No central air cooling
- Interior features: Gas water heater; Free-standing electric range; Crawl space
- Laundry & utility: Dedicated laundry room
Neighborhood map
What this means for you Summary
Snapshot
- This is a 3-bed/1.0-bath single-family listed at $60k.
Deal economics
- At list price, monthly cash flow is $494 ($6k/yr) — positive.
- The deal already cash-flows at list — no discount required.
- Meets the 1% rule at list price ($1k rent vs $60k).
- Cap rate 16.2% vs local median 3.8% in Burton — top-decile yield for the area; either an underpriced asset or a hidden risk that comps aren't pricing in. Stress-test before assuming the spread holds.
Location & tenants
- Location reads 61/100 on livability (#555 in MI) — a middle-class / working-renter tenant base. Strengths: cost of living A+, housing A+; Watch: employment D, schools F, crime F.
- Atherton Community Schools (suburban): math 13% / reading 23% proficiency, ranked #481 of 540 in MI (top 89%) — low school quality limits family demand, transient renter base, plan for 1-2y turnover; 67% free/reduced lunch — lower-income household profile, screen leases tightly.
- Market conditions: 108 active listings in the ZIP; 5 comparable units currently listed for rent nearby; rentals leasing fast (median 13d on market — plan ~1-2 weeks tenant-placement turnaround); 419 units permitted in Genesee County in 2024 (68 in 5+ unit buildings).
Forward outlook
- Local home prices are declining (-3.0%/yr); year-one equity from $414 of loan paydown is wiped out by about $2k of value loss. Plan a longer hold.
- Genesee County population projected at -27% by 2050 — secular population decline; favor cash flow + early exit over multi-decade hold.
- At projected returns (-3.0% appreciation + 3.0% rent growth), your $17k cash investment doubles in ~4 years — after that, you're playing with house money.
Negotiation context
- Only 1 days on market — expect competitive offers; lowballing is unlikely to land.
- 10 sale attempts since 25y ago with the ask held roughly flat each time — persistent listings suggest the price (not the market) is what's stuck; bring a comps-based counter.
Risks & watch-outs
- Watch-outs: built in 1949 — expect roof / HVAC / electrical / plumbing capex.
Questions for the listing agent
- Built in 1949 — when were the roof, HVAC, electrical panel, plumbing, and water heater last replaced?
- Is there a deadline driving the sale (1031 exchange, divorce, estate, relocation)? That informs how much negotiation room exists.
- Schools are F-rated, which usually means shorter tenancies and higher turnover. Who's the typical renter profile here, and what's been the actual vacancy rate?
- Crime grade is F in this area — have there been break-ins, vandalism, or insurance claims at this property in the last 3 years? What carrier currently insures it and at what premium?
- What's the average days-on-market for RENTAL listings here right now (not sales)? A rising rental-DOM trend means longer vacancies and softer asking-rent achievability than the comps imply.
- What's the recent tenant-quality profile in this submarket — average credit score on applications, eviction rate, late-payment / NSF rate, and stable-employment percentage? A property-management company in the area should have these aggregated.
- How much new for-sale + rental construction is in the pipeline within 1–3 miles? Heavy new supply typically softens prices + rents 12–24 months out; constrained supply supports both.
Investment metrics
- 1% rule
- 1.99% ✓
- Cap rate
- 16.18%
- Cash-on-cash
- 35.31%
- DSCR
- 2.57
- GRM
- 4.2
CMA / ARV
- ARV (on-the-fly)
- $109,480
- Comps found
- 12
Show comp detail 12 sales within ~0.75 mi
| Address | Dist | Beds/Ba | Sqft | Sold | Price | $/sf | Match |
|---|---|---|---|---|---|---|---|
| 2453 Clarice Ave | 0.00mi | 3/1.0 | 1,190 (0%) | 0mo | $60,000 | $50 | 100 |
| 3068 Clarice St | 0.26mi | 3/1.0 | 1,138 (-4%) | 14mo | $90,000 | $79 | 69 |
| 3068 Clarice St | 0.26mi | 3/1.0 | 1,138 (-4%) | 14mo | $90,000 | $79 | 69 |
| 3399 Bilsky St | 0.48mi | 3/1.0 | 1,166 (-2%) | 11mo | $125,000 | $107 | 65 |
| 3266 Sayre Ct | 0.44mi | 3/1.0 | 1,200 (+1%) | 17mo | $110,000 | $92 | 64 |
| 4269 E Atherton Rd | 0.61mi | 3/1.5 | 1,180 (-1%) | 6mo | $200,000 | $169 | 64 |
| 2307 S Term St | 0.42mi | 2/1.5 (-1) | 1,046 (-12%) | 6mo | $139,000 | $133 | 49 |
| 2251 Howe Rd | 0.70mi | 2/1.0 (-1) | 1,051 (-12%) | 0mo | $83,000 | $79 | 43 |
| 2137 S Term St | 0.68mi | 2/1.0 (-1) | 1,119 (-6%) | 17mo | $100,500 | $90 | 39 |
| 2183 Morrish St | 0.56mi | 2/2.0 (-1) | 1,296 (+9%) | 18mo | $60,000 | $46 | 35 |
| 3106 S Term St | 0.51mi | 2/1.0 (-1) | 1,015 (-15%) | 16mo | $110,000 | $108 | 33 |
| 2237 Howe Rd | 0.71mi | 3/1.0 | 1,019 (-14%) | 14mo | $130,000 | $128 | 31 |
Match score weights: distance 35% · size 25% · config 20% · recency 20%. Top-matched comps best support the ARV.
Projected returns pro-forma
-3.0% appreciation · 3.0% rent growth · sell at horizon
- IRR
- 30.9%
- Equity multiple
- 2.30×
- Total profit
- $21,768
- Equity at exit
- $8,931
- IRR
- 38.1%
- Equity multiple
- 4.55×
- Total profit
- $59,590
- Equity at exit
- $5,179
Cash invested: $16,772 (down + closing). Projections, not guarantees.
Landlord ↔ Tenant lean methodology
- Overall (STATE)
- 62 Landlord-Friendly
- State Michigan
- 62 Landlord-Friendly · EVEN
- County
- — inherits STATE
- City
- — inherits STATE
ZIP-level market 48519
- Home prices YoY
- -20.5%
- Active inventory
- 108
- Price-to-rent
- 4.2×
Monthly cashflow live
- Estimated rent
- $1,191 high interval (Pro) →
- Mortgage (P&I)
- −$314
- Tax from tax record
- −$108 /mo · $1,294/yr
- Insurance
- −$25
- HOA
- −$0
- Vacancy / Maint / Mgmt
- −$250
- Net cashflow
- $494
Break-even live
UW: 25.0% down · 7.5% · 30yr · 1.5% tax · 5.0% vac · 8.0% maint · 8.0% mgmt
Financing live
Cash to close
- Down payment
- $14,975
- Closing costs
- $1,797
- Reserves months
- —
- Total cash needed
- —
Loan-product check · same deal, 3 products live
Conventional
25% down · 7.5% · 30yr
- Down + closing
- —
- Monthly P&I
- —
- Monthly cashflow
- —
- DSCR
- —
- Eligible?
- —
Personal DTI + credit; lowest rate.
DSCR
20% down · 8.5% · 30yr
- Down + closing
- —
- Monthly P&I
- —
- Monthly cashflow
- —
- DSCR
- —
- Eligible?
- —
No personal income docs; deal must DSCR.
Hard money
10% down · 12.0% · 12mo
- Down + closing
- —
- Monthly P&I
- —
- Monthly cashflow
- —
- DSCR
- —
- Eligible?
- —
Short-term bridge; refi at stabilization.
Rent comps 5 comps
| Address | Beds | Baths | Sqft | Rent | $/sqft | DOM | Units | Dist |
|---|---|---|---|---|---|---|---|---|
| 132 Pine Blf Flint, MI | 3.0 | 2.0 | 960 | $953 | $0.99 | 43d | 1 | 0.76mi |
| 3440 Creekside Blvd Burton, MI | 3.0 | 2.0 | 1512 | $1,424 | $0.94 | 13d | 1 | 1.08mi |
| 4509 Cheyenne Ave Flint, MI | 3.0 | 1.5 | 1200 | $1,400 | $1.17 | 13d | 1 | 1.19mi |
| 1034 McKeighan Ave Flint, MI | 3.0 | 1.0 | 1040 | $1,250 | $1.20 | 21d | 1 | 1.22mi |
| 805 E Hemphill Rd Flint, MI | 3.0 | 1.5 | 1200 | $1,000 | $0.83 | 13d | 1 | 1.41mi |
Listing history 22 events
-
2026-05-22$59,900 Active 622-char remark
Show marketing remark (622 chars)
Great opportunity in Burton! Located in the Atherton School District, 2453 Clarice offers 3 bedrooms, a spacious yard and tons of potential for the buyer ready to roll up their sleeves and build instant sweat equity. Whether you are looking for your next investment property, fixer upper or affordable place to make your own, this home is loaded with possibilities. Convenient location near schools, shopping, restaurants and expressways. Bring your vision, tool belt and creativity because at only $59,900 this opportunity will not last long. Cash or conventional financing preferred. Call today for your private showing!
-
2026-05-22$59,900 Active
Show marketing remark (622 chars)
Great opportunity in Burton! Located in the Atherton School District, 2453 Clarice offers 3 bedrooms, a spacious yard and tons of potential for the buyer ready to roll up their sleeves and build instant sweat equity. Whether you are looking for your next investment property, fixer upper or affordable place to make your own, this home is loaded with possibilities. Convenient location near schools, shopping, restaurants and expressways. Bring your vision, tool belt and creativity because at only $59,900 this opportunity will not last long. Cash or conventional financing preferred. Call today for your private showing!
-
2015-06-08historical
-
2014-09-24historical
-
2014-06-04$25,000
-
2014-06-04$25,000
-
2010-12-06historical
-
2008-05-12historical
-
2007-11-12$85,200
-
2007-11-12$85,200
-
2004-07-14soldstatus $80,100
-
2004-07-02soldstatus $80,100
-
2004-07-02soldstatus $80,100
-
2004-05-24historical
-
2004-04-20$79,900
-
2004-04-20$79,900
-
2002-03-13soldstatus $75,000
-
2001-10-30soldstatus $74,900
-
2001-10-30soldstatus $74,900
-
2001-10-29historical
-
2001-05-14$89,900
-
2001-05-14$89,900
ⓘ Source: listings_history table (triggers on properties + properties_extension) + one-shot
backfill from property_details.listing_events for pre-trigger history.
Tax reassessment forecast MI · Partial reset (capped growth)
- Current annual tax
- $1,294 · $108/mo
- Projected year-2 tax
- $1,294 · $108/mo
- Expected delta
- $0/yr ($0/mo · 0.0%)
ⓘ Screening estimate from a state-policy table — verify with the county assessor before closing.
Climate risk First Street
- Flood 1/10 Low FEMA zone X (unshaded) · 0% chance over 30 yrs
- Wildfire 1/10 Low
- Heat 2/10 Low 7 d/yr ≥96°F today · 15 d/yr by 30 yrs out
- Wind 2/10 Low
- Air quality 3/10 Moderate 2 unhealthy d/yr today · 3 by 30 yrs out
Nearby sold comps map
Loading sold comps map…
Walkable amenities ~0.75 mi
Loading nearby amenities…
Taxation est. · year 1
- Rental income
- $14,286
- − Mortgage interest
- −$3,355
- − Property taxes
- −$1,294
- − Insurance
- −$300
- − Repairs & maintenance
- −$1,143
- − Management
- −$1,143
- − Depreciation
- −$1,743
- Taxable income
- $5,309
- Est. tax owed @ 24.0%
- −$1,274
- After-tax cash flow
- $4,649/yr
For passive investors: Depreciation is non-cash, so a rental often shows a tax loss while cash-flowing — sheltering income. Rental losses are passive: they offset passive income freely, and up to $25,000/yr can offset ordinary (W-2) income if you actively participate and your MAGI is under $100k (phasing out to $0 by $150k); unused losses carry forward. On sale, claimed depreciation is recaptured at up to 25%, and gains may owe capital-gains tax (a 1031 exchange can defer both). Figures are a year-1 estimate at your 24.0% rate — not tax advice; consult a CPA.
Schools (NCES district)
- District
- Atherton Community Schools
- NCES district ID
- 2603540
- Math proficiency
- 13% ▼ -2.00%
- Reading proficiency
- 23% ▼ -9.00%
- Median HH income
- $39,416
- Composite
- 15.21/100
- National rank
- #9341
- State rank
- #481 of 540 in MI
Livability — Burton
- Score
- 61/100
- State rank
- #555
- US rank
- #17380
Category grades
Schools grade is shown separately in the Schools card above.
Census & demographics
- Census place
- Burton, MI
- City population
- 26,014
- Population (ZIP)
- 7,523
Population outlook (Genesee County) Hauer SSP2
- Today (2025)
- 381,312 people
- By 2030
- 362,731 · -4.9%
- By 2040
- 321,550 · -15.7%
- By 2050
- 279,212 · -26.8%
- By 2075
- 193,336 · -49.3%
- By 2100
- 128,118 · -66.4%
Race, ethnicity, and origin ACS 2023
- Neighborhood character
- Predominantly White (76%)
- Race & ethnicity
- White 76% Black 14% Hispanic / Latino 5% Two or more races 5%
- Hispanic origin (detail)
- Mexican 4%
- Common ancestry
- Romanian 6% Lithuanian 3% Slovak 2%
- Foreign-born
- 1%
- Languages at home
- 97% English-only · Spanish 2%
Political lean MEDSL · Genesee
- 2024 margin
- Toss-up / Even · D 51.4% · R 47.2% · Other 1.4%
- 2008→2024 swing
- -28.3pp toward R · 2008: 32.5pp · 2024: 4.2pp
- All cycles
- 2024: D+4.2 2020: D+9.3 2016: D+9.5 2012: D+28.2 2008: D+32.5
Not yet ingested
- Civics
- —
Market trends
- HPI YoY
- ▼ -65.66%
- Current HPI
- 255.0753
- Rent YoY
- —
- Metro
- —
- State GDP YoY
- ▲ 1.37%
- F500 in state
- 28
Industry mix (Fortune 500 HQ in MI)
| Industry | F500 HQs | Revenue |
|---|---|---|
| Automotive Parts | 3 | $48B |
|
||
| Automotive | 2 | $372B |
|
||
| Chemicals | 1 | $45B |
|
||
| Automotive Retail | 1 | $29B |
|
||
| Healthcare / Medical Devices | 1 | $23B |
|
||
| Automotive Technology | 1 | $20B |
|
||
Price history
-33.4% since first listed22 events — show timeline
- 2026-05-22 Listed $59,900 REALCOMP
- 2026-05-22 Listed $59,900 MiRealSource-MiMLS
- 2015-06-08 Listing Removed — REALCOMP
- 2014-09-24 Listing Removed — MiRealSource-MiMLS
- 2014-06-04 Listed $25,000 MiRealSource-MiMLS
- 2014-06-04 Listed $25,000 REALCOMP
- 2010-12-06 Listing Removed — REALCOMP
- 2008-05-12 Listing Removed — MiRealSource-MiMLS
- 2007-11-12 Listed $85,200 MiRealSource-MiMLS
- 2007-11-12 Listed $85,200 REALCOMP
- 2004-07-14 Sold (Public Records) $80,100 Public Records
- 2004-07-02 Sold (MLS) $80,100 REALCOMP
- 2004-07-02 Sold (MLS) $80,100 MiRealSource-MiMLS
- 2004-05-24 Listing Removed — MiRealSource-MiMLS
- 2004-04-20 Listed $79,900 REALCOMP
- 2004-04-20 Listed $79,900 MiRealSource-MiMLS
- 2002-03-13 Sold (Public Records) $75,000 Public Records
- 2001-10-30 Sold (MLS) $74,900 MiRealSource-MiMLS
- 2001-10-30 Sold (MLS) $74,900 REALCOMP
- 2001-10-29 Listing Removed — MiRealSource-MiMLS
- 2001-05-14 Listed $89,900 MiRealSource-MiMLS
- 2001-05-14 Listed $89,900 REALCOMP
Property tax history
-0.4%/yrLatest (2025): $1,294 · +2.9% YoY. Source: county tax records.
Cash-flow waterfall
monthlySold comps — $/sqft
last 12 mo · ≤1 miLoading sold comps…