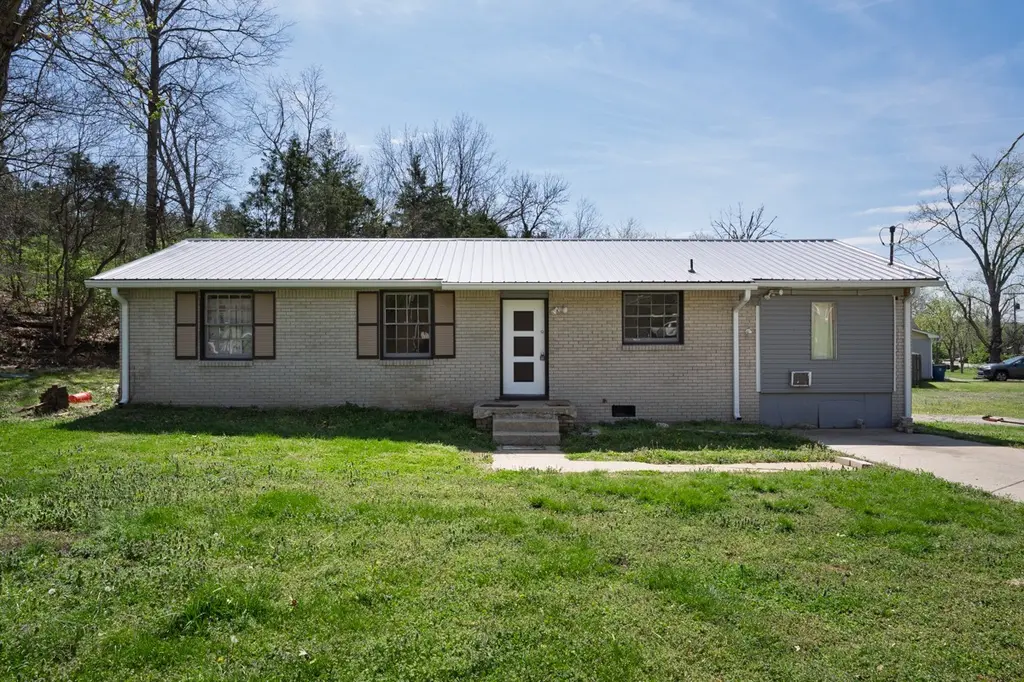
104 Hilltop Dr · Hendersonville, TN
Flood risk 7/10 · Major
- FEMA flood zone
- X (unshaded)
- Chance of flooding over 30 yrs
- 0.77%
- Est. flood insurance / yr
- $473 – $860
Fire risk 3/10 · Minor
- Est. fire insurance / yr
- $949 – $1,763
Heat risk 6/10 · Moderate
- Hot days now (above 105°F)
- 7 days/yr
- Hot days in 30 yrs
- 20 days/yr
Wind risk 4/10 · Minor
- Chance of severe wind over 30 yrs
- 8.0%
Air-quality risk 2/10 · Minimal
- Unhealthy air days now
- 1 days/yr
- Unhealthy air days in 30 yrs
- 3 days/yr
Risk factors via First Street. Map © Google.
Why this score? — see what drove the D grade
The composite is a weighted blend of 9 inputs, each scored 0–100. Each bar is that input's sub-score; the figure is the points it added to the 100-point composite (weight × sub-score).
- ARV discount +15.0/15.0
- Cash flow +10.1/30.0
- Schools +3.6/10.0
- Livability +3.5/5.0
- DSCR +2.9/10.0
- Rent growth +2.7/5.0
- Condition / age +2.5/5.0
- 1% rule +1.8/10.0
- Appreciation +0.0/10.0
$285,000
🖨 Deal sheet (PDF) 📄 Offer letter ✓ Due diligence
Listing remarks MLS
All brick one-level home with beautiful level backyard sitting on little over 1/2 acre. Newer roof with endless possibilities. Great home for first time homebuyer or investor. .Home being sold in AS IS Condition.
Key facts
- 0.52 acre lot
- Built 1971
- Listed 68 days
Neighborhood map
What this means for you Summary
Snapshot
- This is a 3-bed/1.0-bath single-family listed at $285k.
Deal economics
- At list price, monthly cash flow is $-220 ($-3k/yr) — negative.
- To cash-flow at today's rent, offer at most $246k (13.6% below list).
- To meet the 1% rule (rent ≥ 1% of price), the offer needs to be $194k (31.9% below list).
- Recommended offer: $194k (31.9% below list) — sets the bar for 1% rule.
- Cap rate 5.6% vs local median 2.7% in Hendersonville — top-decile yield for the area; either an underpriced asset or a hidden risk that comps aren't pricing in. Stress-test before assuming the spread holds.
Location & tenants
- Location reads 70/100 on livability (#56 in TN) — a middle-class / working-renter tenant base. Strengths: crime A+, housing A+, health & safety A; Watch: amenities F, commute F.
- Sumner County (suburban): math 44% / reading 39% proficiency, ranked #12 of 139 in TN (top 9%) — families likely to look elsewhere, expect single-tenant / working-renter base with shorter leases.
- Market conditions: Rents flat; 677 active listings in the ZIP; 12 comparable units currently listed for rent nearby; rentals at typical pace (median 15d on market — plan ~3-4 weeks tenant-placement turnaround); solid renter incomes; 1,748 units permitted in Sumner County in 2024 (124 in 5+ unit buildings).
Forward outlook
- Local home prices are declining (-3.0%/yr); year-one equity from $2k of loan paydown is wiped out by about $9k of value loss. Plan a longer hold.
- Sumner County population projected at +35% by 2050 — long-run rental-demand tailwind backs the buy-and-hold thesis.
Negotiation context
- It's been on market 68 days — a 6% lower offer ($268k) is reasonable based on typical stale-listing flexibility.
Risks & watch-outs
- Watch-outs: flood insurance adds $56/mo.
- Climate carrying-cost: major flood risk; extreme-heat days projected 7→20/yr by 2055 (HVAC capex compounding) — expect insurance premiums to compound above CPI over the hold.
Questions for the listing agent
- What do current leases actually rent for vs. the listed asking? Can we see a recent rent roll and the last 12 months of T-12 income?
- It's been on market 68 days. Have you received any prior offers? Is the seller open to a 32% concession, seller financing, or rate buy-down credit?
- Built in 1971 — when were the roof, HVAC, electrical panel, plumbing, and water heater last replaced?
- What's the actual annual flood-insurance premium (NFIP or private), and is the property in a SFHA with mandatory coverage?
- Why hasn't it sold? Are there any deal-killer items the seller is aware of (foundation, flood, title, zoning, code violations)?
- Is there a deadline driving the sale (1031 exchange, divorce, estate, relocation)? That informs how much negotiation room exists.
- Schools are A-rated — typically a magnet for longer-tenancy family renters. What's the average tenant stay here, and is there a school-zone premium baked into asking?
- The area grade is low — what's the realistic commute time and amenity access for the typical tenant pool here? Any planned neighborhood developments (good or bad) we should know about?
- What's the average days-on-market for RENTAL listings here right now (not sales)? A rising rental-DOM trend means longer vacancies and softer asking-rent achievability than the comps imply.
- What's the recent tenant-quality profile in this submarket — average credit score on applications, eviction rate, late-payment / NSF rate, and stable-employment percentage? A property-management company in the area should have these aggregated.
- How much new for-sale + rental construction is in the pipeline within 1–3 miles? Heavy new supply typically softens prices + rents 12–24 months out; constrained supply supports both.
Investment metrics
- 1% rule
- 0.68% ✗
- Cap rate
- 5.60%
- Cash-on-cash
- -2.47%
- DSCR
- 0.89
- GRM
- 12.2
CMA / ARV
- ARV (median comp)
- $349,576
- List price
- $285,000
- Delta
- -18.47%
- Verdict
- UNDERPRICED
- Comps
- 18 within 1.0 mi
Show comp detail 4 sales within ~0.75 mi
| Address | Dist | Beds/Ba | Sqft | Sold | Price | $/sf | Match |
|---|---|---|---|---|---|---|---|
| 230 S Valley Rd | 0.11mi | 3/1.0 | 1,271 (-6%) | 4mo | $155,000 | $122 | 82 |
| 116 Ridgecrest Dr | 0.16mi | 3/2.5 | 1,296 (-4%) | 2mo | $350,000 | $270 | 79 |
| 221 S Valley Rd | 0.17mi | 4/2.0 (+1) | 1,378 (+2%) | 21mo | $349,900 | $254 | 62 |
| 107 Hillsdale Dr | 0.41mi | 3/2.0 | 1,230 (-9%) | 11mo | $352,000 | $286 | 53 |
Match score weights: distance 35% · size 25% · config 20% · recency 20%. Top-matched comps best support the ARV.
Projected returns pro-forma
-3.0% appreciation · 0.95% rent growth · sell at horizon
- IRR
- -23.9%
- Equity multiple
- 0.20×
- Total profit
- $-64,229
- Equity at exit
- $42,494
- IRR
- -25.0%
- Equity multiple
- -0.13×
- Total profit
- $-89,854
- Equity at exit
- $24,642
Cash invested: $79,800 (down + closing). Projections, not guarantees.
Landlord ↔ Tenant lean methodology
- Overall (STATE)
- 87 Strongly Landlord-Friendly
- State Tennessee
- 87 Strongly Landlord-Friendly · R+13
- County
- — inherits STATE
- City
- — inherits STATE
ZIP-level market 37075
- Rents YoY
- 0.9%
- Active inventory
- 677
- Price-to-rent
- 12.2×
Monthly cashflow live
- Estimated rent
- $1,941 high interval (Pro) →
- Mortgage (P&I)
- −$1,495
- Tax from tax record
- −$85 /mo · $1,017/yr
- Insurance
- −$119
- Flood insurance flood zone
- −$56 /mo · $666/yr
- HOA
- −$0
- Vacancy / Maint / Mgmt
- −$408
- Net cashflow
- $-220
Break-even live
Sensitivity live
| Price | -10% $-59 | -5% $-139 | +0% $-220 | +5% $-301 | +10% $-381 |
|---|---|---|---|---|---|
| Rent | -10% $-373 | -5% $-297 | +0% $-220 | +5% $-143 | +10% $-67 |
| Rate | -1.0pp $-77 | -0.5pp $-148 | base $-220 | +0.5pp $-294 | +1.0pp $-369 |
UW: 25.0% down · 7.5% · 30yr · 1.5% tax · 5.0% vac · 8.0% maint · 8.0% mgmt
Financing live
Cash to close
- Down payment
- $71,250
- Closing costs
- $8,550
- Reserves months
- —
- Total cash needed
- —
Loan-product check · same deal, 3 products live
Conventional
25% down · 7.5% · 30yr
- Down + closing
- —
- Monthly P&I
- —
- Monthly cashflow
- —
- DSCR
- —
- Eligible?
- —
Personal DTI + credit; lowest rate.
DSCR
20% down · 8.5% · 30yr
- Down + closing
- —
- Monthly P&I
- —
- Monthly cashflow
- —
- DSCR
- —
- Eligible?
- —
No personal income docs; deal must DSCR.
Hard money
10% down · 12.0% · 12mo
- Down + closing
- —
- Monthly P&I
- —
- Monthly cashflow
- —
- DSCR
- —
- Eligible?
- —
Short-term bridge; refi at stabilization.
Rent comps 12 comps
| Address | Beds | Baths | Sqft | Rent | $/sqft | DOM | Units | Dist |
|---|---|---|---|---|---|---|---|---|
| 103 Ridgecrest Dr Unit B Hendersonville, TN | 2.0 | 1.0 | 950 | $1,195 | $1.26 | 5d | 1 | 0.27mi |
| 152 Two Valley Rd Hendersonville, TN | 4.0 | 2.5 | 1575 | $2,405 | $1.53 | 24d | 1 | 0.28mi |
| 209 Township Dr Hendersonville, TN | 3.0 | 2.0 | 1560 | $2,065 | $1.32 | 44d | 1 | 0.90mi |
| 1070 W Main St Hendersonville, TN | 1.0–3.0 | 1.0–2.0 | 907 | $1,784 | $1.97 | 2d | 26 | 0.96mi |
| 126 Monthaven Blvd Hendersonville, TN | 1.0–3.0 | 1.0–2.0 | 972 | $1,973 | $2.03 | 2d | 35 | 1.02mi |
| 164 Hillside Dr Hendersonville, TN | 3.0 | 1.5 | 1053 | $1,975 | $1.88 | 21d | 1 | 1.04mi |
| 108 Ryan Dr Hendersonville, TN | 3.0 | 1.5 | 1218 | $1,990 | $1.63 | 15d | 1 | 1.05mi |
| 1080 W Main St Hendersonville, TN | 1.0–2.0 | 1.0–2.0 | 985 | $1,626 | $1.65 | 2d | 26 | 1.06mi |
| 120 Nearwater Pl Hendersonville, TN | 2.0 | 2.5 | 1538 | $1,995 | $1.30 | 8d | 1 | 1.13mi |
| 109 Shady View Dr Hendersonville, TN | 3.0 | 2.0 | 1161 | $1,700 | $1.46 | 24d | 1 | 1.24mi |
| 108 Crestmont Dr Hendersonville, TN | 3.0 | 2.0 | 1850 | $2,495 | $1.35 | 44d | 1 | 1.39mi |
| 231 New Shackle Island Rd Hendersonville, TN | 1.0–2.0 | 1.0–1.5 | 830 | $1,639 | $1.97 | 5d | 6 | 1.47mi |
Listing history 15 events
-
2026-06-18days on market $285,000 Active 68 DOM
-
2026-06-17days on market $285,000 Active 67 DOM
-
2026-06-16days on market $285,000 Active 66 DOM
-
2026-06-15days on market $285,000 Active 65 DOM
-
2026-06-13days on market $285,000 Active 63 DOM
-
2026-06-13days on market $285,000 Active 62 DOM
-
2026-06-09days on market $285,000 Active 59 DOM
-
2026-06-08days on market $285,000 Active 58 DOM
-
2026-06-07days on market $285,000 Active 57 DOM
-
2026-06-05days on market $285,000 Active 54 DOM
-
2026-06-03days on market $285,000 Active 53 DOM
-
2026-06-02days on market $285,000 Active 52 DOM
-
2026-06-01days on market $285,000 Active 51 DOM
-
2026-05-31days on market $285,000 Active 50 DOM
-
2026-04-11$285,000 Active 212-char remark
Show marketing remark (212 chars)
All brick one-level home with beautiful level backyard sitting on little over 1/2 acre. Newer roof with endless possibilities. Great home for first time homebuyer or investor. .Home being sold in AS IS Condition.
ⓘ Source: listings_history table (triggers on properties + properties_extension) + one-shot
backfill from property_details.listing_events for pre-trigger history.
Tax reassessment forecast TN · Resets to sale price
- Current annual tax
- $1,017 · $85/mo
- Projected year-2 tax
- $2,024 · $169/mo
- Expected delta
- +$1,007/yr (+$84/mo · 99.0%)
ⓘ Screening estimate from a state-policy table — verify with the county assessor before closing.
Climate risk First Street
- Flood 7/10 Severe FEMA zone X (unshaded) · 77% chance over 30 yrs
- Wildfire 3/10 Moderate
- Heat 6/10 Major 7 d/yr ≥105°F today · 20 d/yr by 30 yrs out
- Wind 4/10 Moderate 8% chance of damaging wind over 30 yrs
- Air quality 2/10 Low 1 unhealthy d/yr today · 3 by 30 yrs out
Nearby sold comps map
Loading sold comps map…
Walkable amenities ~0.75 mi
Loading nearby amenities…
Taxation est. · year 1
- Rental income
- $23,294
- − Mortgage interest
- −$15,964
- − Property taxes
- −$1,017
- − Insurance
- −$2,092
- − Repairs & maintenance
- −$1,863
- − Management
- −$1,863
- − Depreciation
- −$8,291
- Taxable loss
- −$7,797
- Est. tax savings @ 24.0%
- +$1,871
- After-tax cash flow
- $-770/yr
For passive investors: Depreciation is non-cash, so a rental often shows a tax loss while cash-flowing — sheltering income. Rental losses are passive: they offset passive income freely, and up to $25,000/yr can offset ordinary (W-2) income if you actively participate and your MAGI is under $100k (phasing out to $0 by $150k); unused losses carry forward. On sale, claimed depreciation is recaptured at up to 25%, and gains may owe capital-gains tax (a 1031 exchange can defer both). Figures are a year-1 estimate at your 24.0% rate — not tax advice; consult a CPA.
Schools (NCES district)
- District
- Sumner County
- NCES district ID
- 4704020
- Math proficiency
- 44% ▼ -11.00%
- Reading proficiency
- 39% ▼ -5.00%
- Median HH income
- $56,998
- Composite
- 36.44/100
- National rank
- #4667
- State rank
- #12 of 139 in TN
Livability — Hendersonville
- Score
- 70/100
- State rank
- #56
- US rank
- #7730
Category grades
Schools grade is shown separately in the Schools card above.
Census & demographics
- County
- Sumner County · 196,654 people
- City population
- 73,522
- Metro
- Nashville-Davidson--Murfreesboro--Franklin, TN
- Population (ZIP)
- 73,522
- Household income
- $101,850
- Rent vs Own
- Severe rent burden
- 1258.0
Population outlook (Sumner County) Hauer SSP2
- Today (2025)
- 208,284 people
- By 2030
- 223,902 · +7.5%
- By 2040
- 253,892 · +21.9%
- By 2050
- 281,199 · +35.0%
- By 2075
- 344,866 · +65.6%
- By 2100
- 384,369 · +84.5%
Race, ethnicity, and origin ACS 2023
- Neighborhood character
- Predominantly White (82%)
- Race & ethnicity
- White 82% Black 8% Hispanic / Latino 6% Two or more races 5% Asian 2%
- Hispanic origin (detail)
- Mexican 2%
- Common ancestry
- Italian 4% Slovak 3% Serbian 2%
- Foreign-born
- 5% · Canada, China
- Languages at home
- 93% English-only · Spanish 4% Other Indo-European 1%
Political lean MEDSL · Sumner
- 2024 margin
- Solid R (+41.8) · D 28.5% · R 70.3% · Other 1.1%
- 2008→2024 swing
- -6.9pp toward R · 2008: -34.9pp · 2024: -41.8pp
- All cycles
- 2024: R+41.8 2020: R+38.6 2016: R+45.0 2012: R+42.0 2008: R+34.9
Not yet ingested
- Civics
- —
Market trends
- HPI YoY
- ▼ -251.80%
- Current HPI
- 289.6615
- Rent YoY
- ▲ 0.95%
- Metro
- Nashville-Davidson--Murfreesboro--Franklin, TN
- State GDP YoY
- ▲ 2.78%
- F500 in state
- 22
Industry mix (Fortune 500 HQ in TN)
| Industry | F500 HQs | Revenue |
|---|---|---|
| Healthcare | 3 | $91B |
|
||
| Retail | 3 | $72B |
|
||
| Transportation / Logistics | 1 | $88B |
|
||
| Paper / Packaging | 1 | $19B |
|
||
| Insurance | 1 | $13B |
|
||
| Energy | 1 | $12B |
|
||
Price history
1 event — show timeline
- 2026-04-11 Listed $285,000 REALTRACS as Distributed by MLS Grid
Property tax history
+6.2%/yrLatest (2025): $1,017 · +0.0% YoY. Source: county tax records.
Cash-flow waterfall
monthlySold comps — $/sqft
last 12 mo · ≤1 miLoading sold comps…