123 N 31 Ave · Omaha, NE
Flood risk 1/10 · Minimal
- FEMA flood zone
- X (unshaded)
- Chance of flooding over 30 yrs
- 0.0%
- Est. flood insurance / yr
- $473 – $860
Fire risk 1/10 · Minimal
- Est. fire insurance / yr
- $1,161 – $2,155
Heat risk 3/10 · Minor
- Hot days now (above 103°F)
- 7 days/yr
- Hot days in 30 yrs
- 15 days/yr
Wind risk 2/10 · Minimal
- Chance of severe wind over 30 yrs
- —
Air-quality risk 2/10 · Minimal
- Unhealthy air days now
- 0 days/yr
- Unhealthy air days in 30 yrs
- 1 days/yr
Risk factors via First Street. Map © Google.
Why this score? — see what drove the D grade
The composite is a weighted blend of 9 inputs, each scored 0–100. Each bar is that input's sub-score; the figure is the points it added to the 100-point composite (weight × sub-score).
- Cash flow +13.8/30.0
- ARV discount +6.4/15.0
- DSCR +4.2/10.0
- Livability +4.2/5.0
- 1% rule +4.0/10.0
- Rent growth +3.5/5.0
- Condition / age +2.5/5.0
- Schools +2.1/10.0
- Appreciation +0.0/10.0
$220,000
🖨 Deal sheet 📄 Offer letter ✓ Due diligence
Listing remarks
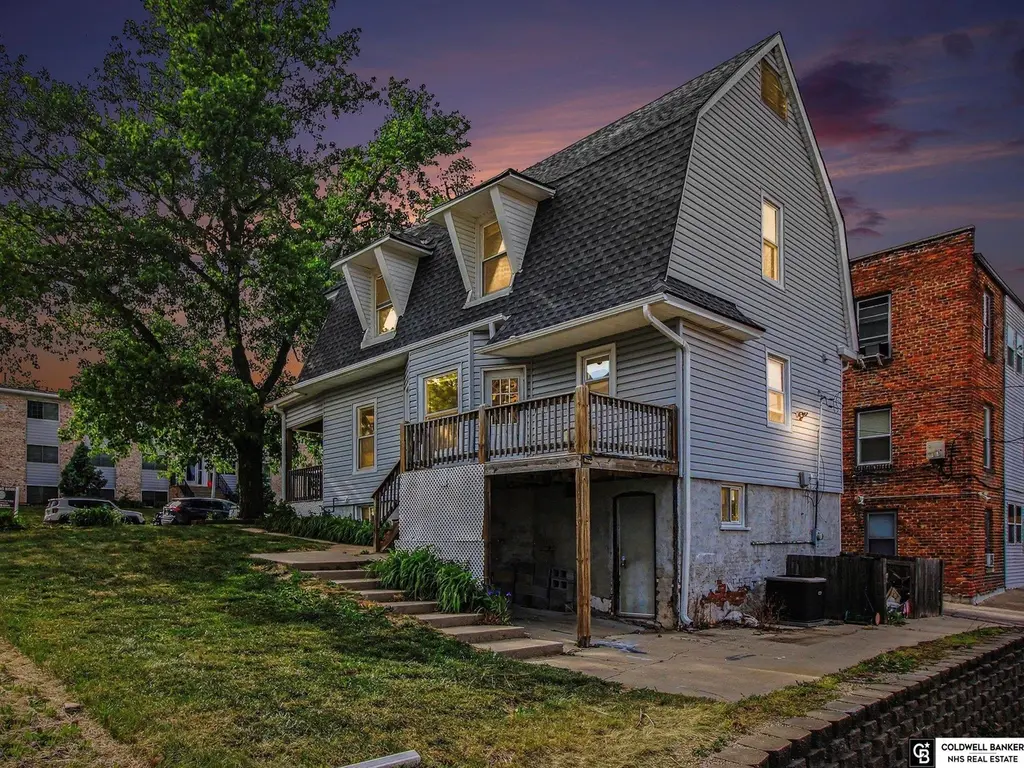
Welcome to this charming 4 bedroom, 3 bathroom 2-story home perfectly located near Joslyn Castle, Joslyn Art Museum, Gifford Park, and Midtown Crossing, with a quick drive to downtown—and even downtown views from the deck! This home is full of character, from the inviting front porch perfect for slow mornings to the beautiful main living area featuring unique arched doorways and plenty of charm. Upstairs, you’ll find all four bedrooms and a full bathroom, creating a private and comfortable retreat away from the main living spaces. The basement offers flexible space ready for your personal touches, along with a ¾ bathroom and laundry room. Outside, enjoy the deck off the m
Key facts
- Flexible space
- Inviting front porch
- Corner lot
Tags
Property features AI
Exterior
- Parking: No garage
- Utilities: Public water; Public sewer
- Home design: Single-family residence; Two levels; Not new / not a model
- Construction: Built in 1905; Block foundation
- Exterior features: Front porch; Deck; Lot about 0.16 acre (approximately 50 x 143.5)
Interior
- Bedrooms: Master bedroom on 2nd floor; Additional bedrooms on 2nd floor
- Bathrooms: Three total bathrooms: one full, one three-quarter, one half; Main level has a bathroom; below grade has a bathroom
- Heating & cooling: Natural gas forced-air heating; Central air conditioning
- Interior features: Daylight, partial walk-out basement; No fireplaces
Neighborhood map
What this means for you Summary
Snapshot
- This is a 4-bed/2.0-bath other listed at $220k.
Deal economics
- At list price, monthly cash flow is $22 ($264/yr) — positive.
- The deal already cash-flows at list — no discount required.
- To meet the 1% rule (rent ≥ 1% of price), the offer needs to be $199k (9.6% below list).
- Recommended offer: $199k (9.6% below list) — sets the bar for 1% rule.
- Cap rate 6.4% vs local median 3.6% in Omaha — top-decile yield for the area; either an underpriced asset or a hidden risk that comps aren't pricing in. Stress-test before assuming the spread holds.
Location & tenants
- Location reads 84/100 on livability (#7 in NE, #663 nationally) — a professional / high-income tenant draw. Strengths: amenities A+, commute A+, cost of living A+; Watch: crime F.
- Omaha Public Schools (urban): math 20% / reading 28% proficiency, ranked #110 of 111 in NE (top 99%) — low school quality limits family demand, transient renter base, plan for 1-2y turnover; 62% free/reduced lunch — lower-income household profile, screen leases tightly.
- Zoned schools: Gifford Park Elementary School (math 22% / reading 27%, grade F, #445 of 502 statewide, top 91%, 363 students, 0% FRL); Lewis & Clark Middle School (math 23% / reading 35%, grade F, #115 of 128 statewide, top 90%, 860 students, 0% FRL); Central High School (math 29% / reading 40%, grade F, #208 of 261 statewide, top 86%, 2,738 students, 0% FRL) — zoned schools average 0% FRL vs 62% district-wide (62 pts lower); this property's tenant base skews higher-income than the district average.
- Market conditions: Rents rising (+3.8%/yr); 63 active listings in the ZIP; 32 comparable units currently listed for rent nearby; rentals at typical pace (median 15d on market — plan ~3-4 weeks tenant-placement turnaround); 4,539 units permitted in Douglas County in 2024 (2,583 in 5+ unit buildings).
- At $1,989/mo this rent would consume 49% of the median local household income ($49k/yr) (locally 1468% of renters already pay >50% of income on rent) — very limited rent-growth headroom before tenants either downsize or default.
Forward outlook
- Local home prices are declining (-3.0%/yr); year-one equity from $2k of loan paydown is wiped out by about $7k of value loss. Plan a longer hold.
- Douglas County population projected at +28% by 2050 — long-run rental-demand tailwind backs the buy-and-hold thesis.
Negotiation context
- It's been on market 25 days — a 2% lower offer ($217k) is reasonable based on typical stale-listing flexibility.
Risks & watch-outs
- Watch-outs: built in 1905 — expect roof / HVAC / electrical / plumbing capex.
Questions for the listing agent
- Built in 1905 — when were the roof, HVAC, electrical panel, plumbing, and water heater last replaced?
- Is there a deadline driving the sale (1031 exchange, divorce, estate, relocation)? That informs how much negotiation room exists.
- Crime grade is F in this area — have there been break-ins, vandalism, or insurance claims at this property in the last 3 years? What carrier currently insures it and at what premium?
- The area grade is low — what's the realistic commute time and amenity access for the typical tenant pool here? Any planned neighborhood developments (good or bad) we should know about?
- What's the average days-on-market for RENTAL listings here right now (not sales)? A rising rental-DOM trend means longer vacancies and softer asking-rent achievability than the comps imply.
- What's the recent tenant-quality profile in this submarket — average credit score on applications, eviction rate, late-payment / NSF rate, and stable-employment percentage? A property-management company in the area should have these aggregated.
- How much new for-sale + rental construction is in the pipeline within 1–3 miles? Heavy new supply typically softens prices + rents 12–24 months out; constrained supply supports both.
Investment metrics
- 1% rule
- 0.90% ✗
- Cap rate
- 6.41%
- Cash-on-cash
- 0.43%
- DSCR
- 1.02
- GRM
- 9.2
CMA / ARV
- ARV (median comp)
- $214,687
- List price
- $220,000
- Delta
- 2.47%
- Verdict
- FAIR
- Comps
- 20 within 1.0 mi
Projected returns pro-forma
-3.0% appreciation · 3.82% rent growth · sell at horizon
- IRR
- -14.7%
- Equity multiple
- 0.47×
- Total profit
- $-32,543
- Equity at exit
- $32,803
- IRR
- -4.6%
- Equity multiple
- 0.68×
- Total profit
- $-19,432
- Equity at exit
- $19,022
Cash invested: $61,600 (down + closing). Projections, not guarantees.
Landlord ↔ Tenant lean methodology
- Overall (STATE)
- 83 Strongly Landlord-Friendly
- State Nebraska
- 83 Strongly Landlord-Friendly · R+13
- County
- — inherits STATE
- City
- — inherits STATE
ZIP-level market 68131
- Home prices YoY
- -26.3%
- Rents YoY
- 3.8%
- Active inventory
- 63
- Price-to-rent
- 9.2×
Monthly cashflow live
- Estimated rent
- $1,989 high interval (Pro) →
- Mortgage (P&I)
- −$1,154
- Tax from tax record
- −$304 /mo · $3,650/yr
- Insurance
- −$92
- HOA
- −$0
- Vacancy / Maint / Mgmt
- −$418
- Net cashflow
- $22
Break-even live
UW: 25.0% down · 7.5% · 30yr · 1.5% tax · 5.0% vac · 8.0% maint · 8.0% mgmt
Financing live
Cash to close
- Down payment
- $55,000
- Closing costs
- $6,600
- Reserves months
- —
- Total cash needed
- —
Loan-product check · same deal, 3 products live
Conventional
25% down · 7.5% · 30yr
- Down + closing
- —
- Monthly P&I
- —
- Monthly cashflow
- —
- DSCR
- —
- Eligible?
- —
Personal DTI + credit; lowest rate.
DSCR
20% down · 8.5% · 30yr
- Down + closing
- —
- Monthly P&I
- —
- Monthly cashflow
- —
- DSCR
- —
- Eligible?
- —
No personal income docs; deal must DSCR.
Hard money
10% down · 12.0% · 12mo
- Down + closing
- —
- Monthly P&I
- —
- Monthly cashflow
- —
- DSCR
- —
- Eligible?
- —
Short-term bridge; refi at stabilization.
Rent comps 32 comps
| Address | Beds | Baths | Sqft | Rent | $/sqft | DOM | Units | Dist |
|---|---|---|---|---|---|---|---|---|
| 3001 Harney St Omaha, NE | 3.0 | 3.0 | 1764 | $2,395 | $1.36 | 44d | 1 | 0.34mi |
| 2929 California St Omaha, NE | 1.0–4.0 | 1.0–3.0 | 1280 | $3,340 | $2.61 | 3d | 118 | 0.34mi |
| 132 N 35th Ave Omaha, NE | 5.0 | 2.0 | 1959 | $2,550 | $1.30 | 44d | 1 | 0.35mi |
| 106 S 36th St Omaha, NE | 3.0 | 3.0 | 1750 | $2,275 | $1.30 | 3d | 1 | 0.42mi |
| 542 S 29th St Omaha, NE | 3.0 | 1.5 | 1442 | $1,750 | $1.21 | 14d | 1 | 0.49mi |
| 303 N 38th St Omaha, NE | 4.0 | 1.5 | 1472 | $1,995 | $1.36 | 23d | 1 | 0.51mi |
| 2915 Jackson St Unit 2 Omaha, NE | 3.0 | 1.0 | 1100 | $1,195 | $1.09 | 3d | 1 | 0.52mi |
| 110 N 38th St Unit 110 Omaha, NE | 3.0 | 2.0 | 1600 | $1,750 | $1.09 | 23d | 1 | 0.54mi |
| 528 S 26th Ave Ste B Omaha, NE | 4.0 | 1.0 | 1748 | $1,650 | $0.94 | 3d | 1 | 0.57mi |
| 554 S 26th Ave Omaha, NE | 3.0 | 1.0 | 1484 | $1,400 | $0.94 | 3d | 1 | 0.61mi |
| 806 Park Ave Omaha, NE | 3.0 | 3.0 | 1650 | $2,395 | $1.45 | 23d | 2 | 0.64mi |
| 411 S 38th Ave Omaha, NE | 3.0 | 3.0 | 1872 | $1,995 | $1.07 | 44d | 1 | 0.65mi |
| 424 S 24th St Unit 109 Omaha, NE | 4.0 | 2.0 | 1170 | $1,400 | $1.20 | 3d | 1 | 0.71mi |
| 3919 Farnam St Unit 3915 Farnam Omaha, NE | 4.0 | 2.0 | 1700 | $2,350 | $1.38 | 44d | 1 | 0.75mi |
| 120 N 40th St Omaha, NE | 3.0 | 1.0 | 1264 | $1,745 | $1.38 | 23d | 1 | 0.77mi |
| 1029 Park Ave Unit 3B Omaha, NE | 3.0 | 1.0 | 1112 | $1,295 | $1.16 | 44d | 1 | 0.79mi |
| 2211 Howard St Omaha, NE | 3.0 | 1.0–3.0 | 837 | $2,410 | $2.88 | 3d | 48 | 0.82mi |
| 140 N 41st St Omaha, NE | 3.0 | 2.5 | 1640 | $2,495 | $1.52 | 44d | 1 | 0.82mi |
| 206 S 19th St Omaha, NE | 1.0–3.0 | 1.0–3.0 | 918 | $1,935 | $2.11 | 3d | 60 | 0.92mi |
| 3430 Seward St Omaha, NE | 3.0 | 1.0 | 1371 | $1,695 | $1.24 | 14d | 1 | 0.93mi |
| 1012 S 24th St Omaha, NE | 1.0–3.0 | 1.0 | 918 | $1,150 | $1.25 | 3d | 5 | 0.96mi |
| 3314 Franklin St Omaha, NE | 4.0 | 2.0 | 1635 | $1,600 | $0.98 | 44d | 1 | 0.97mi |
| 4015 Marcy St Omaha, NE | 3.0 | 1.0 | 1238 | $1,695 | $1.37 | 14d | 1 | 1.04mi |
| 629 S 19th Ave Omaha, NE | 3.0 | 2.0 | 1364 | $1,350 | $0.99 | 44d | 1 | 1.06mi |
| 1120 N 20th St Unit 309 Omaha, NE | 4.0 | 2.0 | 1179 | $1,550 | $1.31 | 23d | 1 | 1.10mi |
| 1120 N 20th St Unit 102 Omaha, NE | 3.0 | 2.0 | 1094 | $580 | $0.53 | 14d | 1 | 1.11mi |
| 1120 N 20th St Unit 103 Omaha, NE | 3.0 | 2.0 | 1170 | $1,150 | $0.98 | 14d | 1 | 1.11mi |
| 4228 Mayberry St Omaha, NE | 4.0 | 1.0 | 1664 | $1,700 | $1.02 | 14d | 1 | 1.16mi |
| 4207 Barker Ave Omaha, NE | 3.0 | 1.0 | 1200 | $1,595 | $1.33 | 44d | 1 | 1.17mi |
| 4623 Douglas St Omaha, NE | 3.0 | 2.0 | 1510 | $1,750 | $1.16 | 21d | 1 | 1.30mi |
| 1015 N 14th St Omaha, NE | 1.0–3.0 | 1.0–3.0 | 910 | $1,855 | $2.04 | 2d | 17 | 1.43mi |
| 4806 Webster St Omaha, NE | 3.0 | 2.5 | 1589 | $2,295 | $1.44 | 3d | 1 | 1.46mi |
Listing history 11 events
-
2026-06-10status $220,000 Pending 25 DOM
-
2026-06-09days on market $220,000 Active 25 DOM
-
2026-06-08days on market $220,000 Active 24 DOM
-
2026-06-07days on market $220,000 Active 23 DOM
-
2026-06-03pricedays on market $220,000 Active 19 DOM
-
2026-06-03days on market $235,000 Active 18 DOM
-
2026-06-01days on market $235,000 Active 17 DOM
-
2026-06-01days on market $235,000 Active 16 DOM
-
2026-05-15$235,000 New 807-char remark
-
2020-09-22soldstatus $218,000
-
1994-08-15soldstatus $28,000
ⓘ Source: listings_history table (triggers on properties + properties_extension) + one-shot
backfill from property_details.listing_events for pre-trigger history.
Tax reassessment forecast NE · Resets to sale price
- Current annual tax
- $3,650 · $304/mo
- Projected year-2 tax
- $3,806 · $317/mo
- Expected delta
- +$156/yr (+$13/mo · 4.3%)
ⓘ Screening estimate from a state-policy table — verify with the county assessor before closing.
Climate risk First Street
- Flood 1/10 Low FEMA zone X (unshaded) · 0% chance over 30 yrs
- Wildfire 1/10 Low
- Heat 3/10 Moderate 7 d/yr ≥103°F today · 15 d/yr by 30 yrs out
- Wind 2/10 Low
- Air quality 2/10 Low 0 unhealthy d/yr today · 1 by 30 yrs out
Nearby sold comps map
Loading sold comps map…
Walkable amenities ~0.75 mi
Loading nearby amenities…
Taxation est. · year 1
- Rental income
- $23,872
- − Mortgage interest
- −$12,323
- − Property taxes
- −$3,650
- − Insurance
- −$1,100
- − Repairs & maintenance
- −$1,910
- − Management
- −$1,910
- − Depreciation
- −$6,400
- Taxable loss
- −$3,421
- Est. tax savings @ 24.0%
- +$821
- After-tax cash flow
- $1,085/yr
For passive investors: Depreciation is non-cash, so a rental often shows a tax loss while cash-flowing — sheltering income. Rental losses are passive: they offset passive income freely, and up to $25,000/yr can offset ordinary (W-2) income if you actively participate and your MAGI is under $100k (phasing out to $0 by $150k); unused losses carry forward. On sale, claimed depreciation is recaptured at up to 25%, and gains may owe capital-gains tax (a 1031 exchange can defer both). Figures are a year-1 estimate at your 24.0% rate — not tax advice; consult a CPA.
Schools (NCES district)
- District
- Omaha Public Schools
- NCES district ID
- 3174820
- Math proficiency
- 20% ▼ -10.00%
- Reading proficiency
- 28% ▼ -5.00%
- Median HH income
- $46,039
- Composite
- 20.83/100
- National rank
- #8502
- State rank
- #110 of 111 in NE
Livability — Omaha
- Score
- 84/100
- State rank
- #7
- US rank
- #663
Category grades
Schools grade is shown separately in the Schools card above.
Census & demographics
- Census place
- Omaha, NE
- County
- Douglas County · 538,646 people
- City population
- 552,986
- Metro
- Omaha-Council Bluffs, NE-IA
- Population (ZIP)
- 14,809
- Household income
- $48,925
- Rent vs Own
- Severe rent burden
- 1468.0
Population outlook (Douglas County) Hauer SSP2
- Today (2025)
- 625,245 people
- By 2030
- 661,613 · +5.8%
- By 2040
- 732,395 · +17.1%
- By 2050
- 801,988 · +28.3%
- By 2075
- 968,637 · +54.9%
- By 2100
- 1,101,871 · +76.2%
Race, ethnicity, and origin ACS 2023
- Neighborhood character
- Diverse neighborhood (Simpson 0.59)
- Race & ethnicity
- White 60% Black 20% Hispanic / Latino 10% Two or more races 7% Asian 6%
- Hispanic origin (detail)
- Mexican 5%
- Common ancestry
- Portuguese 3% Romanian 2% Slovak 2%
- Foreign-born
- 17% · Canada, China, South Korea
- Languages at home
- 81% English-only · Spanish 5% Other Indo-European 2% Arabic 1%
Political lean MEDSL · Douglas
- 2024 margin
- D (+10.2) · D 54.4% · R 44.2% · Other 1.4%
- 2008→2024 swing
- +5.5pp toward D · 2008: 4.6pp · 2024: 10.2pp
- All cycles
- 2024: D+10.2 2020: D+11.3 2016: D+1.4 2012: R+4.3 2008: D+4.6
Not yet ingested
- Civics
- —
Market trends
- HPI YoY
- ▼ -109.21%
- Current HPI
- 305.4972
- Rent YoY
- ▲ 3.82%
- Metro
- Omaha-Council Bluffs, NE-IA
- State GDP YoY
- ▲ 0.68%
- F500 in state
- 2
Industry mix (Fortune 500 HQ in NE)
| Industry | F500 HQs | Revenue |
|---|---|---|
| Conglomerate | 1 | $371B |
|
||
Price history
+685.7% since first listed5 events — show timeline
- 2026-06-09 Pending — GPRMLS
- 2026-06-03 Price Changed $220,000 GPRMLS
- 2026-05-15 Listed $235,000 GPRMLS
- 2020-09-22 Sold (Public Records) $218,000 Public Records
- 1994-08-15 Sold (Public Records) $28,000 Public Records
Property tax history
+4.9%/yrLatest (2025): $3,650 · -0.3% YoY. Source: county tax records.
Cash-flow waterfall
monthlySold comps — $/sqft
last 12 mo · ≤1 miLoading sold comps…