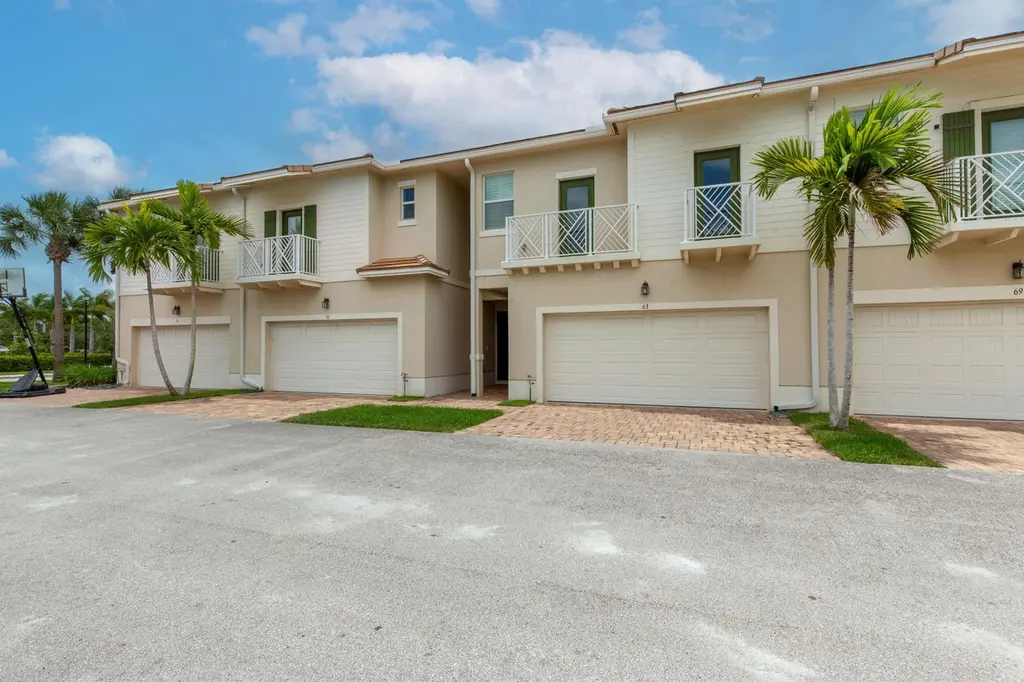
63 Dogwood Ct · Royal Palm Beach, FL
Flood risk 1/10 · Minimal
- FEMA flood zone
- X (unshaded)
- Chance of flooding over 30 yrs
- 0.0%
- Est. flood insurance / yr
- $507 – $1,088
Fire risk 1/10 · Minimal
- Est. fire insurance / yr
- $947 – $1,759
Heat risk 10/10 · Severe
- Hot days now (above 107°F)
- 7 days/yr
- Hot days in 30 yrs
- 25 days/yr
Wind risk 10/10 · Severe
- Chance of severe wind over 30 yrs
- 99.0%
Air-quality risk 2/10 · Minimal
- Unhealthy air days now
- 0 days/yr
- Unhealthy air days in 30 yrs
- 1 days/yr
Risk factors via First Street. Map © Google.
Why this score? — see what drove the D- grade
The composite is a weighted blend of 9 inputs, each scored 0–100. Each bar is that input's sub-score; the figure is the points it added to the 100-point composite (weight × sub-score).
- Appreciation +10.0/10.0
- ARV discount +7.5/15.0
- Cash flow +5.3/30.0
- Schools +4.3/10.0
- Livability +4.0/5.0
- Rent growth +2.7/5.0
- Condition / age +2.5/5.0
- 1% rule +1.9/10.0
- DSCR +0.0/10.0
$515,000
🖨 Deal sheet 📄 Offer letter ✓ Due diligence
Listing remarks MLS
Perfectly located 3 Bed/2.5 Bath plus LOFT! This bright and airy home gets tons of Natural Light and features over 2,200 sq ft with over $40K in upgrades including... Modern Gourmet Kitchen with Quartz Countertops, Double Ovens, SS Appliances, Glass Cooktop Stove, and Pendant Lighting Pre-wire! Impact Glass! 24-inch Tiles! 24-ft wide Patio! Recessed Lighting! Master Bath with Separate Shower and Tub! Two Balconies! Upstairs Laundry Room! Community Features: Two Playgrounds, Clubhouse with Fitness Room, Party Room, and a Pool! Tree-lined Walking Paths! Close to Restaurants, Parks, and the Wellington Mall! Just a 20-minute drive to the Beach!
Key facts
- $361 HOA
- 2 garage spots
- Community pool
Property features AI
Finance
- Financial info: Pets allowed (restrictions possible)
- HOA & community: Community amenities include fitness center, pool, playground, park, community room, sidewalks, and street lights; Internet included in association; Association handles grounds maintenance, common real estate tax, legal/accounting, and reserve funds; HOA fee paid monthly
Exterior
- Parking: Attached 2-car garage; 2 covered parking spaces (garage); Additional driveway and guest/open parking (total 4 spaces)
- Security: Security system; Smoke detectors
- Utilities: Public water; Public sewer; Electricity connected
- Home design: Townhouse; Two levels; Faces east; Resale property
- Construction: Stucco and CBS construction; Tile roof; Built on a single-story building footprint with two levels; Building area reported from public records
- Exterior features: Covered and open patios; Open porch; Back yard fencing with gate and privacy; Fenced yard
Interior
- Kitchen: Dishwasher; Electric range; Electric cooktop; Microwave; Refrigerator; Garbage disposal; Electric water heater
- Bedrooms: No main-level bedrooms noted
- Flooring: Carpet; Tile
- Bathrooms: 2 full bathrooms; 1 half bathroom
- Heating & cooling: Central heating (electric); Central air (electric); Ceiling fans
- Interior features: High ceilings; Kitchen island; Walk-in closets; Roman tub; Upstairs living area; French doors; Drapes and plantation shutters; Storm windows; Furnished
- Laundry & utility: Inside laundry room on upper level; Washer hookup; Laundry sink
Neighborhood map
What this means for you Summary
Snapshot
- This is a 3-bed/2.5-bath townhouse listed at $515k.
Deal economics
- At list price, monthly cash flow is $-1k ($-14k/yr) — negative.
- To cash-flow at today's rent, offer at most $314k (39.1% below list).
- To meet the 1% rule (rent ≥ 1% of price), the offer needs to be $354k (31.2% below list).
- Recommended offer: $314k (39.1% below list) — sets the bar for cash-flow.
Location & tenants
- Location reads 79/100 on livability (#135 in FL, #2,039 nationally) — a middle-class / working-renter tenant base. Strengths: employment A+, housing A+, health & safety A+; Watch: cost of living C-, amenities F, commute F.
- Palm Beach (suburban): math 46% / reading 53% proficiency, ranked #34 of 73 in FL (top 47%) — families likely to look elsewhere, expect single-tenant / working-renter base with shorter leases.
- Zoned schools: Cypress Trails Elementary School (math 52% / reading 62%, grade C+, #781 of 2,144 statewide, top 38%, 492 students, 53% FRL); Crestwood Community Middle (math 49% / reading 52%, grade C, #246 of 571 statewide, top 44%, 724 students, 50% FRL); Royal Palm Beach High School (math 22% / reading 38%, grade F, #441 of 667 statewide, top 67%, 2,343 students, 57% FRL) — zoned schools at 54% FRL track the district average.
- Market conditions: Rents flat; 574 active listings in the ZIP; 40 comparable units currently listed for rent nearby; rentals at typical pace (median 24d on market — plan ~3-4 weeks tenant-placement turnaround); solid renter incomes; 3,974 units permitted in Palm Beach County in 2024 (1,012 in 5+ unit buildings).
- At $3,545/mo this rent would consume 46% of the median local household income ($93k/yr) (locally 1870% of renters already pay >50% of income on rent) — very limited rent-growth headroom before tenants either downsize or default.
Forward outlook
- In year one you build about $55k of equity ($4k loan paydown + $52k appreciation (10.0% local appreciation)).
- Palm Beach County population projected at +30% by 2050 — long-run rental-demand tailwind backs the buy-and-hold thesis.
- By year 2, paydown + projected appreciation supports a ~$89k cash-out refi (75% LTV) — recoverable capital for the next deal without selling this one.
Negotiation context
- Only 9 days on market — expect competitive offers; lowballing is unlikely to land.
- 9 sale attempts since 8y ago with the ask held roughly flat each time — persistent listings suggest the price (not the market) is what's stuck; bring a comps-based counter.
Risks & watch-outs
- Climate carrying-cost: severe wind risk, 99% chance of damaging wind over 30y; extreme-heat days projected 7→25/yr by 2055 (HVAC capex compounding) — expect insurance premiums to compound above CPI over the hold.
Questions for the listing agent
- What do current leases actually rent for vs. the listed asking? Can we see a recent rent roll and the last 12 months of T-12 income?
- What does the HOA fee cover, when was the last increase, and are there any pending special assessments or reserve-fund shortfalls?
- Is there a deadline driving the sale (1031 exchange, divorce, estate, relocation)? That informs how much negotiation room exists.
- Schools are B-rated — typically a magnet for longer-tenancy family renters. What's the average tenant stay here, and is there a school-zone premium baked into asking?
- The area grade is low — what's the realistic commute time and amenity access for the typical tenant pool here? Any planned neighborhood developments (good or bad) we should know about?
- What's the average days-on-market for RENTAL listings here right now (not sales)? A rising rental-DOM trend means longer vacancies and softer asking-rent achievability than the comps imply.
- What's the recent tenant-quality profile in this submarket — average credit score on applications, eviction rate, late-payment / NSF rate, and stable-employment percentage? A property-management company in the area should have these aggregated.
- How much new for-sale + rental construction is in the pipeline within 1–3 miles? Heavy new supply typically softens prices + rents 12–24 months out; constrained supply supports both.
Investment metrics
- 1% rule
- 0.69% ✗
- Cap rate
- 3.64%
- Cash-on-cash
- -9.48%
- DSCR
- 0.58
- GRM
- 12.1
CMA / ARV
No comps found within radius.
Projected returns pro-forma
10.0% appreciation · 0.85% rent growth · sell at horizon
- IRR
- 17.1%
- Equity multiple
- 2.39×
- Total profit
- $200,736
- Equity at exit
- $463,953
- IRR
- 15.8%
- Equity multiple
- 5.40×
- Total profit
- $634,804
- Equity at exit
- $1,000,532
Cash invested: $144,200 (down + closing). Projections, not guarantees.
Landlord ↔ Tenant lean methodology
- Overall (STATE)
- 87 Strongly Landlord-Friendly
- State Florida
- 87 Strongly Landlord-Friendly · R+3
- County
- — inherits STATE
- City
- — inherits STATE
ZIP-level market 33411
- Home prices YoY
- 1.9%
- Rents YoY
- 0.8%
- Active inventory
- 574
- Price-to-rent
- 12.1×
Monthly cashflow live
- Estimated rent
- $3,545 high interval (Pro) →
- Mortgage (P&I)
- −$2,701
- Tax from tax record
- −$663 /mo · $7,952/yr
- Insurance
- −$215
- HOA
- −$361
- Vacancy / Maint / Mgmt
- −$744
- Net cashflow
- $-1,139
Break-even live
UW: 25.0% down · 7.5% · 30yr · 1.5% tax · 5.0% vac · 8.0% maint · 8.0% mgmt
Financing live
Cash to close
- Down payment
- $128,750
- Closing costs
- $15,450
- Reserves months
- —
- Total cash needed
- —
Loan-product check · same deal, 3 products live
Conventional
25% down · 7.5% · 30yr
- Down + closing
- —
- Monthly P&I
- —
- Monthly cashflow
- —
- DSCR
- —
- Eligible?
- —
Personal DTI + credit; lowest rate.
DSCR
20% down · 8.5% · 30yr
- Down + closing
- —
- Monthly P&I
- —
- Monthly cashflow
- —
- DSCR
- —
- Eligible?
- —
No personal income docs; deal must DSCR.
Hard money
10% down · 12.0% · 12mo
- Down + closing
- —
- Monthly P&I
- —
- Monthly cashflow
- —
- DSCR
- —
- Eligible?
- —
Short-term bridge; refi at stabilization.
Rent comps 40 comps
| Address | Beds | Baths | Sqft | Rent | $/sqft | DOM | Units | Dist |
|---|---|---|---|---|---|---|---|---|
| 63 Dogwood Ct Royal Palm Beach, FL | 3.0 | 2.5 | 2222 | $3,500 | $1.58 | 16d | 1 | 0.02mi |
| 63 Dogwood Ct Royal Palm Beach, FL | 3.0 | 2.5 | 2222 | $3,500 | $1.58 | 18d | 1 | 0.02mi |
| 94 Palm Ln Royal Palm Beach, FL | 3.0 | 2.5 | 2222 | $3,200 | $1.44 | 24d | 1 | 0.18mi |
| 1400 Crestwood Ct S #1402 Royal Palm Beach, FL | 4.0 | 2.0 | 1459 | $3,000 | $2.06 | 24d | 1 | 0.29mi |
| 106 Fernwood Cres Royal Palm Beach, FL | 4.0 | 2.0 | 2088 | $3,500 | $1.68 | 14d | 1 | 0.37mi |
| 133 Black Olive Cres Royal Palm Beach, FL | 3.0 | 2.0 | 1752 | $4,500 | $2.57 | 24d | 1 | 0.54mi |
| 908 Hibiscus Dr Royal Palm Beach, FL | 3.0 | 2.0 | 1973 | $3,600 | $1.82 | 2d | 1 | 0.67mi |
| 220 Crestwood Cir #106 Royal Palm Beach, FL | 3.0 | 2.0 | 1520 | $2,650 | $1.74 | 24d | 1 | 0.68mi |
| 280 Sulky Way Wellington, FL | 4.0 | 2.0 | 2278 | $4,500 | $1.98 | 17d | 1 | 0.71mi |
| 876 Gardenia Dr Royal Palm Beach, FL | 2.0 | 2.0 | 1502 | $3,500 | $2.33 | 24d | 1 | 0.79mi |
| 12101 Tumbleweed Ct Wellington, FL | 3.0 | 2.5 | 2636 | $11,000 | $4.17 | 24d | 1 | 0.80mi |
| 849 Camellia Dr Royal Palm Beach, FL | 3.0 | 2.0 | 1599 | $3,400 | $2.13 | 24d | 1 | 0.83mi |
| 12351 Gingerwood Ln Wellington, FL | 4.0 | 2.0 | 2053 | $3,600 | $1.75 | 7d | 1 | 0.86mi |
| 12351 Gingerwood Ln Wellington, FL | 4.0 | 2.0 | 2053 | $3,856 | $1.88 | 24d | 1 | 0.86mi |
| 12280 Gingerwood Ln Wellington, FL | 3.0 | 2.0 | 1601 | $3,150 | $1.97 | 14d | 1 | 0.87mi |
| 180 Seminole Lakes Dr Royal Palm Beach, FL | 3.0 | 2.0 | 1856 | $3,500 | $1.89 | 24d | 1 | 0.91mi |
| 12192 Branding Iron Ct Wellington, FL | 3.0 | 2.5 | 2293 | $7,500 | $3.27 | 14d | 1 | 0.93mi |
| 113 Sandpiper Ave Royal Palm Beach, FL | 3.0 | 2.0 | 1798 | $3,500 | $1.95 | 11d | 1 | 0.94mi |
| 7u60 Windtree Way Wellington, FL | 3.0 | 2.5 | 2395 | $8,500 | $3.55 | 24d | 1 | 0.97mi |
| 502 Rambling Drive Cir Unit 1 Wellington, FL | 3.0 | 1.0 | 2600 | $3,600 | $1.38 | 24d | 1 | 0.97mi |
| 502 Rambling Drive Cir Unit 2 Wellington, FL | 2.0 | 1.0 | 1413 | $2,400 | $1.70 | 24d | 1 | 0.97mi |
| 148 Scarborough Ter Wellington, FL | 3.0 | 2.5 | 2376 | $10,000 | $4.21 | 24d | 1 | 1.00mi |
| 661 Lake Wellington Dr Wellington, FL | 3.0 | 2.0 | 1408 | $5,000 | $3.55 | 24d | 1 | 1.08mi |
| 690 Via Toscana Wellington, FL | 3.0 | 2.0 | 1432 | $3,200 | $2.23 | 24d | 1 | 1.11mi |
| 12497 Guilford Way Wellington, FL | 3.0 | 2.0 | 1437 | $4,500 | $3.13 | 24d | 1 | 1.13mi |
| 213 River Bluff Ln Royal Palm Beach, FL | 3.0 | 2.5 | 1579 | $2,800 | $1.77 | 24d | 1 | 1.16mi |
| 112 Wakulla Springs Way #112 Royal Palm Beach, FL | 2.0 | 2.5 | 1623 | $4,000 | $2.46 | 24d | 1 | 1.22mi |
| 100 Sparrow Dr #2 Royal Palm Beach, FL | 3.0 | 2.0 | 1824 | $2,725 | $1.49 | 18d | 1 | 1.25mi |
| 460 Rainbow Springs Ter Royal Palm Beach, FL | 3.0 | 2.5 | 1579 | $2,950 | $1.87 | 24d | 1 | 1.27mi |
| 1112 White Pine Dr Unit 1116 Wellington, FL | 3.0 | 2.5 | 1483 | $3,250 | $2.19 | 24d | 1 | 1.27mi |
| 13122 Via Veneto Wellington, FL | 3.0 | 3.0 | 1729 | $3,500 | $2.02 | 24d | 1 | 1.28mi |
| 274 River Bluff Ln Royal Palm Beach, FL | 3.0 | 2.5 | 1579 | $3,000 | $1.90 | 24d | 1 | 1.29mi |
| 100 Sparrow Dr #14 Royal Palm Beach, FL | 3.0 | 2.0 | 1737 | $2,725 | $1.57 | 24d | 1 | 1.29mi |
| 12775 Guilford Cir Wellington, FL | 4.0 | 3.0 | 2212 | $7,000 | $3.16 | 24d | 1 | 1.33mi |
| 930 Rambling Drive Cir Wellington, FL | 3.0 | 2.5 | 2440 | $7,950 | $3.26 | 24d | 1 | 1.34mi |
| 13175 Quiet Woods Rd Unit A Wellington, FL | 3.0 | 2.5 | 1585 | $3,000 | $1.89 | 2d | 1 | 1.37mi |
| 13175 Quiet Woods Rd Unit A Wellington, FL | 3.0 | 2.5 | 1585 | $3,000 | $1.89 | 16d | 1 | 1.37mi |
| 1000 Lake Breeze Dr Wellington, FL | 3.0 | 2.0 | 1857 | $3,900 | $2.10 | 3d | 1 | 1.37mi |
| 1000 Lake Breeze Dr Wellington, FL | 3.0 | 2.0 | 1857 | $3,500 | $1.88 | 2d | 1 | 1.37mi |
| 1235 Rowayton Cir Wellington, FL | 3.0 | 2.0 | 1511 | $3,200 | $2.12 | 3d | 1 | 1.40mi |
HOA detail
- Monthly dues
- $361 · $4,332/yr
- Likely covers
- landscapingpool
Listing history 7 events
-
2026-06-18days on market $515,000 Active 9 DOM
-
2026-06-17days on market $515,000 Active 8 DOM
-
2026-06-16days on market $515,000 Active 7 DOM
-
2026-06-15days on market $515,000 Active 6 DOM
-
2026-06-13days on market $515,000 Active 4 DOM
-
2026-06-10remarks 695-char remark
-
2026-06-10$515,000 Active 1 DOM
ⓘ Source: listings_history table (triggers on properties + properties_extension) + one-shot
backfill from property_details.listing_events for pre-trigger history.
Tax reassessment forecast FL · Resets to sale price
- Current annual tax
- $7,952 · $663/mo
- Projected year-2 tax
- $7,952 · $663/mo
- Expected delta
- $0/yr ($0/mo · 0.0%)
ⓘ Screening estimate from a state-policy table — verify with the county assessor before closing.
Climate risk First Street
- Flood 1/10 Low FEMA zone X (unshaded) · 0% chance over 30 yrs
- Wildfire 1/10 Low
- Heat 10/10 Extreme 7 d/yr ≥107°F today · 25 d/yr by 30 yrs out
- Wind 10/10 Extreme 99% chance of damaging wind over 30 yrs
- Air quality 2/10 Low 0 unhealthy d/yr today · 1 by 30 yrs out
Nearby sold comps map
Loading sold comps map…
Walkable amenities ~0.75 mi
Loading nearby amenities…
Taxation est. · year 1
- Rental income
- $42,535
- − Mortgage interest
- −$28,848
- − Property taxes
- −$7,952
- − Insurance
- −$2,575
- − Repairs & maintenance
- −$3,403
- − Management
- −$3,403
- − HOA
- −$4,332
- − Depreciation
- −$14,982
- Taxable loss
- −$22,959
- Est. tax savings @ 24.0%
- +$5,510
- After-tax cash flow
- $-8,155/yr
For passive investors: Depreciation is non-cash, so a rental often shows a tax loss while cash-flowing — sheltering income. Rental losses are passive: they offset passive income freely, and up to $25,000/yr can offset ordinary (W-2) income if you actively participate and your MAGI is under $100k (phasing out to $0 by $150k); unused losses carry forward. On sale, claimed depreciation is recaptured at up to 25%, and gains may owe capital-gains tax (a 1031 exchange can defer both). Figures are a year-1 estimate at your 24.0% rate — not tax advice; consult a CPA.
Schools (NCES district)
- District
- Palm Beach
- NCES district ID
- 1201500
- Math proficiency
- 46% ▼ -16.00%
- Reading proficiency
- 53% ▼ -4.00%
- Median HH income
- $53,943
- Composite
- 42.72/100
- National rank
- #3160
- State rank
- #34 of 73 in FL
Livability — Royal Palm Beach
- Score
- 79/100
- State rank
- #135
- US rank
- #2039
Category grades
Schools grade is shown separately in the Schools card above.
Census & demographics
- Census place
- Royal Palm Beach, FL
- County
- Palm Beach County · 1,438,312 people
- City population
- 75,299
- Metro
- Miami-Fort Lauderdale-Pompano Beach, FL
- Population (ZIP)
- 76,863
- Household income
- $92,591
- Rent vs Own
- Severe rent burden
- 1870.0
Population outlook (Palm Beach County) Hauer SSP2
- Today (2025)
- 1,637,487 people
- By 2030
- 1,743,255 · +6.5%
- By 2040
- 1,948,712 · +19.0%
- By 2050
- 2,132,979 · +30.3%
- By 2075
- 2,530,027 · +54.5%
- By 2100
- 2,706,979 · +65.3%
Race, ethnicity, and origin ACS 2023
- Neighborhood character
- Diverse neighborhood (Simpson 0.70)
- Race & ethnicity
- White 44% Hispanic / Latino 24% Black 23% Two or more races 16% Asian 5%
- Hispanic origin (detail)
- Mexican 2% Puerto Rican 5% Cuban 4% Dominican 2%
- Common ancestry
- Hispanic 6% Romanian 2% Italian 1%
- Foreign-born
- 26% · Canada, Jamaica, China
- Languages at home
- 73% English-only · Spanish 17% French/Haitian/Cajun 4% Other Indo-European 2%
Political lean MEDSL · Palm Beach
- 2024 margin
- Toss-up / Even · D 50.0% · R 49.2%
- 2008→2024 swing
- -22.1pp toward R · 2008: 22.9pp · 2024: 0.8pp
- All cycles
- 2024: D+0.8 2020: D+12.8 2016: D+15.3 2012: D+17.0 2008: D+22.9
Not yet ingested
- Civics
- —
Market trends
- HPI YoY
- ▲ 17.04%
- Current HPI
- 903.78
- Rent YoY
- ▲ 0.85%
- Metro
- Miami-Fort Lauderdale-Pompano Beach, FL
- State GDP YoY
- ▲ 3.28%
- F500 in state
- 36
Industry mix (Fortune 500 HQ in FL)
| Industry | F500 HQs | Revenue |
|---|---|---|
| Industrial Technology | 2 | $29B |
|
||
| Insurance | 2 | $17B |
|
||
| Retail | 1 | $60B |
|
||
| Technology Distribution | 1 | $58B |
|
||
| Homebuilding | 1 | $35B |
|
||
| Technology Manufacturing | 1 | $35B |
|
||
Price history
+41.1% since first listed21 events — show timeline
- 2026-06-09 Listed $515,000 Beaches MLS
- 2026-06-03 Listed for Rent $3,500 GFLMLS
- 2026-06-02 Rental Removed $3,500 RMLSFL
- 2026-06-01 Listed for Rent $3,500 RMLSFL
- 2024-07-11 Sold (Public Records) $540,000 Public Records
- 2021-07-30 Sold (MLS) $390,000 Beaches MLS
- 2021-07-05 Price Changed $395,000 Beaches MLS
- 2021-07-05 Contingent — Beaches MLS
- 2021-07-04 Listed $389,000 Beaches MLS
- 2021-06-29 Coming Soon $389,000 Beaches MLS
- 2019-09-20 Relisted — Beaches MLS
- 2019-09-12 Listing Removed — Beaches MLS
- 2019-07-30 Relisted — Beaches MLS
- 2019-07-30 Contingent — Beaches MLS
- 2019-07-30 Listing Removed — Beaches MLS
- 2019-06-14 Price Changed $335,000 Beaches MLS
- 2019-06-05 Relisted — Beaches MLS
- 2019-06-03 Listing Removed — Beaches MLS
- 2019-04-10 Listed $339,000 Beaches MLS
- 2019-01-15 Listing Removed — Beaches MLS
- 2018-10-15 Listed $364,900 Beaches MLS
Property tax history
+32.4%/yrLatest (2025): $7,952 · +23.7% YoY. Source: county tax records.
Cash-flow waterfall
monthlySold comps — $/sqft
last 12 mo · ≤1 miLoading sold comps…