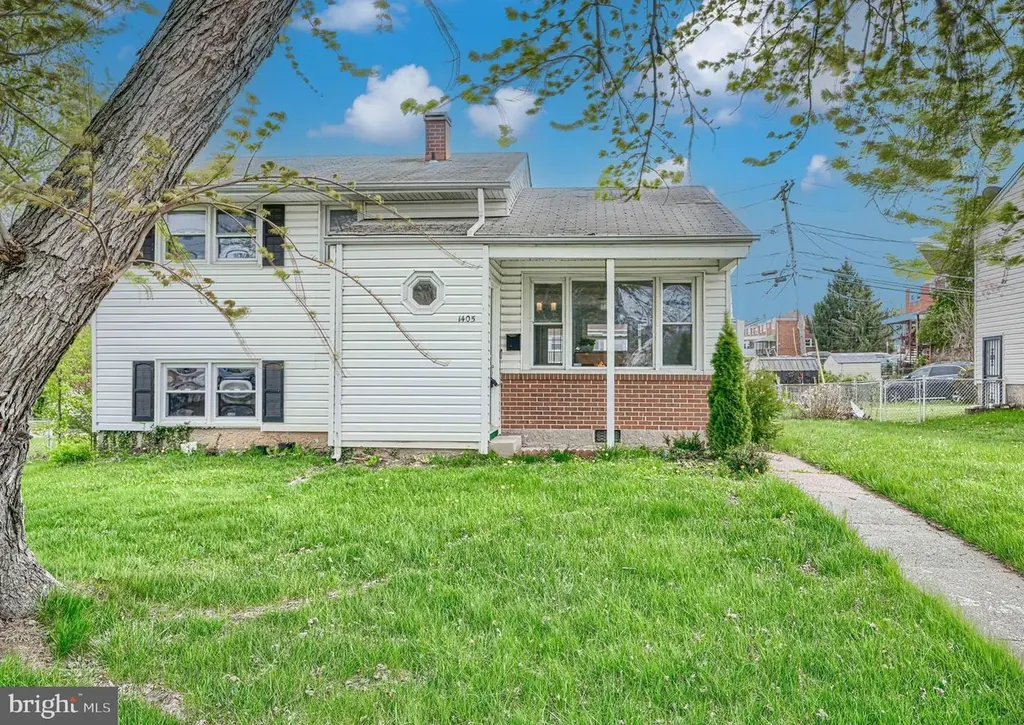
1405 Ingleside Ave · Woodlawn, MD
Flood risk 1/10 · Minimal
- FEMA flood zone
- X (unshaded)
- Chance of flooding over 30 yrs
- 0.0%
- Est. flood insurance / yr
- $507 – $1,088
Fire risk 1/10 · Minimal
- Est. fire insurance / yr
- $755 – $1,403
Heat risk 7/10 · Major
- Hot days now (above 103°F)
- 7 days/yr
- Hot days in 30 yrs
- 15 days/yr
Wind risk 4/10 · Minor
- Chance of severe wind over 30 yrs
- 17.0%
Air-quality risk 3/10 · Minor
- Unhealthy air days now
- 3 days/yr
- Unhealthy air days in 30 yrs
- 4 days/yr
Risk factors via First Street. Map © Google.
Why this score? — see what drove the D grade
The composite is a weighted blend of 9 inputs, each scored 0–100. Each bar is that input's sub-score; the figure is the points it added to the 100-point composite (weight × sub-score).
- ARV discount +9.9/15.0
- Appreciation +9.8/10.0
- Cash flow +7.6/30.0
- Livability +3.9/5.0
- Rent growth +3.8/5.0
- Condition / age +2.5/5.0
- Schools +2.3/10.0
- 1% rule +1.9/10.0
- DSCR +1.7/10.0
$300,000
🖨 Deal sheet (PDF) 📄 Offer letter ✓ Due diligence
Listing remarks
🔥 PRICE DROP — NOW $300,000! 🔥 Own a detached single-family home in Baltimore County for UNDER $300K! Conveniently located near Catonsville and Exit 70 (I-695), this well-maintained split-level home features 3 bedrooms, 1 bathroom, central A/C, a partially finished basement, private driveway, and spacious yard. Perfect for first-time buyers or anyone looking for value, space, and commuter convenience with easy access to I-695, I-70, and Route 40!
Key facts
- Spacious yard
- Easy access to i-70
- Private driveway
Tags
Property features AI
Finance
- Other: Total below-grade area reported as 323 by assessor; Above-grade finished area reported as 1,379 by assessor
- Financial info: Annual ground rent payment (semi-annually) $150
Exterior
- Parking: Driveway and off-street parking
- Utilities: Public water; Public sewer; Electric cooling fuel
- Home design: Detached property; Brick and vinyl siding exterior; Shingle/composite roof
- Construction: Block foundation
- Exterior features: Not in a federal flood zone; Ground rent exists (paid semi-annually)
Interior
- Bedrooms: Three bedrooms on the upper level
- Bathrooms: One full bathroom
- Heating & cooling: Forced air heating; Central air conditioning; Natural gas heating and hot water
- Interior features: Fully finished basement; Living area measured by assessor
Neighborhood map
What this means for you Summary
Snapshot
- This is a 3-bed/1.0-bath single-family listed at $300k.
Deal economics
- At list price, monthly cash flow is $-361 ($-4k/yr) — negative.
- To cash-flow at today's rent, offer at most $236k (21.3% below list).
- To meet the 1% rule (rent ≥ 1% of price), the offer needs to be $207k (31.1% below list).
- Recommended offer: $207k (31.1% below list) — sets the bar for 1% rule.
Location & tenants
- Location reads 77/100 on livability (#78 in MD, #2,926 nationally) — a middle-class / working-renter tenant base. Strengths: commute A+, housing A+, employment A-; Watch: amenities D+, crime F.
- Baltimore County Public Schools (suburban): math 15% / reading 34% proficiency, ranked #11 of 24 in MD (top 46%) — low school quality limits family demand, transient renter base, plan for 1-2y turnover.
- Zoned schools: Edmondson Heights Elementary (math 2% / reading 4%, grade F, #822 of 860 statewide, top 96%, 559 students, 70% FRL); Southwest Academy (math 6% / reading 34%, grade F, #147 of 225 statewide, top 68%, 739 students, 64% FRL); Woodlawn High (math 4% / reading 27%, grade F, #184 of 222 statewide, top 83%, 1,815 students, 63% FRL) — zoned schools average 66% FRL vs 39% district-wide (27 pts higher); higher-poverty schools than district average — tighter screening recommended.
- Market conditions: Rents rising fast (+5.2%/yr); 131 active listings in the ZIP; 23 comparable units currently listed for rent nearby; rentals leasing fast (median 13d on market — plan ~1-2 weeks tenant-placement turnaround); 1,511 units permitted in Baltimore County in 2024 (643 in 5+ unit buildings).
- This rent runs 37% of the median local income ($67k/yr) — at the standard rent-burdened threshold; future hikes will face affordability resistance.
Forward outlook
- In year one you build about $31k of equity ($2k loan paydown + $28k appreciation (9.5% local appreciation)).
- Baltimore County population projected at +12% by 2050 — modest demand growth; plan on rents tracking national, not racing it.
- By year 2, paydown + projected appreciation supports a ~$49k cash-out refi (75% LTV) — recoverable capital for the next deal without selling this one.
Negotiation context
- Only 11 days on market — expect competitive offers; lowballing is unlikely to land.
- 4 sale attempts since 4y ago with the ask held roughly flat each time — persistent listings suggest the price (not the market) is what's stuck; bring a comps-based counter.
Risks & watch-outs
- Climate carrying-cost: extreme-heat days projected 7→15/yr by 2055 (HVAC capex compounding) — expect insurance premiums to compound above CPI over the hold.
Questions for the listing agent
- What do current leases actually rent for vs. the listed asking? Can we see a recent rent roll and the last 12 months of T-12 income?
- Built in 1962 — when were the roof, HVAC, electrical panel, plumbing, and water heater last replaced?
- Is there a deadline driving the sale (1031 exchange, divorce, estate, relocation)? That informs how much negotiation room exists.
- Schools are B-rated — typically a magnet for longer-tenancy family renters. What's the average tenant stay here, and is there a school-zone premium baked into asking?
- Crime grade is F in this area — have there been break-ins, vandalism, or insurance claims at this property in the last 3 years? What carrier currently insures it and at what premium?
- The area grade is low — what's the realistic commute time and amenity access for the typical tenant pool here? Any planned neighborhood developments (good or bad) we should know about?
- What's the average days-on-market for RENTAL listings here right now (not sales)? A rising rental-DOM trend means longer vacancies and softer asking-rent achievability than the comps imply.
- What's the recent tenant-quality profile in this submarket — average credit score on applications, eviction rate, late-payment / NSF rate, and stable-employment percentage? A property-management company in the area should have these aggregated.
- How much new for-sale + rental construction is in the pipeline within 1–3 miles? Heavy new supply typically softens prices + rents 12–24 months out; constrained supply supports both.
Investment metrics
- 1% rule
- 0.69% ✗
- Cap rate
- 4.85%
- Cash-on-cash
- -5.16%
- DSCR
- 0.77
- GRM
- 12.1
CMA / ARV
- ARV (median comp)
- $316,881
- List price
- $300,000
- Delta
- -5.33%
- Verdict
- FAIR
- Comps
- 20 within 1.0 mi
Show comp detail 12 sales within ~0.75 mi
| Address | Dist | Beds/Ba | Sqft | Sold | Price | $/sf | Match |
|---|---|---|---|---|---|---|---|
| 5932 Saint Marys St | 0.24mi | 3/1.5 | 1,440 (+4%) | 8mo | $300,000 | $208 | 73 |
| 1129 Ingleside Ave | 0.25mi | 3/1.0 | 1,455 (+6%) | 10mo | $275,000 | $189 | 71 |
| 5915 Johnnycake Rd | 0.42mi | 3/1.0 | 1,461 (+6%) | 10mo | $325,000 | $222 | 62 |
| 5902 Harford Ave | 0.17mi | 4/2.0 (+1) | 1,238 (-10%) | 10mo | $350,000 | $283 | 58 |
| 5920-H Montgomery St | 0.20mi | 4/2.0 (+1) | 1,464 (+6%) | 17mo | $330,000 | $225 | 57 |
| 1516 Ingleside Ave | 0.32mi | 3/2.0 | 1,446 (+5%) | 20mo | $340,000 | $235 | 56 |
| 5941 Sunset Ave | 0.37mi | 2/1.5 (-1) | 1,416 (+3%) | 21mo | $269,600 | $190 | 54 |
| 5922 Johnnycake Rd | 0.40mi | 2/1.0 (-1) | 1,308 (-5%) | 20mo | $239,900 | $183 | 51 |
| 1073 Southridge Rd | 0.48mi | 3/1.5 | 1,508 (+9%) | 11mo | $332,000 | $220 | 51 |
| 5903 Queen Anne St | 0.26mi | 4/2.0 (+1) | 1,222 (-11%) | 17mo | $325,000 | $266 | 45 |
| 1344 Martin Dr | 0.66mi | 4/2.0 (+1) | 1,512 (+10%) | 1mo | $295,000 | $195 | 43 |
| 930 Sedgley Rd | 0.72mi | 3/1.0 | 1,174 (-15%) | 8mo | $305,000 | $260 | 35 |
Match score weights: distance 35% · size 25% · config 20% · recency 20%. Top-matched comps best support the ARV.
Projected returns pro-forma
9.5% appreciation · 5.23% rent growth · sell at horizon
- IRR
- 20.1%
- Equity multiple
- 2.61×
- Total profit
- $134,871
- Equity at exit
- $259,382
- IRR
- 18.9%
- Equity multiple
- 6.04×
- Total profit
- $423,304
- Equity at exit
- $548,180
Cash invested: $84,000 (down + closing). Projections, not guarantees.
Landlord ↔ Tenant lean methodology
- Overall (STATE)
- 27 Tenant-Leaning
- State Maryland
- 27 Tenant-Leaning · D+14
- County
- — inherits STATE
- City
- — inherits STATE
ZIP-level market 21207
- Home prices YoY
- 1.1%
- Rents YoY
- 5.2%
- Active inventory
- 131
- Price-to-rent
- 12.1×
Monthly cashflow live
- Estimated rent
- $2,066 high interval (Pro) →
- Mortgage (P&I)
- −$1,573
- Tax from tax record
- −$295 /mo · $3,544/yr
- Insurance
- −$125
- HOA
- −$0
- Vacancy / Maint / Mgmt
- −$434
- Net cashflow
- $-361
Break-even live
Sensitivity live
| Price | -10% $-191 | -5% $-276 | +0% $-361 | +5% $-446 | +10% $-531 |
|---|---|---|---|---|---|
| Rent | -10% $-525 | -5% $-443 | +0% $-361 | +5% $-280 | +10% $-198 |
| Rate | -1.0pp $-210 | -0.5pp $-285 | base $-361 | +0.5pp $-439 | +1.0pp $-518 |
UW: 25.0% down · 7.5% · 30yr · 1.5% tax · 5.0% vac · 8.0% maint · 8.0% mgmt
Financing live
Cash to close
- Down payment
- $75,000
- Closing costs
- $9,000
- Reserves months
- —
- Total cash needed
- —
Loan-product check · same deal, 3 products live
Conventional
25% down · 7.5% · 30yr
- Down + closing
- —
- Monthly P&I
- —
- Monthly cashflow
- —
- DSCR
- —
- Eligible?
- —
Personal DTI + credit; lowest rate.
DSCR
20% down · 8.5% · 30yr
- Down + closing
- —
- Monthly P&I
- —
- Monthly cashflow
- —
- DSCR
- —
- Eligible?
- —
No personal income docs; deal must DSCR.
Hard money
10% down · 12.0% · 12mo
- Down + closing
- —
- Monthly P&I
- —
- Monthly cashflow
- —
- DSCR
- —
- Eligible?
- —
Short-term bridge; refi at stabilization.
Rent comps 23 comps
| Address | Beds | Baths | Sqft | Rent | $/sqft | DOM | Units | Dist |
|---|---|---|---|---|---|---|---|---|
| 1530 Kirkwood Rd Gwynn Oak, MD | 3.0 | 1.5 | 1424 | $2,100 | $1.47 | 12d | 1 | 0.29mi |
| 930 Masefield Rd Unit 1 Woodlawn, MD | 3.0 | 1.5 | 1080 | $2,650 | $2.45 | 4d | 1 | 0.33mi |
| 945 Saint Agnes Ln Gwynn Oak, MD | 4.0 | 2.0 | 1500 | $1,985 | $1.32 | 19d | 1 | 0.42mi |
| 1546 Ingleside Ave Woodlawn, MD | 1.0–2.0 | 1.0 | 820 | $1,600 | $1.95 | 0d | 3 | 0.51mi |
| 2 Walden Birch Ct Woodlawn, MD | 3.0 | 1.5 | 1022 | $1,792 | $1.75 | 6d | 1 | 0.67mi |
| 408 Shade Tree Pl Catonsville, MD | 1.0–2.0 | 1.0–2.0 | 805 | $1,812 | $2.25 | 6d | 1 | 0.72mi |
| 603 Braeside Rd Baltimore, MD | 3.0 | 2.0 | 1416 | $2,400 | $1.69 | 45d | 1 | 0.95mi |
| 311 Harlem Ln Catonsville, MD | 3.0 | 2.0 | 1152 | $2,300 | $2.00 | 6d | 1 | 1.03mi |
| 10 Prestwick Sq Catonsville, MD | 4.0 | 2.5 | 1710 | $2,500 | $1.46 | 19d | 1 | 1.15mi |
| 5215 Muth Ave Gwynn Oak, MD | 3.0 | 3.0 | 1205 | $2,700 | $2.24 | 16d | 1 | 1.25mi |
| 417 Wheaton Pl Catonsville, MD | 2.0 | 1.0 | 1200 | $2,169 | $1.81 | 5d | 1 | 1.26mi |
| 410 Winters Ln Catonsville, MD | 2.0 | 2.0 | 1296 | $2,000 | $1.54 | 6d | 1 | 1.30mi |
| 1200 Alexander Ave Catonsville, MD | 3.0 | 2.5 | 1215 | $2,400 | $1.98 | 45d | 1 | 1.30mi |
| 5136 Oaklawn Rd Gwynn Oak, MD | 1.0–3.0 | 1.0 | 896 | $1,715 | $1.91 | 0d | 21 | 1.33mi |
| 436 Westshire Dr Catonsville, MD | 4.0 | 2.0 | 1548 | $2,800 | $1.81 | 45d | 1 | 1.37mi |
| 5364 Jamestowne Ct Baltimore, MD | 3.0 | 1.0–1.5 | 787 | $1,905 | $2.42 | 0d | 15 | 1.38mi |
| 51 Briarwood Rd Catonsville, MD | 3.0 | 1.0 | 1200 | $2,100 | $1.75 | 45d | 1 | 1.39mi |
| 220 Stonecroft Rd Unit 220-H Baltimore, MD | 2.0 | 1.5 | 900 | $1,245 | $1.38 | 0d | 1 | 1.43mi |
| 220 Stonecroft Rd Unit 230-D Baltimore, MD | 2.0 | 1.5 | 900 | $1,395 | $1.55 | 23d | 1 | 1.43mi |
| 220 Stonecroft Rd Unit 232-I Baltimore, MD | 2.0 | 1.5 | 900 | $1,295 | $1.44 | 19d | 1 | 1.43mi |
| 1 Janper Ct Baltimore, MD | 2.0 | 1.5 | 950 | $1,575 | $1.66 | 0d | 2 | 1.43mi |
| 131 N Bend Rd Unit 131-1B Baltimore, MD | 2.0 | 1.5 | 910 | $1,225 | $1.35 | 23d | 1 | 1.46mi |
| 609 Wallerson Rd Catonsville, MD | 3.0 | 2.0 | 1704 | $3,395 | $1.99 | 22d | 1 | 1.47mi |
Listing history 32 events
-
2026-06-21days on market $300,000 Active 11 DOM
-
2026-06-18days on market $300,000 Active 8 DOM
-
2026-06-17days on market $300,000 Active 7 DOM
-
2026-06-16days on market $300,000 Active 6 DOM
-
2026-06-15days on market $300,000 Active 5 DOM
-
2026-06-13days on market $300,000 Active 3 DOM
-
2026-06-07days on market $300,000 Active 53 DOM
-
2026-06-04days on market $300,000 Active 50 DOM
-
2026-06-03days on market $300,000 Active 49 DOM
-
2026-06-02days on market $300,000 Active 48 DOM
-
2026-06-01days on market $300,000 Active 47 DOM
-
2026-05-31days on market $300,000 Active 46 DOM
-
2026-05-12price $300,000 459-char remark
-
2026-04-27price $325,000 459-char remark
-
2026-04-24price $330,000 459-char remark
-
2026-04-18price $339,300 459-char remark
-
2026-04-16$349,900 Active 459-char remark
-
2026-04-09historical $349,900 459-char remark
-
2025-12-18historical
-
2025-09-20price $320,000
-
2025-09-04$330,000 Active
-
2025-08-29historical
-
2025-08-27historical
-
2025-08-08price $330,000
-
2025-08-08historical
-
2022-09-21soldstatus $275,000
-
2022-07-19historical
-
2022-06-30soldstatus $275,000 Closed
-
2022-05-22status Pending
-
2022-05-19$275,000 Active
-
1993-11-10soldstatus $86,000
-
1983-11-29soldstatus $58,900
ⓘ Source: listings_history table (triggers on properties + properties_extension) + one-shot
backfill from property_details.listing_events for pre-trigger history.
Tax reassessment forecast MD · Partial reset (capped growth)
- Current annual tax
- $3,544 · $295/mo
- Projected year-2 tax
- $3,544 · $295/mo
- Expected delta
- $0/yr ($0/mo · 0.0%)
ⓘ Screening estimate from a state-policy table — verify with the county assessor before closing.
Climate risk First Street
- Flood 1/10 Low FEMA zone X (unshaded) · 0% chance over 30 yrs
- Wildfire 1/10 Low
- Heat 7/10 Severe 7 d/yr ≥103°F today · 15 d/yr by 30 yrs out
- Wind 4/10 Moderate 17% chance of damaging wind over 30 yrs
- Air quality 3/10 Moderate 3 unhealthy d/yr today · 4 by 30 yrs out
Nearby sold comps map
Loading sold comps map…
Walkable amenities ~0.75 mi
Loading nearby amenities…
Taxation est. · year 1
- Rental income
- $24,795
- − Mortgage interest
- −$16,805
- − Property taxes
- −$3,544
- − Insurance
- −$1,500
- − Repairs & maintenance
- −$1,984
- − Management
- −$1,984
- − Depreciation
- −$8,727
- Taxable loss
- −$9,749
- Est. tax savings @ 24.0%
- +$2,340
- After-tax cash flow
- $-1,996/yr
For passive investors: Depreciation is non-cash, so a rental often shows a tax loss while cash-flowing — sheltering income. Rental losses are passive: they offset passive income freely, and up to $25,000/yr can offset ordinary (W-2) income if you actively participate and your MAGI is under $100k (phasing out to $0 by $150k); unused losses carry forward. On sale, claimed depreciation is recaptured at up to 25%, and gains may owe capital-gains tax (a 1031 exchange can defer both). Figures are a year-1 estimate at your 24.0% rate — not tax advice; consult a CPA.
Schools (NCES district)
- District
- Baltimore County Public Schools
- NCES district ID
- 2400120
- Math proficiency
- 15% ▼ -16.00%
- Reading proficiency
- 34% ▼ -5.00%
- Median HH income
- $66,746
- Composite
- 23.17/100
- National rank
- #7948
- State rank
- #11 of 24 in MD
Livability — Woodlawn
- Score
- 77/100
- State rank
- #78
- US rank
- #2926
Category grades
Schools grade is shown separately in the Schools card above.
Census & demographics
- Census place
- Woodlawn, MD
- County
- Baltimore County · 769,527 people
- City population
- 49,599
- Metro
- Baltimore-Columbia-Towson, MD
- Population (ZIP)
- 47,099
- Household income
- $67,060
- Rent vs Own
- Severe rent burden
- 2139.0
Population outlook (Baltimore County) Hauer SSP2
- Today (2025)
- 885,518 people
- By 2030
- 909,272 · +2.7%
- By 2040
- 951,547 · +7.5%
- By 2050
- 990,955 · +11.9%
- By 2075
- 1,086,411 · +22.7%
- By 2100
- 1,135,078 · +28.2%
Race, ethnicity, and origin ACS 2023
- Neighborhood character
- Predominantly Black (78%)
- Race & ethnicity
- Black 78% White 8% Hispanic / Latino 7% Two or more races 5% Asian 3%
- Hispanic origin (detail)
- Puerto Rican 1%
- Common ancestry
- Swedish 1%
- Foreign-born
- 13% · Canada, Philippines, South Korea
- Languages at home
- 86% English-only · Spanish 4% French/Haitian/Cajun 1% Other Asian/Pacific 1%
Political lean MEDSL · Baltimore
- 2024 margin
- Strong D (+24.5) · D 61.0% · R 36.5% · Other 2.5%
- 2008→2024 swing
- +9.9pp toward D · 2008: 14.6pp · 2024: 24.5pp
- All cycles
- 2024: D+24.5 2020: D+27.0 2016: D+17.4 2012: D+16.4 2008: D+14.6
Not yet ingested
- Civics
- —
Market trends
- HPI YoY
- ▲ 9.50%
- Current HPI
- 843.63
- Rent YoY
- ▲ 5.23%
- Metro
- Baltimore-Columbia-Towson, MD
- State GDP YoY
- ▲ 2.97%
- F500 in state
- 12
Industry mix (Fortune 500 HQ in MD)
| Industry | F500 HQs | Revenue |
|---|---|---|
| Aerospace / Defense | 1 | $71B |
|
||
| Utilities | 1 | $25B |
|
||
| Hotels | 1 | $24B |
|
||
| Consumer Goods | 1 | $7B |
|
||
| Real Estate | 1 | $6B |
|
||
| Chemicals | 1 | $2B |
|
||
Price history
+409.3% since first listed22 events — show timeline
- 2026-06-10 Listed $300,000 BRIGHT MLS
- 2026-06-07 Listing Removed — BRIGHT MLS
- 2026-05-12 Price Changed $300,000 BRIGHT MLS
- 2026-04-27 Price Changed $325,000 BRIGHT MLS
- 2026-04-24 Price Changed $330,000 BRIGHT MLS
- 2026-04-18 Price Changed $339,300 BRIGHT MLS
- 2026-04-16 Listed $349,900 BRIGHT MLS
- 2026-04-09 Coming Soon — BRIGHT MLS
- 2025-12-18 Listing Removed — BRIGHT MLS
- 2025-09-20 Price Changed $320,000 BRIGHT MLS
- 2025-09-04 Listed $330,000 BRIGHT MLS
- 2025-08-29 Coming Soon — BRIGHT MLS
- 2025-08-27 Listing Removed — BRIGHT MLS
- 2025-08-08 Price Changed $330,000 BRIGHT MLS
- 2025-08-08 Coming Soon — BRIGHT MLS
- 2022-09-21 Sold (Public Records) $275,000 Public Records
- 2022-07-19 Listing Removed — BRIGHT MLS
- 2022-06-30 Sold (MLS) $275,000 BRIGHT MLS
- 2022-05-22 Pending — BRIGHT MLS
- 2022-05-19 Listed $275,000 BRIGHT MLS
- 1993-11-10 Sold (Public Records) $86,000 Public Records
- 1983-11-29 Sold (Public Records) $58,900 Public Records
Property tax history
+4.6%/yrLatest (2025): $3,544 · +8.2% YoY. Source: county tax records.
Cash-flow waterfall
monthlySold comps — $/sqft
last 12 mo · ≤1 miLoading sold comps…