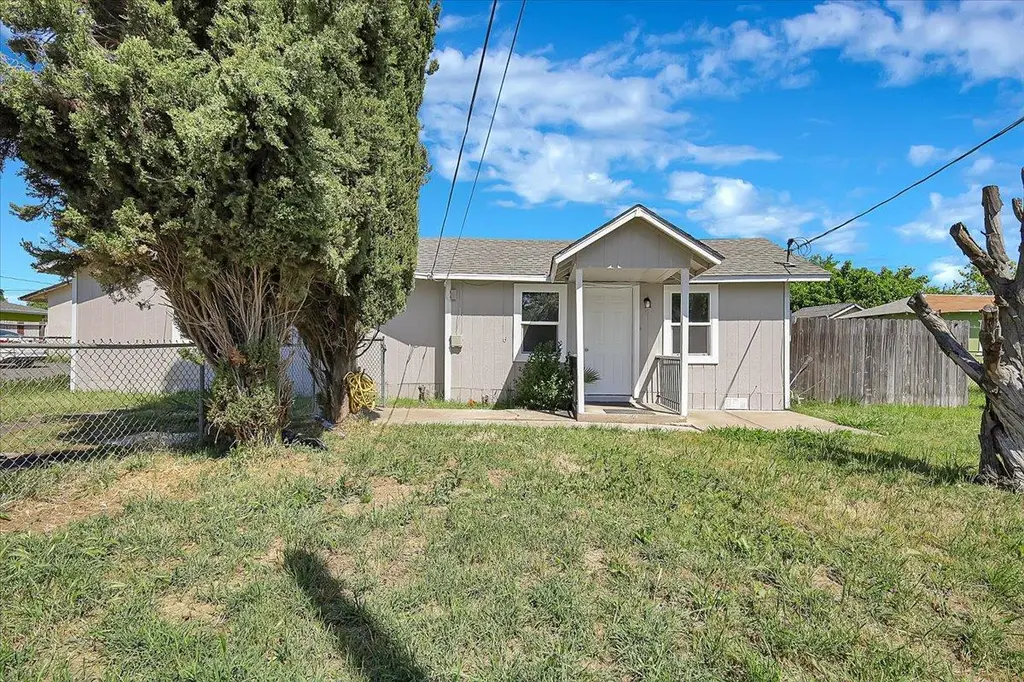
1613 9th Ave · Olivehurst, CA
Flood risk 5/10 · Moderate
- FEMA flood zone
- X
- Chance of flooding over 30 yrs
- 0.26%
- Est. flood insurance / yr
- $507 – $1,088
Fire risk 7/10 · Major
- Est. fire insurance / yr
- $659 – $1,223
Heat risk 7/10 · Major
- Hot days now (above 104°F)
- 7 days/yr
- Hot days in 30 yrs
- 16 days/yr
Wind risk 1/10 · Minimal
- Chance of severe wind over 30 yrs
- —
Air-quality risk 10/10 · Severe
- Unhealthy air days now
- 26 days/yr
- Unhealthy air days in 30 yrs
- 30 days/yr
Risk factors via First Street. Map © Google.
Why this score? — see what drove the C- grade
The composite is a weighted blend of 9 inputs, each scored 0–100. Each bar is that input's sub-score; the figure is the points it added to the 100-point composite (weight × sub-score).
- Cash flow +17.2/30.0
- ARV discount +15.0/15.0
- DSCR +5.4/10.0
- 1% rule +3.8/10.0
- Livability +2.9/5.0
- Rent growth +2.5/5.0
- Condition / age +2.5/5.0
- Schools +1.8/10.0
- Appreciation +0.0/10.0
$249,900
🖨 Deal sheet 📄 Offer letter ✓ Due diligence
Listing remarks MLS
Affordable, Adorable 3 bedroom home with bonus room. Freshly remodeled with new flooring, paint, kitchen counter and cabinets. The bonus room can be used for office, game room or family room. Third bedroom has outdoor access. This home is great for first time home buyer, investment or a place to call home. Come take a look.
Key facts
- Spacious yard
- Bright living area
- Ample cabinet space
Tags
Neighborhood map
What this means for you Summary
Snapshot
- This is a 3-bed/1.0-bath single-family listed at $250k.
Deal economics
- At list price, monthly cash flow is $180 ($2k/yr) — positive.
- The deal already cash-flows at list — no discount required.
- To meet the 1% rule (rent ≥ 1% of price), the offer needs to be $219k (12.3% below list).
- Recommended offer: $219k (12.3% below list) — sets the bar for 1% rule.
- Cap rate 7.2% vs local median 3.8% in Olivehurst — top-decile yield for the area; either an underpriced asset or a hidden risk that comps aren't pricing in. Stress-test before assuming the spread holds.
Location & tenants
- Location reads 58/100 on livability (#679 in CA) — a working-class tenant base; expect higher turnover. Strengths: housing A+, commute A-; Watch: employment C-, schools F, crime F.
- Marysville Joint Unified (suburban): math 14% / reading 28% proficiency, ranked #455 of 517 in CA (top 88%) — low school quality limits family demand, transient renter base, plan for 1-2y turnover; 68% free/reduced lunch — lower-income household profile, screen leases tightly.
- Market conditions: 315 active listings in the ZIP; 4 comparable units currently listed for rent nearby; rentals at typical pace (median 21d on market — plan ~3-4 weeks tenant-placement turnaround); solid renter incomes; 750 units permitted in Yuba County in 2024 (41 in 5+ unit buildings).
Forward outlook
- Local home prices are declining (-3.0%/yr); year-one equity from $2k of loan paydown is wiped out by about $7k of value loss. Plan a longer hold.
- Yuba County population projected to shrink 3% by 2050 — rents likely to lag national; underwrite the cash flow, not the appreciation.
Negotiation context
- It's been on market 50 days — a 3% lower offer ($242k) is reasonable based on typical stale-listing flexibility.
- Current owner paid $130k; list at $250k implies a 92% gain — meaningful room to come down on a strong offer.
Risks & watch-outs
- Watch-outs: built in 1947 — expect roof / HVAC / electrical / plumbing capex.
- Climate carrying-cost: moderate flood risk; major wildfire risk; extreme-heat days projected 7→16/yr by 2055 (HVAC capex compounding) — expect insurance premiums to compound above CPI over the hold.
Questions for the listing agent
- It's been on market 50 days. Have you received any prior offers? Is the seller open to a 12% concession, seller financing, or rate buy-down credit?
- Built in 1947 — when were the roof, HVAC, electrical panel, plumbing, and water heater last replaced?
- Is there a deadline driving the sale (1031 exchange, divorce, estate, relocation)? That informs how much negotiation room exists.
- Schools are F-rated, which usually means shorter tenancies and higher turnover. Who's the typical renter profile here, and what's been the actual vacancy rate?
- Crime grade is F in this area — have there been break-ins, vandalism, or insurance claims at this property in the last 3 years? What carrier currently insures it and at what premium?
- What's the average days-on-market for RENTAL listings here right now (not sales)? A rising rental-DOM trend means longer vacancies and softer asking-rent achievability than the comps imply.
- What's the recent tenant-quality profile in this submarket — average credit score on applications, eviction rate, late-payment / NSF rate, and stable-employment percentage? A property-management company in the area should have these aggregated.
- How much new for-sale + rental construction is in the pipeline within 1–3 miles? Heavy new supply typically softens prices + rents 12–24 months out; constrained supply supports both.
Investment metrics
- 1% rule
- 0.88% ✗
- Cap rate
- 7.16%
- Cash-on-cash
- 3.08%
- DSCR
- 1.14
- GRM
- 9.5
CMA / ARV
- ARV (median comp)
- $328,762
- List price
- $249,900
- Delta
- -23.99%
- Verdict
- UNDERPRICED
- Comps
- 20 within 1.0 mi
Show comp detail 12 sales within ~0.75 mi
| Address | Dist | Beds/Ba | Sqft | Sold | Price | $/sf | Match |
|---|---|---|---|---|---|---|---|
| 4724 Western | 0.07mi | 3/2.0 | 1,044 (-3%) | 8mo | $274,000 | $262 | 81 |
| 4779 Pacific Ave | 0.08mi | 2/1.0 (-1) | 1,056 (-2%) | 9mo | $325,000 | $308 | 81 |
| 4803 Pacific Ave | 0.12mi | 2/1.0 (-1) | 1,019 (-5%) | 1mo | $305,500 | $300 | 80 |
| 4928 Okmulgee Ave | 0.50mi | 2/1.0 (-1) | 1,068 (-1%) | 3mo | $325,000 | $304 | 68 |
| 1909 10th Ave | 0.62mi | 3/1.5 | 1,082 (+1%) | 1mo | $350,000 | $323 | 68 |
| 1829 8th Ave | 0.45mi | 3/2.0 | 1,118 (+4%) | 1mo | $350,000 | $313 | 67 |
| 1906 Chapman Ave | 0.61mi | 3/1.0 | 1,050 (-2%) | 2mo | $289,000 | $275 | 66 |
| 4859 Arboga Rd | 0.26mi | 3/2.0 | 940 (-13%) | 2mo | $342,000 | $364 | 61 |
| 4493 Ardmore Ave | 0.67mi | 3/1.0 | 1,128 (+5%) | 4mo | $340,000 | $301 | 58 |
| 1678 6th Ave | 0.43mi | 2/1.0 (-1) | 980 (-9%) | 4mo | $135,000 | $138 | 57 |
| 1648 4th Ave | 0.64mi | 3/2.0 | 1,200 (+12%) | 1mo | $395,000 | $329 | 46 |
| 4404 Seykota Ave | 0.73mi | 2/2.0 (-1) | 1,140 (+6%) | 5mo | $350,000 | $307 | 43 |
Match score weights: distance 35% · size 25% · config 20% · recency 20%. Top-matched comps best support the ARV.
Projected returns pro-forma
-3.0% appreciation · 3.0% rent growth · sell at horizon
- IRR
- -11.5%
- Equity multiple
- 0.58×
- Total profit
- $-29,122
- Equity at exit
- $37,261
- IRR
- -2.3%
- Equity multiple
- 0.84×
- Total profit
- $-10,921
- Equity at exit
- $21,607
Cash invested: $69,972 (down + closing). Projections, not guarantees.
Landlord ↔ Tenant lean methodology
- Overall (STATE)
- 18 Strongly Tenant-Friendly
- State California
- 18 Strongly Tenant-Friendly · D+13
- County
- — inherits STATE
- City
- — inherits STATE
ZIP-level market 95961
- Home prices YoY
- -28.2%
- Active inventory
- 315
- Price-to-rent
- 9.5×
Monthly cashflow live
- Estimated rent
- $2,193 medium interval (Pro) →
- Mortgage (P&I)
- −$1,311
- Tax from tax record
- −$138 /mo · $1,654/yr
- Insurance
- −$104
- HOA
- −$0
- Vacancy / Maint / Mgmt
- −$460
- Net cashflow
- $180
Break-even live
UW: 25.0% down · 7.5% · 30yr · 1.5% tax · 5.0% vac · 8.0% maint · 8.0% mgmt
Financing live
Cash to close
- Down payment
- $62,475
- Closing costs
- $7,497
- Reserves months
- —
- Total cash needed
- —
Loan-product check · same deal, 3 products live
Conventional
25% down · 7.5% · 30yr
- Down + closing
- —
- Monthly P&I
- —
- Monthly cashflow
- —
- DSCR
- —
- Eligible?
- —
Personal DTI + credit; lowest rate.
DSCR
20% down · 8.5% · 30yr
- Down + closing
- —
- Monthly P&I
- —
- Monthly cashflow
- —
- DSCR
- —
- Eligible?
- —
No personal income docs; deal must DSCR.
Hard money
10% down · 12.0% · 12mo
- Down + closing
- —
- Monthly P&I
- —
- Monthly cashflow
- —
- DSCR
- —
- Eligible?
- —
Short-term bridge; refi at stabilization.
Rent comps 4 comps
| Address | Beds | Baths | Sqft | Rent | $/sqft | DOM | Units | Dist |
|---|---|---|---|---|---|---|---|---|
| 1815 7th Ave Apt B Olivehurst, CA | 3.0 | 2.0 | 960 | $1,695 | $1.77 | 13d | 1 | 0.49mi |
| 1817 7th Ave Unit B Olivehurst, CA | 3.0 | 2.0 | 960 | $1,650 | $1.72 | 43d | 1 | 0.50mi |
| 1920 10th Ave Olivehurst, CA | 3.0 | 2.0 | 1160 | $2,300 | $1.98 | 21d | 1 | 0.64mi |
| 1624 Catalpa St Olivehurst, CA | 3.0 | 1.0 | 960 | $2,150 | $2.24 | 13d | 1 | 1.12mi |
Listing history 15 events
-
2026-06-13status $249,900 Pending 50 DOM
-
2026-06-10days on market $249,900 Active 50 DOM
-
2026-06-09days on market $249,900 Active 49 DOM
-
2026-06-08days on market $249,900 Active 48 DOM
-
2026-06-07days on market $249,900 Active 47 DOM
-
2026-06-05days on market $249,900 Active 44 DOM
-
2026-06-03days on market $249,900 Active 43 DOM
-
2026-06-02days on market $249,900 Active 42 DOM
-
2026-06-01days on market $249,900 Active 41 DOM
-
2026-05-31days on market $249,900 Active 40 DOM
-
2026-05-30days on market $249,900 Active 39 DOM
-
2019-01-23soldstatus $130,000 325-char remark
Show marketing remark (325 chars)
Affordable, Adorable 3 bedroom home with bonus room. Freshly remodeled with new flooring, paint, kitchen counter and cabinets. The bonus room can be used for office, game room or family room. Third bedroom has outdoor access. This home is great for first time home buyer, investment or a place to call home. Come take a look.
-
2019-01-23soldstatus $130,000
Show marketing remark (325 chars)
Affordable, Adorable 3 bedroom home with bonus room. Freshly remodeled with new flooring, paint, kitchen counter and cabinets. The bonus room can be used for office, game room or family room. Third bedroom has outdoor access. This home is great for first time home buyer, investment or a place to call home. Come take a look.
-
2018-12-18$134,900 325-char remark
Show marketing remark (325 chars)
Affordable, Adorable 3 bedroom home with bonus room. Freshly remodeled with new flooring, paint, kitchen counter and cabinets. The bonus room can be used for office, game room or family room. Third bedroom has outdoor access. This home is great for first time home buyer, investment or a place to call home. Come take a look.
ⓘ Source: listings_history table (triggers on properties + properties_extension) + one-shot
backfill from property_details.listing_events for pre-trigger history.
Tax reassessment forecast CA · Resets to sale price
- Current annual tax
- $1,654 · $138/mo
- Projected year-2 tax
- $1,899 · $158/mo
- Expected delta
- +$245/yr (+$20/mo · 14.8%)
ⓘ Screening estimate from a state-policy table — verify with the county assessor before closing.
Climate risk First Street
- Flood 5/10 Major FEMA zone X · 26% chance over 30 yrs
- Wildfire 7/10 Severe
- Heat 7/10 Severe 7 d/yr ≥104°F today · 16 d/yr by 30 yrs out
- Wind 1/10 Low
- Air quality 10/10 Extreme 26 unhealthy d/yr today · 30 by 30 yrs out
Nearby sold comps map
Loading sold comps map…
Walkable amenities ~0.75 mi
Loading nearby amenities…
Taxation est. · year 1
- Rental income
- $26,311
- − Mortgage interest
- −$13,998
- − Property taxes
- −$1,654
- − Insurance
- −$1,250
- − Repairs & maintenance
- −$2,105
- − Management
- −$2,105
- − Depreciation
- −$7,270
- Taxable loss
- −$2,070
- Est. tax savings @ 24.0%
- +$497
- After-tax cash flow
- $2,653/yr
For passive investors: Depreciation is non-cash, so a rental often shows a tax loss while cash-flowing — sheltering income. Rental losses are passive: they offset passive income freely, and up to $25,000/yr can offset ordinary (W-2) income if you actively participate and your MAGI is under $100k (phasing out to $0 by $150k); unused losses carry forward. On sale, claimed depreciation is recaptured at up to 25%, and gains may owe capital-gains tax (a 1031 exchange can defer both). Figures are a year-1 estimate at your 24.0% rate — not tax advice; consult a CPA.
Schools (NCES district)
- District
- Marysville Joint Unified
- NCES district ID
- 0624090
- Math proficiency
- 14% ▼ -13.00%
- Reading proficiency
- 28% ▼ -10.00%
- Median HH income
- $44,598
- Composite
- 18.18/100
- National rank
- #8961
- State rank
- #455 of 517 in CA
Livability — Olivehurst
- Score
- 58/100
- State rank
- #679
- US rank
- #20829
Category grades
Schools grade is shown separately in the Schools card above.
Census & demographics
- Census place
- Olivehurst, CA
- County
- Yuba County · 71,731 people
- City population
- 33,999
- Metro
- Yuba City, CA
- Population (ZIP)
- 33,999
- Household income
- $89,561
- Rent vs Own
- Severe rent burden
- 461.0
Population outlook (Yuba County) Hauer SSP2
- Today (2025)
- 75,432 people
- By 2030
- 75,358 · -0.1%
- By 2040
- 74,643 · -1.0%
- By 2050
- 72,937 · -3.3%
- By 2075
- 66,368 · -12.0%
- By 2100
- 54,524 · -27.7%
Race, ethnicity, and origin ACS 2023
- Neighborhood character
- Diverse neighborhood (Simpson 0.67)
- Race & ethnicity
- White 42% Hispanic / Latino 39% Two or more races 18% Asian 8% Black 4% Native American 1%
- Hispanic origin (detail)
- Mexican 32% Puerto Rican 2%
- Common ancestry
- Lithuanian 1% Slovak 1% Italian 1%
- Foreign-born
- 12% · Canada
- Languages at home
- 69% English-only · Spanish 23% Other Asian/Pacific 5% Russian/Polish/Slavic 1%
Political lean MEDSL · Yuba
- 2024 margin
- Strong R (+25.8) · D 35.7% · R 61.5% · Other 2.8%
- 2008→2024 swing
- -11.2pp toward R · 2008: -14.7pp · 2024: -25.8pp
- All cycles
- 2024: R+25.8 2020: R+21.6 2016: R+24.1 2012: R+19.5 2008: R+14.7
Not yet ingested
- Civics
- —
Market trends
- HPI YoY
- ▼ -87.37%
- Current HPI
- 222.3191
- Rent YoY
- —
- Metro
- Yuba City, CA
- State GDP YoY
- ▲ 3.21%
- F500 in state
- 116
Industry mix (Fortune 500 HQ in CA)
| Industry | F500 HQs | Revenue |
|---|---|---|
| Technology | 27 | $1,492B |
|
||
| Financial Services | 3 | $174B |
|
||
| Retail | 3 | $44B |
|
||
| Insurance | 3 | $26B |
|
||
| Media / Entertainment | 2 | $115B |
|
||
| Pharmaceuticals / Biotech | 2 | $62B |
|
||
Price history
-3.6% since first listed4 events — show timeline
- 2019-01-23 Sold (Public Records) $130,000 Public Records
- 2019-01-23 Sold (Public Records) $130,000 Public Records
- 2019-01-23 Sold (MLS) $130,000 CRMLS
- 2018-12-18 Listed $134,900 CRMLS
Property tax history
+21.9%/yrLatest (2025): $1,654 · +1.7% YoY. Source: county tax records.
Cash-flow waterfall
monthlySold comps — $/sqft
last 12 mo · ≤1 miLoading sold comps…