610 S Jade Dr · Prescott, AZ
Flood risk 1/10 · Minimal
- FEMA flood zone
- X (unshaded)
- Chance of flooding over 30 yrs
- 0.0%
- Est. flood insurance / yr
- $507 – $1,088
Fire risk 6/10 · Moderate
- Est. fire insurance / yr
- $610 – $1,132
Heat risk 3/10 · Minor
- Hot days now (above 89°F)
- 3 days/yr
- Hot days in 30 yrs
- 7 days/yr
Wind risk 1/10 · Minimal
- Chance of severe wind over 30 yrs
- —
Air-quality risk 2/10 · Minimal
- Unhealthy air days now
- 1 days/yr
- Unhealthy air days in 30 yrs
- 1 days/yr
Risk factors via First Street. Map © Google.
Why this score? — see what drove the C- grade
The composite is a weighted blend of 9 inputs, each scored 0–100. Each bar is that input's sub-score; the figure is the points it added to the 100-point composite (weight × sub-score).
- Cash flow +20.1/30.0
- ARV discount +7.5/15.0
- DSCR +6.4/10.0
- 1% rule +4.0/10.0
- Livability +3.7/5.0
- Schools +3.3/10.0
- Rent growth +2.6/5.0
- Condition / age +2.5/5.0
- Appreciation +0.0/10.0
$150,000
🖨 Deal sheet 📄 Offer letter ✓ Due diligence
Listing remarks
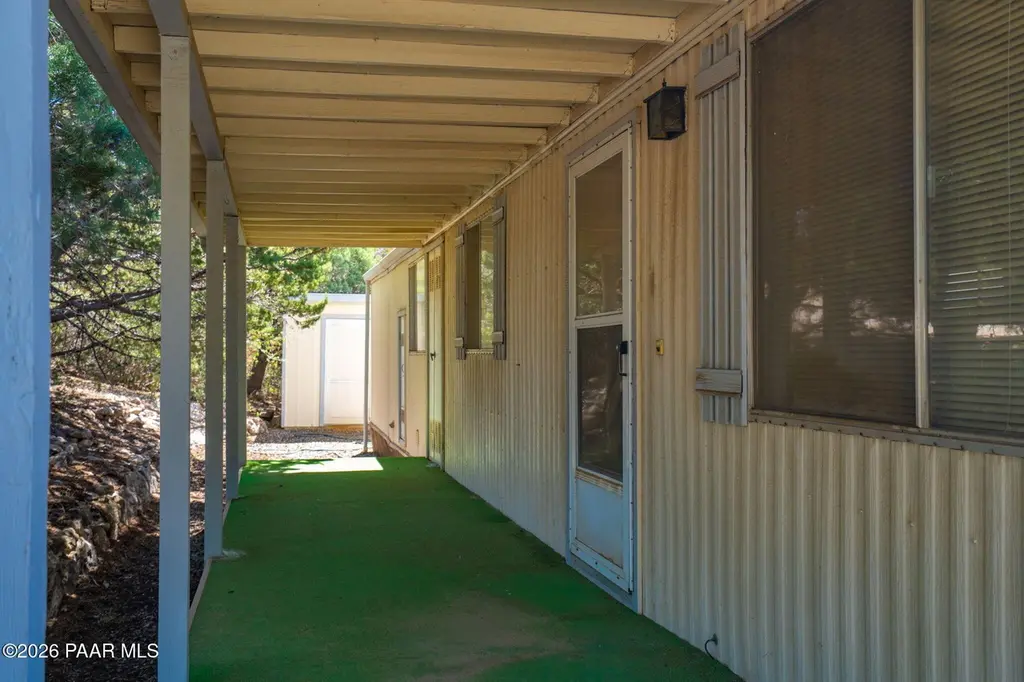
Opportunity awaits with this charming 1-bedroom, 1-bath single-wide home located just minutes from downtown. Featuring a detached 1-car garage and additional storage shed, this property offers plenty of potential for an investor, rental opportunity, or buyer looking for an affordable place to make their own. Conveniently located close to shopping, dining, and local amenities. Come add your personal touch and bring your vision to life. Don't miss this great investment opportunity!
Key facts
- 0.3 acre lot
- Garage
- Built 1978
Property features AI
Finance
- Other: Lot on gently sloped 0.3-acre parcel; Zoned R1-10; County-maintained dirt road frontage; Subdivision: Canyon Sights
- HOA & community: Not a senior community
Exterior
- Parking: Detached garage with 1 garage space; 1 parking space total
- Utilities: Public water; City sewer (WWT); Electricity available; Natural gas available
- Home design: Residential single-wide manufactured home; Single-story
- Construction: Frame construction; Rolled/hot mop roof; Piers foundation
- Exterior features: Covered patio/porch; Dirt driveway; Native landscaping/species; Drapes, blinds, and screens on windows; Single-pane windows
Interior
- Kitchen: Gas range; Refrigerator
- Bedrooms: Master bedroom on main level
- Flooring: Carpet
- Bathrooms: 1 full bathroom
- Heating & cooling: Forced gas heating; Evaporative cooling
- Interior features: Eat-in kitchen; Kitchen/dining combination; Laminate countertops; Pantry; Washer/dryer connection; Live on one level; Master bedroom on main level
- Laundry & utility: Washer/dryer connection; Natural gas water heater
Neighborhood map
What this means for you Summary
Snapshot
- This is a 1-bed/1.0-bath manufactured listed at $150k.
Deal economics
- At list price, monthly cash flow is $186 ($2k/yr) — positive.
- The deal already cash-flows at list — no discount required.
- To meet the 1% rule (rent ≥ 1% of price), the offer needs to be $136k (9.7% below list).
- Recommended offer: $136k (9.7% below list) — sets the bar for 1% rule.
- Cap rate 7.8% vs local median 2.4% in Prescott — top-decile yield for the area; either an underpriced asset or a hidden risk that comps aren't pricing in. Stress-test before assuming the spread holds.
Location & tenants
- Location reads 73/100 on livability (#22 in AZ) — a middle-class / working-renter tenant base. Strengths: health & safety A+, amenities A, schools A-; Watch: cost of living D, commute F.
- Prescott Unified District (4466) (urban): math 34% / reading 44% proficiency, ranked #70 of 249 in AZ (top 28%) — families likely to look elsewhere, expect single-tenant / working-renter base with shorter leases.
- Market conditions: Rents flat; 516 active listings in the ZIP; 5 comparable units currently listed for rent nearby; rentals lingering (median 44d on market — plan ~5-8 weeks vacancy on turnover, expect pricing pressure); 80% of comp listings sitting > 30 days — soft ceiling on asking rent; 2,062 units permitted in Yavapai County in 2024 (98 in 5+ unit buildings).
Forward outlook
- Local home prices are declining (-3.0%/yr); year-one equity from $1k of loan paydown is wiped out by about $4k of value loss. Plan a longer hold.
- Yavapai County population projected at +10% by 2050 — modest demand growth; plan on rents tracking national, not racing it.
Negotiation context
- It's been on market 15 days — a 2% lower offer ($148k) is reasonable based on typical stale-listing flexibility.
- Current owner paid $7k; list at $150k implies a 1927% gain — meaningful room to come down on a strong offer.
Risks & watch-outs
- Climate carrying-cost: major wildfire risk — expect insurance premiums to compound above CPI over the hold.
Questions for the listing agent
- Built in 1978 — when were the roof, HVAC, electrical panel, plumbing, and water heater last replaced?
- Is there a deadline driving the sale (1031 exchange, divorce, estate, relocation)? That informs how much negotiation room exists.
- Schools are A-rated — typically a magnet for longer-tenancy family renters. What's the average tenant stay here, and is there a school-zone premium baked into asking?
- What's the average days-on-market for RENTAL listings here right now (not sales)? A rising rental-DOM trend means longer vacancies and softer asking-rent achievability than the comps imply.
- What's the recent tenant-quality profile in this submarket — average credit score on applications, eviction rate, late-payment / NSF rate, and stable-employment percentage? A property-management company in the area should have these aggregated.
- How much new for-sale + rental construction is in the pipeline within 1–3 miles? Heavy new supply typically softens prices + rents 12–24 months out; constrained supply supports both.
Investment metrics
- 1% rule
- 0.90% ✗
- Cap rate
- 7.78%
- Cash-on-cash
- 5.32%
- DSCR
- 1.24
- GRM
- 9.2
CMA / ARV
No comps found within radius.
Projected returns pro-forma
-3.0% appreciation · 0.51% rent growth · sell at horizon
- IRR
- -10.6%
- Equity multiple
- 0.62×
- Total profit
- $-15,827
- Equity at exit
- $22,365
- IRR
- -4.7%
- Equity multiple
- 0.72×
- Total profit
- $-11,733
- Equity at exit
- $12,969
Cash invested: $42,000 (down + closing). Projections, not guarantees.
Landlord ↔ Tenant lean methodology
- Overall (STATE)
- 87 Strongly Landlord-Friendly
- State Arizona
- 87 Strongly Landlord-Friendly · R+3
- County
- — inherits STATE
- City
- — inherits STATE
ZIP-level market 86303
- Home prices YoY
- -28.9%
- Rents YoY
- 0.5%
- Active inventory
- 516
- Price-to-rent
- 9.2×
Monthly cashflow live
- Estimated rent
- $1,355 high interval (Pro) →
- Mortgage (P&I)
- −$787
- Tax from tax record
- −$35 /mo · $421/yr
- Insurance
- −$62
- HOA
- −$0
- Vacancy / Maint / Mgmt
- −$285
- Net cashflow
- $186
Break-even live
UW: 25.0% down · 7.5% · 30yr · 1.5% tax · 5.0% vac · 8.0% maint · 8.0% mgmt
Financing live
Cash to close
- Down payment
- $37,500
- Closing costs
- $4,500
- Reserves months
- —
- Total cash needed
- —
Loan-product check · same deal, 3 products live
Conventional
25% down · 7.5% · 30yr
- Down + closing
- —
- Monthly P&I
- —
- Monthly cashflow
- —
- DSCR
- —
- Eligible?
- —
Personal DTI + credit; lowest rate.
DSCR
20% down · 8.5% · 30yr
- Down + closing
- —
- Monthly P&I
- —
- Monthly cashflow
- —
- DSCR
- —
- Eligible?
- —
No personal income docs; deal must DSCR.
Hard money
10% down · 12.0% · 12mo
- Down + closing
- —
- Monthly P&I
- —
- Monthly cashflow
- —
- DSCR
- —
- Eligible?
- —
Short-term bridge; refi at stabilization.
Rent comps 5 comps
| Address | Beds | Baths | Sqft | Rent | $/sqft | DOM | Units | Dist |
|---|---|---|---|---|---|---|---|---|
| 135 S Arizona Ave Unit 1/2 Prescott, AZ | 1.0 | 1.0 | 550 | $1,600 | $2.91 | 43d | 1 | 1.05mi |
| 314 S Virginia St #2 Prescott, AZ | 1.0 | 1.0 | 700 | $950 | $1.36 | 43d | 1 | 1.21mi |
| 606 E Willis St Prescott, AZ | 1.0 | 1.0 | 604 | $1,225 | $2.03 | 21d | 1 | 1.24mi |
| 403 S Pleasant St Prescott, AZ | 1.0 | 1.0 | 750 | $1,475 | $1.97 | 43d | 1 | 1.34mi |
| 109 N Pleasant St Unit C Prescott, AZ | 1.0 | 1.0 | 750 | $1,395 | $1.86 | 43d | 1 | 1.36mi |
Listing history 12 events
-
2026-06-16status $150,000 Pending 15 DOM
-
2026-06-16days on market $150,000 Active Under Contract 15 DOM
-
2026-06-15days on market $150,000 Active Under Contract 14 DOM
-
2026-06-14days on market $150,000 Active Under Contract 12 DOM
-
2026-06-13days on market $150,000 Active Under Contract 11 DOM
-
2026-06-10days on market $150,000 Active Under Contract 9 DOM
-
2026-06-09days on market $150,000 Active Under Contract 8 DOM
-
2026-06-08days on market $150,000 Active Under Contract 7 DOM
-
2026-06-07days on market $150,000 Active Under Contract 6 DOM
-
2026-06-05statusdays on market $150,000 Active Under Contract 3 DOM
-
2026-06-02remarks 484-char remark
-
2026-06-02$150,000 Active 1 DOM
ⓘ Source: listings_history table (triggers on properties + properties_extension) + one-shot
backfill from property_details.listing_events for pre-trigger history.
Tax reassessment forecast AZ · Resets to sale price
- Current annual tax
- $421 · $35/mo
- Projected year-2 tax
- $990 · $82/mo
- Expected delta
- +$569/yr (+$47/mo · 135.4%)
ⓘ Screening estimate from a state-policy table — verify with the county assessor before closing.
Climate risk First Street
- Flood 1/10 Low FEMA zone X (unshaded) · 0% chance over 30 yrs
- Wildfire 6/10 Major
- Heat 3/10 Moderate 3 d/yr ≥89°F today · 7 d/yr by 30 yrs out
- Wind 1/10 Low
- Air quality 2/10 Low 1 unhealthy d/yr today · 1 by 30 yrs out
Nearby sold comps map
Loading sold comps map…
Walkable amenities ~0.75 mi
Loading nearby amenities…
Taxation est. · year 1
- Rental income
- $16,260
- − Mortgage interest
- −$8,402
- − Property taxes
- −$421
- − Insurance
- −$750
- − Repairs & maintenance
- −$1,301
- − Management
- −$1,301
- − Depreciation
- −$4,364
- Taxable loss
- −$278
- Est. tax savings @ 24.0%
- +$67
- After-tax cash flow
- $2,302/yr
For passive investors: Depreciation is non-cash, so a rental often shows a tax loss while cash-flowing — sheltering income. Rental losses are passive: they offset passive income freely, and up to $25,000/yr can offset ordinary (W-2) income if you actively participate and your MAGI is under $100k (phasing out to $0 by $150k); unused losses carry forward. On sale, claimed depreciation is recaptured at up to 25%, and gains may owe capital-gains tax (a 1031 exchange can defer both). Figures are a year-1 estimate at your 24.0% rate — not tax advice; consult a CPA.
Schools (NCES district)
- District
- Prescott Unified District (4466)
- NCES district ID
- 0406730
- Math proficiency
- 34% ▼ -16.00%
- Reading proficiency
- 44% ▼ -13.00%
- Median HH income
- $48,354
- Composite
- 33.47/100
- National rank
- #5450
- State rank
- #70 of 249 in AZ
Livability — Prescott
- Score
- 73/100
- State rank
- #22
- US rank
- #5579
Category grades
Schools grade is shown separately in the Schools card above.
Census & demographics
- County
- Yavapai County · 190,406 people
- City population
- 66,312
- Metro
- Prescott Valley-Prescott, AZ
- Population (ZIP)
- 19,446
- Household income
- $72,359
- Rent vs Own
- Severe rent burden
- 763.0
Population outlook (Yavapai County) Hauer SSP2
- Today (2025)
- 241,389 people
- By 2030
- 249,523 · +3.4%
- By 2040
- 259,966 · +7.7%
- By 2050
- 264,736 · +9.7%
- By 2075
- 269,334 · +11.6%
- By 2100
- 256,505 · +6.3%
Race, ethnicity, and origin ACS 2023
- Neighborhood character
- Predominantly White (84%)
- Race & ethnicity
- White 84% Hispanic / Latino 11% Two or more races 6%
- Hispanic origin (detail)
- Mexican 9%
- Common ancestry
- Romanian 5% Lithuanian 4% Slovak 3%
- Foreign-born
- 4% · Canada
- Languages at home
- 94% English-only · Spanish 4% Other Indo-European 1%
Political lean MEDSL · Yavapai
- 2024 margin
- Solid R (+33.9) · D 32.6% · R 66.5%
- 2008→2024 swing
- -9.5pp toward R · 2008: -24.4pp · 2024: -33.9pp
- All cycles
- 2024: R+33.9 2020: R+29.3 2016: R+31.4 2012: R+30.7 2008: R+24.4
Not yet ingested
- Civics
- —
Market trends
- HPI YoY
- ▼ -131.63%
- Current HPI
- 323.9554
- Rent YoY
- ▲ 0.51%
- Metro
- Prescott Valley-Prescott, AZ
- State GDP YoY
- ▲ 4.54%
- F500 in state
- 20
Industry mix (Fortune 500 HQ in AZ)
| Industry | F500 HQs | Revenue |
|---|---|---|
| Technology | 2 | $13B |
|
||
| Mining / Metals | 1 | $23B |
|
||
| Environmental Services | 1 | $16B |
|
||
| Metals / Steel | 1 | $14B |
|
||
| Technology Distribution | 1 | $9B |
|
||
| Homebuilding | 1 | $8B |
|
||
Price history
+1927.0% since first listed2 events — show timeline
- 2026-06-01 Listed $150,000 PAARMLS as Distributed by MLS Grid
- 1985-09-13 Sold (Public Records) $7,400 Public Records
Property tax history
+4.1%/yrLatest (2025): $421 · +20.5% YoY. Source: county tax records.
Cash-flow waterfall
monthlySold comps — $/sqft
last 12 mo · ≤1 miLoading sold comps…