16789 SW 62nd St · Rainbow Springs, FL
Flood risk 1/10 · Minimal
- FEMA flood zone
- X (unshaded)
- Chance of flooding over 30 yrs
- 0.0%
- Est. flood insurance / yr
- $507 – $1,088
Fire risk 5/10 · Moderate
- Est. fire insurance / yr
- $947 – $1,759
Heat risk 8/10 · Major
- Hot days now (above 107°F)
- 7 days/yr
- Hot days in 30 yrs
- 22 days/yr
Wind risk 9/10 · Severe
- Chance of severe wind over 30 yrs
- 99.0%
Air-quality risk 2/10 · Minimal
- Unhealthy air days now
- 0 days/yr
- Unhealthy air days in 30 yrs
- 2 days/yr
Risk factors via First Street. Map © Google.
Why this score? — see what drove the D+ grade
The composite is a weighted blend of 9 inputs, each scored 0–100. Each bar is that input's sub-score; the figure is the points it added to the 100-point composite (weight × sub-score).
- Cash flow +17.7/30.0
- ARV discount +7.5/15.0
- DSCR +5.5/10.0
- 1% rule +4.8/10.0
- Schools +3.6/10.0
- Rent growth +2.5/5.0
- Livability +2.5/5.0
- Condition / age +2.5/5.0
- Appreciation +0.0/10.0
$237,500
🖨 Deal sheet 📄 Offer letter ✓ Due diligence
Listing remarks
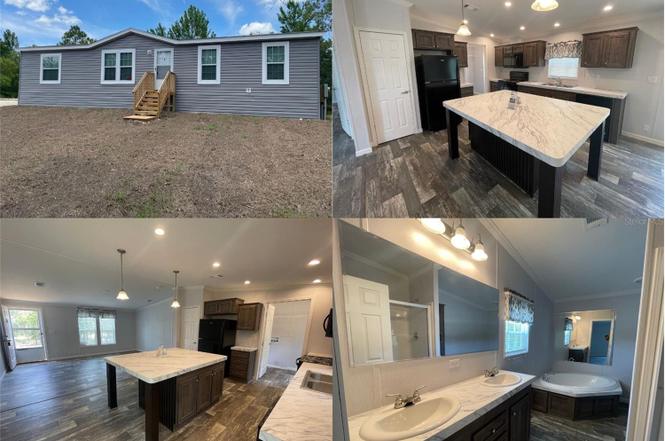
Welcome Home! Ready for immediate occupancy. Priced to sell! Seller offering $5,000 in closing cost assistance. FHA, VA and USDA Eligible. No lot rent, HOA or deed restrictions. This new construction 4 bedroom 2 bathroom home is situated on a serene 1+ acre parcel. Zoned Agricultural. The 7 YEAR Home Warranty gives you peace of mind as it covers the structure, roof, plumbing, electric, HVAC and appliances. This home features a traditional split bedroom plan with an open concept kitchen/living area with so many great features and tons of storage space! Upon entry, you are greeted by a spacious living area with high ceilings. The kitchen is perfect for entertaining featuring a large island an
Key facts
- Open concept kitchen
- New construction
- 7 year home warranty
Tags
Property features AI
Finance
- Other: Home warranty available
- Financial info: No lease restrictions
- HOA & community: No HOA association; Pets allowed
Exterior
- Parking: Parking pad
- Security: Smoke detectors
- Utilities: Private well water; Septic tank; Broadband/high-speed internet available; Cable available; Electricity connected; Phone available; Underground utilities; Water connected
- Home design: Manufactured double-wide home; Single-story; South-facing; Completed condition; One living level; Entry on main level
- Construction: Vinyl siding with frame construction; Shingle roof; Pillar/post/pier foundation; New construction
- Exterior features: Outdoor lighting; Oak trees and landscaped trees on property; Private, oversized lot; Unpaved surfaces; Limerock road access; Zoned for horses; In-county, unincorporated location
Interior
- Kitchen: Dishwasher; Range; Microwave; Refrigerator; Ice maker; Exhaust fan; Electric water heater
- Bedrooms: 4 bedrooms
- Flooring: Vinyl flooring
- Bathrooms: 2 full bathrooms
- Heating & cooling: Central heating (electric); Central air conditioning
- Interior features: Crown molding; Eat-in kitchen; High ceilings; Open floorplan; Split bedroom layout; Thermostat; Walk-in closets; Window treatments; Blinds; Double-pane windows
- Laundry & utility: Inside laundry room; Washer hookup; Electric dryer hookup; Inside utility room
Neighborhood map
What this means for you Summary
Snapshot
- This is a 3-bed/2.0-bath manufactured listed at $238k.
Deal economics
- At list price, monthly cash flow is $190 ($2k/yr) — positive.
- The deal already cash-flows at list — no discount required.
- To meet the 1% rule (rent ≥ 1% of price), the offer needs to be $232k (2.4% below list).
- Recommended offer: $216k (9.0% below list) — sets the bar for market timing.
- Cap rate 7.3% vs local median 3.7% in Rainbow Springs — top-decile yield for the area; either an underpriced asset or a hidden risk that comps aren't pricing in. Stress-test before assuming the spread holds.
Location & tenants
- Location reads: area grade D — affects rentability + tenant quality, not the cash-flow math above.
- Marion (rural): math 42% / reading 43% proficiency, ranked #61 of 73 in FL (top 84%) — families likely to look elsewhere, expect single-tenant / working-renter base with shorter leases; 61% free/reduced lunch — lower-income household profile, screen leases tightly.
- Market conditions: 1151 active listings in the ZIP; 4 comparable units currently listed for rent nearby; rentals at typical pace (median 21d on market — plan ~3-4 weeks tenant-placement turnaround); 7,071 units permitted in Marion County in 2024 (534 in 5+ unit buildings).
- At $2,319/mo this rent would consume 49% of the median local household income ($57k/yr) (locally 313% of renters already pay >50% of income on rent) — very limited rent-growth headroom before tenants either downsize or default.
Forward outlook
- Local home prices are declining (-3.0%/yr); year-one equity from $2k of loan paydown is wiped out by about $7k of value loss. Plan a longer hold.
- Marion County population projected at +13% by 2050 — modest demand growth; plan on rents tracking national, not racing it.
Negotiation context
- It's been on market 117 days — a 9% lower offer ($216k) is reasonable based on typical stale-listing flexibility.
- 2 sale attempts with the ask held roughly flat each time — persistent listings suggest the price (not the market) is what's stuck; bring a comps-based counter.
Risks & watch-outs
- Climate carrying-cost: severe wind risk, 99% chance of damaging wind over 30y; moderate wildfire risk; extreme-heat days projected 7→22/yr by 2055 (HVAC capex compounding) — expect insurance premiums to compound above CPI over the hold.
Questions for the listing agent
- It's been on market 117 days. Have you received any prior offers? Is the seller open to a 9% concession, seller financing, or rate buy-down credit?
- Why hasn't it sold? Are there any deal-killer items the seller is aware of (foundation, flood, title, zoning, code violations)?
- Is there a deadline driving the sale (1031 exchange, divorce, estate, relocation)? That informs how much negotiation room exists.
- The area grade is low — what's the realistic commute time and amenity access for the typical tenant pool here? Any planned neighborhood developments (good or bad) we should know about?
- What's the average days-on-market for RENTAL listings here right now (not sales)? A rising rental-DOM trend means longer vacancies and softer asking-rent achievability than the comps imply.
- What's the recent tenant-quality profile in this submarket — average credit score on applications, eviction rate, late-payment / NSF rate, and stable-employment percentage? A property-management company in the area should have these aggregated.
- How much new for-sale + rental construction is in the pipeline within 1–3 miles? Heavy new supply typically softens prices + rents 12–24 months out; constrained supply supports both.
Investment metrics
- 1% rule
- 0.98% ✗
- Cap rate
- 7.25%
- Cash-on-cash
- 3.44%
- DSCR
- 1.15
- GRM
- 8.5
CMA / ARV
No comps found within radius.
Projected returns pro-forma
-3.0% appreciation · 3.0% rent growth · sell at horizon
- IRR
- -10.9%
- Equity multiple
- 0.60×
- Total profit
- $-26,326
- Equity at exit
- $35,412
- IRR
- -1.6%
- Equity multiple
- 0.89×
- Total profit
- $-7,169
- Equity at exit
- $20,535
Cash invested: $66,500 (down + closing). Projections, not guarantees.
Landlord ↔ Tenant lean methodology
- Overall (STATE)
- 87 Strongly Landlord-Friendly
- State Florida
- 87 Strongly Landlord-Friendly · R+3
- County
- — inherits STATE
- City
- — inherits STATE
ZIP-level market 34481
- Home prices YoY
- -25.2%
- Active inventory
- 1151
- Price-to-rent
- 8.5×
Monthly cashflow live
- Estimated rent
- $2,319 medium interval (Pro) →
- Mortgage (P&I)
- −$1,245
- Tax est. 1.5%
- −$297 /mo · $3,562/yr
- Insurance
- −$99
- HOA
- −$0
- Vacancy / Maint / Mgmt
- −$487
- Net cashflow
- $190
Break-even live
UW: 25.0% down · 7.5% · 30yr · 1.5% tax · 5.0% vac · 8.0% maint · 8.0% mgmt
Financing live
Cash to close
- Down payment
- $59,375
- Closing costs
- $7,125
- Reserves months
- —
- Total cash needed
- —
Loan-product check · same deal, 3 products live
Conventional
25% down · 7.5% · 30yr
- Down + closing
- —
- Monthly P&I
- —
- Monthly cashflow
- —
- DSCR
- —
- Eligible?
- —
Personal DTI + credit; lowest rate.
DSCR
20% down · 8.5% · 30yr
- Down + closing
- —
- Monthly P&I
- —
- Monthly cashflow
- —
- DSCR
- —
- Eligible?
- —
No personal income docs; deal must DSCR.
Hard money
10% down · 12.0% · 12mo
- Down + closing
- —
- Monthly P&I
- —
- Monthly cashflow
- —
- DSCR
- —
- Eligible?
- —
Short-term bridge; refi at stabilization.
Rent comps 4 comps
| Address | Beds | Baths | Sqft | Rent | $/sqft | DOM | Units | Dist |
|---|---|---|---|---|---|---|---|---|
| 3699 SW 169th Ct Ocala, FL | 4.0 | 2.0 | 1799 | $2,100 | $1.17 | 21d | 1 | 0.35mi |
| 4738 SW 166th Court Rd Ocala, FL | 3.0 | 2.0 | 1782 | $1,600 | $0.90 | 13d | 1 | 1.03mi |
| 6944 SW 179th Court Rd Dunnellon, FL | 3.0 | 2.0 | 1474 | $3,300 | $2.24 | 13d | 1 | 1.27mi |
| 4486 SW 159th Ct Ocala, FL | 3.0 | 1.0 | 1149 | $2,500 | $2.18 | 21d | 1 | 1.50mi |
Listing history 7 events
-
2026-05-07status Pending
-
2026-03-25price $237,500
-
2026-02-27price $239,000
-
2026-01-10$239,900 Active
-
2025-12-03historical
-
2025-10-29price $239,900
-
2025-09-05$249,900 Active
ⓘ Source: listings_history table (triggers on properties + properties_extension) + one-shot
backfill from property_details.listing_events for pre-trigger history.
Climate risk First Street
- Flood 1/10 Low FEMA zone X (unshaded) · 0% chance over 30 yrs
- Wildfire 5/10 Major
- Heat 8/10 Severe 7 d/yr ≥107°F today · 22 d/yr by 30 yrs out
- Wind 9/10 Extreme 99% chance of damaging wind over 30 yrs
- Air quality 2/10 Low 0 unhealthy d/yr today · 2 by 30 yrs out
Nearby sold comps map
Loading sold comps map…
Walkable amenities ~0.75 mi
Loading nearby amenities…
Taxation est. · year 1
- Rental income
- $27,823
- − Mortgage interest
- −$13,304
- − Property taxes
- −$3,562
- − Insurance
- −$1,188
- − Repairs & maintenance
- −$2,226
- − Management
- −$2,226
- − Depreciation
- −$6,909
- Taxable loss
- −$1,591
- Est. tax savings @ 24.0%
- +$382
- After-tax cash flow
- $2,666/yr
For passive investors: Depreciation is non-cash, so a rental often shows a tax loss while cash-flowing — sheltering income. Rental losses are passive: they offset passive income freely, and up to $25,000/yr can offset ordinary (W-2) income if you actively participate and your MAGI is under $100k (phasing out to $0 by $150k); unused losses carry forward. On sale, claimed depreciation is recaptured at up to 25%, and gains may owe capital-gains tax (a 1031 exchange can defer both). Figures are a year-1 estimate at your 24.0% rate — not tax advice; consult a CPA.
Schools (NCES district)
- District
- Marion
- NCES district ID
- 1201260
- Math proficiency
- 42% ▼ -7.00%
- Reading proficiency
- 43% ▼ -4.00%
- Median HH income
- $40,015
- Composite
- 35.61/100
- National rank
- #4890
- State rank
- #61 of 73 in FL
Livability — Rainbow Springs
No livability data for this city. (Only ~50 U.S. cities are tracked.)
Census & demographics
- County
- Marion County · 315,796 people
- Metro
- Ocala, FL
- Population (ZIP)
- 26,782
- Household income
- $57,324
- Rent vs Own
- Severe rent burden
- 313.0
Population outlook (Marion County) Hauer SSP2
- Today (2025)
- 365,905 people
- By 2030
- 376,768 · +3.0%
- By 2040
- 396,555 · +8.4%
- By 2050
- 412,723 · +12.8%
- By 2075
- 446,090 · +21.9%
- By 2100
- 436,193 · +19.2%
Race, ethnicity, and origin ACS 2023
- Neighborhood character
- Predominantly White (80%)
- Race & ethnicity
- White 80% Hispanic / Latino 11% Black 7% Two or more races 5%
- Hispanic origin (detail)
- Mexican 4% Puerto Rican 4% Cuban 1%
- Common ancestry
- Romanian 7% Lithuanian 3% Slovak 2%
- Foreign-born
- 8% · Canada, Jamaica
- Languages at home
- 88% English-only · Spanish 9% French/Haitian/Cajun 1% German/W. Germanic 1%
Political lean MEDSL · Marion
- 2024 margin
- Solid R (+31.6) · D 33.8% · R 65.5%
- 2008→2024 swing
- -20.0pp toward R · 2008: -11.6pp · 2024: -31.6pp
- All cycles
- 2024: R+31.6 2020: R+25.9 2016: R+26.2 2012: R+16.2 2008: R+11.6
Not yet ingested
- Civics
- —
Market trends
- HPI YoY
- ▼ -67.48%
- Current HPI
- 199.986
- Rent YoY
- —
- Metro
- Ocala, FL
- State GDP YoY
- ▲ 3.28%
- F500 in state
- 36
Industry mix (Fortune 500 HQ in FL)
| Industry | F500 HQs | Revenue |
|---|---|---|
| Industrial Technology | 2 | $29B |
|
||
| Insurance | 2 | $17B |
|
||
| Retail | 1 | $60B |
|
||
| Technology Distribution | 1 | $58B |
|
||
| Homebuilding | 1 | $35B |
|
||
| Technology Manufacturing | 1 | $35B |
|
||
Price history
-5.0% since first listed7 events — show timeline
- 2026-05-07 Pending — Stellar MLS as Distributed by MLS Grid
- 2026-03-25 Price Changed $237,500 Stellar MLS as Distributed by MLS Grid
- 2026-02-27 Price Changed $239,000 Stellar MLS as Distributed by MLS Grid
- 2026-01-10 Listed $239,900 Stellar MLS as Distributed by MLS Grid
- 2025-12-03 Listing Removed — Stellar MLS as Distributed by MLS Grid
- 2025-10-29 Price Changed $239,900 Stellar MLS as Distributed by MLS Grid
- 2025-09-05 Listed $249,900 Stellar MLS as Distributed by MLS Grid
Property tax history
+11.0%/yrLatest (2025): $277 · +5.7% YoY. Source: county tax records.
Cash-flow waterfall
monthlySold comps — $/sqft
last 12 mo · ≤1 miLoading sold comps…