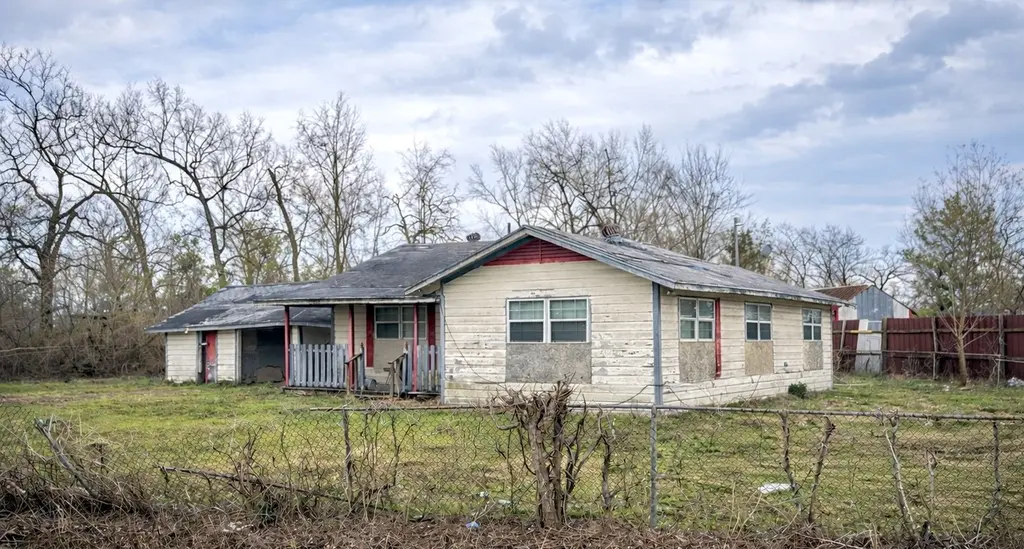
8614 Fringewood Dr · Houston, TX
Flood risk 1/10 · Minimal
- FEMA flood zone
- X (unshaded)
- Chance of flooding over 30 yrs
- 0.0%
- Est. flood insurance / yr
- $507 – $1,088
Fire risk 4/10 · Minor
- Est. fire insurance / yr
- $1,222 – $2,270
Heat risk 9/10 · Severe
- Hot days now (above 110°F)
- 7 days/yr
- Hot days in 30 yrs
- 24 days/yr
Wind risk 9/10 · Severe
- Chance of severe wind over 30 yrs
- 99.0%
Air-quality risk 3/10 · Minor
- Unhealthy air days now
- 2 days/yr
- Unhealthy air days in 30 yrs
- 3 days/yr
Risk factors via First Street. Map © Google.
Why this score? — see what drove the B+ grade
The composite is a weighted blend of 9 inputs, each scored 0–100. Each bar is that input's sub-score; the figure is the points it added to the 100-point composite (weight × sub-score).
- Cash flow +30.0/30.0
- 1% rule +10.0/10.0
- DSCR +10.0/10.0
- Appreciation +7.6/10.0
- ARV discount +7.5/15.0
- Livability +3.7/5.0
- Schools +2.7/10.0
- Condition / age +2.5/5.0
- Rent growth +2.1/5.0
$75,000
🖨 Deal sheet 📄 Offer letter ✓ Due diligence
Listing remarks MLS
Investor/development opportunity! 8614 Fringewood Dr in NE Houston near Tidwell Rd & Mesa Dr needs TLC and/or may be a candidate for a rehab, perfect for builders or investors looking to add value. Buyer is responsible for all due diligence. Please exercise caution when touring. Conveniently located with easy access to the 610 North Loop.
Key facts
- Near tidwell rd
- Near mesa dr
- 7,200 sq ft lot
Tags
Neighborhood map
What this means for you Summary
Snapshot
- This is a 3-bed/1.0-bath single-family listed at $75k.
Deal economics
- At list price, monthly cash flow is $787 ($9k/yr) — positive.
- The deal already cash-flows at list — no discount required.
- Meets the 1% rule at list price ($2k rent vs $75k).
- Recommended offer: $74k (1.5% below list) — sets the bar for market timing.
- Cap rate 18.9% vs local median 3.2% in Houston — top-decile yield for the area; either an underpriced asset or a hidden risk that comps aren't pricing in. Stress-test before assuming the spread holds.
Location & tenants
- Location reads 74/100 on livability (#184 in TX, #4,771 nationally) — a middle-class / working-renter tenant base. Strengths: amenities A+, cost of living A+, housing A+; Watch: schools D, crime F.
- Houston ISD (urban): math 27% / reading 35% proficiency, ranked #593 of 826 in TX (top 72%) — families likely to look elsewhere, expect single-tenant / working-renter base with shorter leases; 71% free/reduced lunch — lower-income household profile, screen leases tightly.
- Market conditions: Rents soft (-1.6%/yr); 353 active listings in the ZIP; 40 comparable units currently listed for rent nearby; rentals lingering (median 44d on market — plan ~5-8 weeks vacancy on turnover, expect pricing pressure); 50% of comp listings sitting > 30 days — soft ceiling on asking rent; lower-income renter base — watch delinquency; 29,883 units permitted in Harris County in 2024 (8,621 in 5+ unit buildings).
- At $1,764/mo this rent would consume 55% of the median local household income ($38k/yr) (locally 1177% of renters already pay >50% of income on rent) — very limited rent-growth headroom before tenants either downsize or default.
Forward outlook
- In year one you build about $4k of equity ($519 loan paydown + $4k appreciation (5.2% local appreciation)).
- Harris County population projected at +47% by 2050 — long-run rental-demand tailwind backs the buy-and-hold thesis.
- At projected returns (5.2% appreciation + 0.0% rent growth), your $21k cash investment doubles in ~2 years — after that, you're playing with house money.
- By year 8, paydown + projected appreciation supports a ~$34k cash-out refi (75% LTV) — recoverable capital for the next deal without selling this one.
Negotiation context
- It's been on market 29 days — a 2% lower offer ($74k) is reasonable based on typical stale-listing flexibility.
Risks & watch-outs
- Watch-outs: property tax is 2.9% of price; built in 1950 — expect roof / HVAC / electrical / plumbing capex.
- Climate carrying-cost: severe wind risk, 99% chance of damaging wind over 30y; extreme-heat days projected 7→24/yr by 2055 (HVAC capex compounding) — expect insurance premiums to compound above CPI over the hold.
Questions for the listing agent
- Built in 1950 — when were the roof, HVAC, electrical panel, plumbing, and water heater last replaced?
- Property tax is high relative to price — has the assessment been appealed recently, and will the sale trigger a re-assessment?
- Is there a deadline driving the sale (1031 exchange, divorce, estate, relocation)? That informs how much negotiation room exists.
- Schools are D-rated, which usually means shorter tenancies and higher turnover. Who's the typical renter profile here, and what's been the actual vacancy rate?
- Crime grade is F in this area — have there been break-ins, vandalism, or insurance claims at this property in the last 3 years? What carrier currently insures it and at what premium?
- What's the average days-on-market for RENTAL listings here right now (not sales)? A rising rental-DOM trend means longer vacancies and softer asking-rent achievability than the comps imply.
- What's the recent tenant-quality profile in this submarket — average credit score on applications, eviction rate, late-payment / NSF rate, and stable-employment percentage? A property-management company in the area should have these aggregated.
- How much new for-sale + rental construction is in the pipeline within 1–3 miles? Heavy new supply typically softens prices + rents 12–24 months out; constrained supply supports both.
Investment metrics
- 1% rule
- 2.35% ✓
- Cap rate
- 18.89%
- Cash-on-cash
- 44.97%
- DSCR
- 3.00
- GRM
- 3.5
CMA / ARV
- ARV (median comp)
- $179,041
- List price
- $75,000
- Delta
- -58.11%
- Verdict
- UNDERPRICED
- Comps
- 20 within 1.0 mi
Show comp detail 12 sales within ~0.75 mi
| Address | Dist | Beds/Ba | Sqft | Sold | Price | $/sf | Match |
|---|---|---|---|---|---|---|---|
| 8702 Rinn St | 0.37mi | 3/2.0 | 1,358 (+2%) | 1mo | $189,900 | $140 | 74 |
| 8410 Rinn St | 0.46mi | 3/2.0 | 1,354 (+2%) | 4mo | $169,900 | $125 | 68 |
| 9606 Guest St | 0.40mi | 3/2.0 | 1,383 (+4%) | 4mo | $230,000 | $166 | 67 |
| 8901 Woodlyn Rd | 0.44mi | 3/1.0 | 1,228 (-8%) | 2mo | $155,000 | $126 | 66 |
| 8913 Linda Vista Rd | 0.59mi | 3/1.0 | 1,266 (-5%) | 4mo | $175,000 | $138 | 62 |
| 8414 Rinn St | 0.45mi | 4/1.5 (+1) | 1,253 (-6%) | 2mo | $190,000 | $152 | 61 |
| 8814 Shady Vista Ln Ln | 0.35mi | 3/2.0 | 1,206 (-9%) | 6mo | $188,800 | $157 | 59 |
| 9415 Balsam Ln | 0.60mi | 4/1.0 (+1) | 1,308 (-2%) | 8mo | $150,000 | $115 | 57 |
| 9011 Parkette Dr | 0.49mi | 3/1.0 | 1,226 (-8%) | 9mo | $135,000 | $110 | 57 |
| 8404 Shady Vista Cir | 0.42mi | 3/2.0 | 1,180 (-11%) | 8mo | $192,500 | $163 | 52 |
| 8407 Shady Vista Ct | 0.44mi | 3/2.0 | 1,180 (-11%) | 10mo | $195,990 | $166 | 49 |
| 8442 Sterlingshire St | 0.69mi | 3/2.0 | 1,452 (+9%) | 8mo | $140,000 | $96 | 41 |
Match score weights: distance 35% · size 25% · config 20% · recency 20%. Top-matched comps best support the ARV.
Projected returns pro-forma
5.25% appreciation · 0.0% rent growth · sell at horizon
- IRR
- 50.6%
- Equity multiple
- 4.02×
- Total profit
- $63,376
- Equity at exit
- $43,622
- IRR
- 46.7%
- Equity multiple
- 7.62×
- Total profit
- $139,085
- Equity at exit
- $76,229
Cash invested: $21,000 (down + closing). Projections, not guarantees.
Landlord ↔ Tenant lean methodology
- Overall (STATE)
- 87 Strongly Landlord-Friendly
- State Texas
- 87 Strongly Landlord-Friendly · R+5
- County
- — inherits STATE
- City
- — inherits STATE
ZIP-level market 77028
- Home prices YoY
- 2.0%
- Rents YoY
- -1.6%
- Active inventory
- 353
- Price-to-rent
- 3.5×
Monthly cashflow live
- Estimated rent
- $1,764 high interval (Pro) →
- Mortgage (P&I)
- −$393
- Tax from tax record
- −$182 /mo · $2,188/yr
- Insurance
- −$31
- HOA
- −$0
- Vacancy / Maint / Mgmt
- −$371
- Net cashflow
- $787
Break-even live
UW: 25.0% down · 7.5% · 30yr · 1.5% tax · 5.0% vac · 8.0% maint · 8.0% mgmt
Financing live
Cash to close
- Down payment
- $18,750
- Closing costs
- $2,250
- Reserves months
- —
- Total cash needed
- —
Loan-product check · same deal, 3 products live
Conventional
25% down · 7.5% · 30yr
- Down + closing
- —
- Monthly P&I
- —
- Monthly cashflow
- —
- DSCR
- —
- Eligible?
- —
Personal DTI + credit; lowest rate.
DSCR
20% down · 8.5% · 30yr
- Down + closing
- —
- Monthly P&I
- —
- Monthly cashflow
- —
- DSCR
- —
- Eligible?
- —
No personal income docs; deal must DSCR.
Hard money
10% down · 12.0% · 12mo
- Down + closing
- —
- Monthly P&I
- —
- Monthly cashflow
- —
- DSCR
- —
- Eligible?
- —
Short-term bridge; refi at stabilization.
Rent comps 40 comps
| Address | Beds | Baths | Sqft | Rent | $/sqft | DOM | Units | Dist |
|---|---|---|---|---|---|---|---|---|
| 8711 Southwark St Unit A Houston, TX | 3.0 | 2.0 | 1150 | $1,750 | $1.52 | 43d | 1 | 0.12mi |
| 9222 Hillis St Houston, TX | 3.0 | 2.0 | 1498 | $1,850 | $1.23 | 43d | 1 | 0.15mi |
| 8623 Homewood Ln Unit B Houston, TX | 3.0 | 2.5 | 1150 | $1,850 | $1.61 | 18d | 1 | 0.22mi |
| 8623 Homewood Unit A Houston, TX | 3.0 | 2.5 | 1150 | $1,850 | $1.61 | 43d | 1 | 0.22mi |
| 8625 Homewood Ln Unit B Houston, TX | 3.0 | 3.0 | 1500 | $1,850 | $1.23 | 43d | 1 | 0.22mi |
| 8627 Homewood Ln Unit B Houston, TX | 3.0 | 2.5 | 1500 | $1,850 | $1.23 | 43d | 1 | 0.22mi |
| 8631 Homewood Ln Unit B Houston, TX | 3.0 | 3.0 | 1500 | $1,850 | $1.23 | 43d | 1 | 0.23mi |
| 8631 Homewood Ln Unit A Houston, TX | 3.0 | 2.5 | 1500 | $1,850 | $1.23 | 43d | 1 | 0.23mi |
| 8602 Wilkins Oaks Dr Houston, TX | 3.0 | 2.0 | 1307 | $1,775 | $1.36 | 43d | 1 | 0.41mi |
| 8350 Tidwell Rd Unit A Houston, TX | 3.0 | 2.0 | 980 | $975 | $0.99 | 43d | 1 | 0.44mi |
| 8346 Tidwell Rd Unit B Houston, TX | 3.0 | 2.0 | 980 | $1,000 | $1.02 | 43d | 1 | 0.45mi |
| 8638 Doris Oaks Cir Houston, TX | 3.0 | 3.0 | 1777 | $1,975 | $1.11 | 43d | 1 | 0.46mi |
| 9702 Hillis St Houston, TX | 3.0 | 2.0 | 1612 | $1,550 | $0.96 | 43d | 1 | 0.48mi |
| 9110 Tidwell Rd Houston, TX | 2.0 | 2.0 | 987 | $1,185 | $1.20 | 43d | 1 | 0.50mi |
| 9110 Tidwell Rd Houston, TX | 2.0 | 2.0 | 987 | $1,200 | $1.22 | 24d | 1 | 0.50mi |
| 8238 Homewood Ln Houston, TX | 3.0 | 2.0 | 1696 | $1,695 | $1.00 | 24d | 1 | 0.61mi |
| 9700 Mesa Dr Houston, TX | 1.0–3.0 | 1.0–2.0 | 784 | $989 | $1.26 | 1d | 8 | 0.63mi |
| 9526 Balsam Ln Houston, TX | 3.0 | 1.5 | 1533 | $1,475 | $0.96 | 5d | 1 | 0.69mi |
| 8235 Locksley Rd Unit A Houston, TX | 3.0 | 2.5 | 1608 | $1,525 | $0.95 | 7d | 1 | 0.70mi |
| 8203 Woodlyn Rd Unit C Houston, TX | 3.0 | 2.5 | 1650 | $1,650 | $1.00 | 7d | 1 | 0.72mi |
| 9133 Woodlyn Rd Houston, TX | 3.0 | 1.0 | 1073 | $1,495 | $1.39 | 3d | 1 | 0.72mi |
| 9137 Woodlyn Rd Houston, TX | 3.0 | 1.0 | 1568 | $1,550 | $0.99 | 20d | 1 | 0.73mi |
| 8213 Linda Vista Rd Houston, TX | 3.0 | 2.0 | 1298 | $1,625 | $1.25 | 24d | 1 | 0.78mi |
| 8216 Richland Dr Unit B Houston, TX | 3.0 | 2.0 | 1150 | $1,750 | $1.52 | 43d | 1 | 0.84mi |
| 8309 Carolwood Dr Houston, TX | 3.0 | 1.0 | 938 | $1,350 | $1.44 | 43d | 1 | 0.84mi |
| 8302 Caddo Rd Houston, TX | 2.0 | 1.0 | 896 | $1,450 | $1.62 | 43d | 1 | 0.89mi |
| 8126 Sterlingshire St Unit B Houston, TX | 3.0 | 2.0 | 1150 | $1,350 | $1.17 | 24d | 1 | 0.90mi |
| 8122 Sterlingshire St Unit A Houston, TX | 3.0 | 2.0 | 1160 | $1,525 | $1.31 | 14d | 1 | 0.91mi |
| 8122 Sterlingshire St Unit B Houston, TX | 3.0 | 2.0 | 1160 | $1,450 | $1.25 | 14d | 1 | 0.91mi |
| 8213 Bigwood St Unit A Houston, TX | 3.0 | 2.5 | 1150 | $1,595 | $1.39 | 43d | 1 | 0.92mi |
| 8113 Denton St Houston, TX | 3.0 | 2.0 | 1150 | $1,750 | $1.52 | 43d | 1 | 0.94mi |
| 7600 E Houston Rd Houston, TX | 1.0–3.0 | 1.0–2.0 | 1017 | $1,436 | $1.41 | 13d | 8 | 0.96mi |
| 8314 Madera Rd Unit B Houston, TX | 3.0 | 2.5 | 1608 | $1,495 | $0.93 | 24d | 1 | 0.96mi |
| 8006 Lynette St Houston, TX | 3.0 | 1.0 | 1400 | $1,475 | $1.05 | 24d | 1 | 0.97mi |
| 9399 Tidwell Rd Houston, TX | 3.0 | 2.0 | 1031 | $1,107 | $1.07 | 24d | 1 | 1.04mi |
| 8102 Crestview Dr Unit B Houston, TX | 3.0 | 2.5 | 1600 | $1,900 | $1.19 | 43d | 1 | 1.06mi |
| 8102 Crestview Dr Unit A Houston, TX | 3.0 | 2.5 | 1800 | $1,900 | $1.06 | 22d | 1 | 1.06mi |
| 8102 Rhobell St Unit A Houston, TX | 4.0 | 3.5 | 1567 | $1,750 | $1.12 | 43d | 1 | 1.08mi |
| 9550 N Wayside Dr Houston, TX | 1.0–3.0 | 1.0–2.0 | 896 | $1,399 | $1.56 | 1d | 5 | 1.08mi |
| 9393 Tidwell Rd Houston, TX | 3.0–4.0 | 2.0 | 1135 | $1,244 | $1.10 | 1d | 10 | 1.10mi |
Listing history 14 events
-
2026-06-18days on market $75,000 Active 29 DOM
-
2026-06-17days on market $75,000 Active 28 DOM
-
2026-06-16days on market $75,000 Active 27 DOM
-
2026-06-15days on market $75,000 Active 26 DOM
-
2026-06-13days on market $75,000 Active 24 DOM
-
2026-06-10days on market $75,000 Active 20 DOM
-
2026-06-08days on market $75,000 Active 19 DOM
-
2026-06-07days on market $75,000 Active 18 DOM
-
2026-06-04days on market $75,000 Active 15 DOM
-
2026-06-01days on market $75,000 Active 12 DOM
-
2026-05-31days on market $75,000 Active 11 DOM
-
2026-02-27price $75,000 344-char remark
Show marketing remark (344 chars)
Investor/development opportunity! 8614 Fringewood Dr in NE Houston near Tidwell Rd & Mesa Dr needs TLC and/or may be a candidate for a rehab, perfect for builders or investors looking to add value. Buyer is responsible for all due diligence. Please exercise caution when touring. Conveniently located with easy access to the 610 North Loop.
-
2026-02-09$79,900 Active 344-char remark
Show marketing remark (344 chars)
Investor/development opportunity! 8614 Fringewood Dr in NE Houston near Tidwell Rd & Mesa Dr needs TLC and/or may be a candidate for a rehab, perfect for builders or investors looking to add value. Buyer is responsible for all due diligence. Please exercise caution when touring. Conveniently located with easy access to the 610 North Loop.
-
1994-06-01soldstatus
ⓘ Source: listings_history table (triggers on properties + properties_extension) + one-shot
backfill from property_details.listing_events for pre-trigger history.
Tax reassessment forecast TX · Resets to sale price
- Current annual tax
- $2,188 · $182/mo
- Projected year-2 tax
- $2,188 · $182/mo
- Expected delta
- $0/yr ($0/mo · 0.0%)
ⓘ Screening estimate from a state-policy table — verify with the county assessor before closing.
Climate risk First Street
- Flood 1/10 Low FEMA zone X (unshaded) · 0% chance over 30 yrs
- Wildfire 4/10 Moderate
- Heat 9/10 Extreme 7 d/yr ≥110°F today · 24 d/yr by 30 yrs out
- Wind 9/10 Extreme 99% chance of damaging wind over 30 yrs
- Air quality 3/10 Moderate 2 unhealthy d/yr today · 3 by 30 yrs out
Nearby sold comps map
Loading sold comps map…
Walkable amenities ~0.75 mi
Loading nearby amenities…
Taxation est. · year 1
- Rental income
- $21,173
- − Mortgage interest
- −$4,201
- − Property taxes
- −$2,188
- − Insurance
- −$375
- − Repairs & maintenance
- −$1,694
- − Management
- −$1,694
- − Depreciation
- −$2,182
- Taxable income
- $8,840
- Est. tax owed @ 24.0%
- −$2,122
- After-tax cash flow
- $7,323/yr
For passive investors: Depreciation is non-cash, so a rental often shows a tax loss while cash-flowing — sheltering income. Rental losses are passive: they offset passive income freely, and up to $25,000/yr can offset ordinary (W-2) income if you actively participate and your MAGI is under $100k (phasing out to $0 by $150k); unused losses carry forward. On sale, claimed depreciation is recaptured at up to 25%, and gains may owe capital-gains tax (a 1031 exchange can defer both). Figures are a year-1 estimate at your 24.0% rate — not tax advice; consult a CPA.
Schools (NCES district)
- District
- Houston ISD
- NCES district ID
- 4823640
- Math proficiency
- 27% ▼ -18.00%
- Reading proficiency
- 35% ▼ -6.00%
- Median HH income
- $46,054
- Composite
- 26.63/100
- National rank
- #7173
- State rank
- #593 of 826 in TX
Livability — Houston
- Score
- 74/100
- State rank
- #184
- US rank
- #4771
Category grades
Schools grade is shown separately in the Schools card above.
Census & demographics
- Census place
- Houston, TX
- County
- Harris County · 4,702,590 people
- City population
- 3,226,434
- Metro
- Houston-The Woodlands-Sugar Land, TX
- Population (ZIP)
- 19,109
- Household income
- $38,357
- Rent vs Own
- Severe rent burden
- 1177.0
Population outlook (Harris County) Hauer SSP2
- Today (2025)
- 5,571,493 people
- By 2030
- 6,089,821 · +9.3%
- By 2040
- 7,142,806 · +28.2%
- By 2050
- 8,185,864 · +46.9%
- By 2075
- 10,574,329 · +89.8%
- By 2100
- 12,109,958 · +117.4%
Race, ethnicity, and origin ACS 2023
- Neighborhood character
- Majority Black (57%)
- Race & ethnicity
- Black 57% Hispanic / Latino 41% Two or more races 15% White 2%
- Hispanic origin (detail)
- Mexican 36%
- Foreign-born
- 13% · Canada
- Languages at home
- 61% English-only · Spanish 38%
Political lean MEDSL · Harris
- 2024 margin
- Lean D (+5.5) · D 52.0% · R 46.4% · Other 1.6%
- 2008→2024 swing
- +3.9pp toward D · 2008: 1.6pp · 2024: 5.5pp
- All cycles
- 2024: D+5.5 2020: D+13.3 2016: D+12.4 2012: D+0.1 2008: D+1.6
Not yet ingested
- Civics
- —
Market trends
- HPI YoY
- ▲ 5.25%
- Current HPI
- 267.7798
- Rent YoY
- ▼ -1.55%
- Metro
- Houston-The Woodlands-Sugar Land, TX
- State GDP YoY
- ▲ 3.95%
- F500 in state
- 110
Industry mix (Fortune 500 HQ in TX)
| Industry | F500 HQs | Revenue |
|---|---|---|
| Energy | 16 | $1,198B |
|
||
| Technology | 5 | $198B |
|
||
| Engineering / Construction | 4 | $72B |
|
||
| Energy Services | 3 | $60B |
|
||
| Utilities | 3 | $41B |
|
||
| Healthcare | 2 | $330B |
|
||
Price history
-6.1% since first listed3 events — show timeline
- 2026-02-27 Price Changed $75,000 HARMLS
- 2026-02-09 Listed $79,900 HARMLS
- 1994-06-01 Sold (Public Records) — Public Records
Property tax history
+19.8%/yrLatest (2025): $2,188 · +1.5% YoY. Source: county tax records.
Cash-flow waterfall
monthlySold comps — $/sqft
last 12 mo · ≤1 miLoading sold comps…