 Duplex
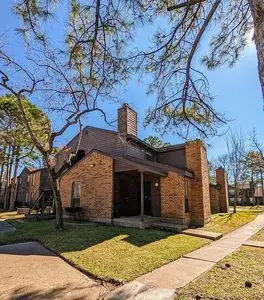
7200 W T C Jester Blvd · Houston, TX
Flood risk 4/10 · Minor
- FEMA flood zone
- X (unshaded)
- Chance of flooding over 30 yrs
- 0.2%
- Est. flood insurance / yr
- $507 – $1,088
Fire risk 1/10 · Minimal
- Est. fire insurance / yr
- $1,222 – $2,270
Heat risk 9/10 · Severe
- Hot days now (above 109°F)
- 7 days/yr
- Hot days in 30 yrs
- 24 days/yr
Wind risk 9/10 · Severe
- Chance of severe wind over 30 yrs
- 99.0%
Air-quality risk 3/10 · Minor
- Unhealthy air days now
- 3 days/yr
- Unhealthy air days in 30 yrs
- 4 days/yr
Risk factors via First Street. Map © Google.
Why this score? — see what drove the D grade
The composite is a weighted blend of 9 inputs, each scored 0–100. Each bar is that input's sub-score; the figure is the points it added to the 100-point composite (weight × sub-score).
- Cash flow +15.6/30.0
- ARV discount +7.5/15.0
- DSCR +4.8/10.0
- 1% rule +4.3/10.0
- Livability +3.7/5.0
- Condition / age +2.5/5.0
- Rent growth +2.2/5.0
- Schools +1.5/10.0
- Appreciation +0.0/10.0
$355,000
🖨 Deal sheet (PDF) 📄 Offer letter ✓ Due diligence
Multi-family units
County records classify this as Multi-Family (5+ Unit). Listing-text estimate: 2 units. estimate disagrees with records
5+ unit building — per-unit beds/baths from public records are typically unavailable; the breakdown below (if shown) is an estimate from the listing text.
Listing remarks MLS
Nice Four-Plex in Inwood Village and an excellent investment opportunity! (2) 1-bed units (750/sqft, (1) 2 - bed unit (900/sqft), (1) 3 -bed unit (1100/sqft). The complex is unique to the units that have fireplaces in all of the units and washer / dryer connections in all of the units as well. The one bedrooms are large bedrooms with a living and a dining area. Gated Community with 20 minutes of downtown Houston. Do NOT disturb tenants, please. NEVER FLOODED. These units are 100% occupied. See attachments for details on improvements and rent roll
Key facts
- Two renovated units
- Cathedral ceilings
- Newly remodeled unit
Tags
Property features AI
Finance
- Other: Information not available
- Financial info: Information not available
- HOA & community: Information not available
Exterior
- Parking: Information not available
- Security: Information not available
- Utilities: Information not available
- Home design: Built in 1983
- Construction: Living area approximately 588 (measurement available)
- Exterior features: Property on lot in Northside neighborhood
Interior
- Kitchen: Information not available
- Bedrooms: Information not available
- Flooring: Information not available
- Bathrooms: Information not available
- Heating & cooling: Information not available
- Interior features: Located in the Northside subdivision
- Laundry & utility: Information not available
Neighborhood map
What this means for you Summary
Snapshot
- This is a 2 × 4-bed/?-bath units multifamily listed at $355k.
Deal economics
- At list price, monthly cash flow is $147 ($2k/yr) — positive. Per door: $73/mo.
- The deal already cash-flows at list — no discount required.
- To meet the 1% rule (rent ≥ 1% of price), the offer needs to be $329k (7.3% below list).
- Recommended offer: $329k (7.3% below list) — sets the bar for 1% rule.
- Cap rate 6.8% vs local median 3.2% in Houston — top-decile yield for the area; either an underpriced asset or a hidden risk that comps aren't pricing in. Stress-test before assuming the spread holds.
Location & tenants
- Location reads 74/100 on livability (#184 in TX, #4,771 nationally) — a middle-class / working-renter tenant base. Strengths: amenities A+, cost of living A+, housing A+; Watch: crime F.
- Aldine ISD (suburban): math 16% / reading 21% proficiency, ranked #790 of 826 in TX (top 96%) — low school quality limits family demand, transient renter base, plan for 1-2y turnover; 79% free/reduced lunch — lower-income household profile, screen leases tightly.
- Zoned schools: Harris El (math 13% / reading 14%, grade F, #4,138 of 4,322 statewide, top 96%, 486 students, 98% FRL); Hoffman Middle (math 17% / reading 24%, grade F, #1,407 of 1,662 statewide, top 86%, 637 students, 91% FRL); Aldine H S (math 15% / reading 20%, grade F, #1,451 of 1,632 statewide, top 89%, 2,663 students, 94% FRL) — zoned schools average 94% FRL vs 79% district-wide (15 pts higher); higher-poverty schools than district average — tighter screening recommended.
- Market conditions: Rents soft (-1.0%/yr); 471 active listings in the ZIP; 29,883 units permitted in Harris County in 2024 (8,621 in 5+ unit buildings).
- At $3,291/mo this rent would consume 73% of the median local household income ($54k/yr) (locally 2294% of renters already pay >50% of income on rent) — very limited rent-growth headroom before tenants either downsize or default.
Forward outlook
- Local home prices are declining (-3.0%/yr); year-one equity from $2k of loan paydown is wiped out by about $11k of value loss. Plan a longer hold.
- Harris County population projected at +47% by 2050 — long-run rental-demand tailwind backs the buy-and-hold thesis.
Negotiation context
- It's been on market 39 days — a 3% lower offer ($344k) is reasonable based on typical stale-listing flexibility.
- 27 sale attempts since 12y ago; this cycle's ask is 47297% above the opening price — seller raised mid-cycle; expect resistance to lowballs.
Risks & watch-outs
- Climate carrying-cost: severe wind risk, 99% chance of damaging wind over 30y; extreme-heat days projected 7→24/yr by 2055 (HVAC capex compounding) — expect insurance premiums to compound above CPI over the hold.
Questions for the listing agent
- It's been on market 39 days. Have you received any prior offers? Is the seller open to a 7% concession, seller financing, or rate buy-down credit?
- Can we see the unit-by-unit rent roll, current vacancy, and any below-market leases? What's the average tenancy length?
- What capital expenditures (roof, boiler, parking lot, exteriors) have been made in the last 5 years, and what's planned in the next 2?
- Is there a deadline driving the sale (1031 exchange, divorce, estate, relocation)? That informs how much negotiation room exists.
- Schools are D-rated, which usually means shorter tenancies and higher turnover. Who's the typical renter profile here, and what's been the actual vacancy rate?
- Crime grade is F in this area — have there been break-ins, vandalism, or insurance claims at this property in the last 3 years? What carrier currently insures it and at what premium?
- The area grade is low — what's the realistic commute time and amenity access for the typical tenant pool here? Any planned neighborhood developments (good or bad) we should know about?
- What's the average days-on-market for RENTAL listings here right now (not sales)? A rising rental-DOM trend means longer vacancies and softer asking-rent achievability than the comps imply.
- What's the recent tenant-quality profile in this submarket — average credit score on applications, eviction rate, late-payment / NSF rate, and stable-employment percentage? A property-management company in the area should have these aggregated.
- How much new apartment / multifamily construction is in the pipeline within 1–3 miles? Heavy new supply (>2% of stock underway) typically softens rents 12–24 months out; light construction supports rent growth.
Investment metrics
- 1% rule
- 0.93% ✗
- Cap rate
- 6.79%
- Cash-on-cash
- 1.77%
- DSCR
- 1.08
- GRM
- 9.0
CMA / ARV
No comps found within radius.
Projected returns pro-forma
-3.0% appreciation · 0.0% rent growth · sell at horizon
- IRR
- -16.9%
- Equity multiple
- 0.42×
- Total profit
- $-57,785
- Equity at exit
- $52,932
- IRR
- -15.5%
- Equity multiple
- 0.24×
- Total profit
- $-75,369
- Equity at exit
- $30,694
Cash invested: $99,400 (down + closing). Projections, not guarantees.
Landlord ↔ Tenant lean methodology
- Overall (STATE)
- 87 Strongly Landlord-Friendly
- State Texas
- 87 Strongly Landlord-Friendly · R+5
- County
- — inherits STATE
- City
- — inherits STATE
ZIP-level market 77088
- Home prices YoY
- -23.2%
- Rents YoY
- -1.0%
- Active inventory
- 471
- Price-to-rent
- 18.0×
Monthly cashflow live
- Estimated rent
- $3,291 medium interval (Pro) →
- Mortgage (P&I)
- −$1,862
- Tax est. 1.5%
- −$444 /mo · $5,325/yr
- Insurance
- −$148
- HOA
- −$0
- Vacancy / Maint / Mgmt
- −$691
- Net cashflow
- $147
Break-even live
Sensitivity live
| Price | -10% $392 | -5% $269 | +0% $147 | +5% $24 | +10% $-99 |
|---|---|---|---|---|---|
| Rent | -10% $-113 | -5% $17 | +0% $147 | +5% $277 | +10% $407 |
| Rate | -1.0pp $325 | -0.5pp $237 | base $147 | +0.5pp $55 | +1.0pp $-39 |
2-unit breakdown (identical units grouped — click to expand)
| Units | Beds | Baths | Est. rent |
|---|---|---|---|
| 2× units | 4 | — | $3,290 |
| #1 | 4 | — | $1,645 |
| #2 | 4 | — | $1,645 |
| Total (2 units) | $3,291 | ||
UW: 25.0% down · 7.5% · 30yr · 1.5% tax · 5.0% vac · 8.0% maint · 8.0% mgmt
Financing live
Cash to close
- Down payment
- $88,750
- Closing costs
- $10,650
- Reserves months
- —
- Total cash needed
- —
Loan-product check · same deal, 3 products live
Conventional
25% down · 7.5% · 30yr
- Down + closing
- —
- Monthly P&I
- —
- Monthly cashflow
- —
- DSCR
- —
- Eligible?
- —
Personal DTI + credit; lowest rate.
DSCR
20% down · 8.5% · 30yr
- Down + closing
- —
- Monthly P&I
- —
- Monthly cashflow
- —
- DSCR
- —
- Eligible?
- —
No personal income docs; deal must DSCR.
Hard money
10% down · 12.0% · 12mo
- Down + closing
- —
- Monthly P&I
- —
- Monthly cashflow
- —
- DSCR
- —
- Eligible?
- —
Short-term bridge; refi at stabilization.
Listing history 50 events
-
2026-06-21days on market $355,000 Active 39 DOM
-
2026-06-18days on market $355,000 Active 36 DOM
-
2026-06-17days on market $355,000 Active 35 DOM
-
2026-06-16days on market $355,000 Active 34 DOM
-
2026-06-15days on market $355,000 Active 33 DOM
-
2026-06-13days on market $355,000 Active 31 DOM
-
2026-06-13days on market $355,000 Active 30 DOM
-
2026-06-09days on market $355,000 Active 27 DOM
-
2026-06-08days on market $355,000 Active 26 DOM
-
2026-06-07days on market $355,000 Active 25 DOM
-
2026-06-04days on market $355,000 Active 22 DOM
-
2026-06-03days on market $355,000 Active 21 DOM
-
2026-06-02days on market $355,000 Active 20 DOM
-
2026-06-01days on market $355,000 Active 19 DOM
-
2026-05-31days on market $355,000 Active 18 DOM
-
2026-05-07historical $1,000
-
2026-03-14$1,000
-
2026-01-01historical $1,000
-
2025-12-25$1,000
-
2025-04-09historical $1,600
-
2025-04-09historical $1,600
-
2025-04-09$1,600
-
2025-04-09$1,150
-
2025-02-24historical $900
-
2025-02-19$900
-
2025-02-06historical $900
-
2025-01-16$900
-
2022-07-08soldstatus Sold 556-char remark
Show marketing remark (556 chars)
Nice Four-Plex in Inwood Village and an excellent investment opportunity! (2) 1-bed units (750/sqft, (1) 2 - bed unit (900/sqft), (1) 3 -bed unit (1100/sqft). The complex is unique to the units that have fireplaces in all of the units and washer / dryer connections in all of the units as well. The one bedrooms are large bedrooms with a living and a dining area. Gated Community with 20 minutes of downtown Houston. Do NOT disturb tenants, please. NEVER FLOODED. These units are 100% occupied. See attachments for details on improvements and rent roll
-
2022-06-29status Pending 556-char remark
Show marketing remark (556 chars)
Nice Four-Plex in Inwood Village and an excellent investment opportunity! (2) 1-bed units (750/sqft, (1) 2 - bed unit (900/sqft), (1) 3 -bed unit (1100/sqft). The complex is unique to the units that have fireplaces in all of the units and washer / dryer connections in all of the units as well. The one bedrooms are large bedrooms with a living and a dining area. Gated Community with 20 minutes of downtown Houston. Do NOT disturb tenants, please. NEVER FLOODED. These units are 100% occupied. See attachments for details on improvements and rent roll
-
2022-06-26status Option Pending 556-char remark
Show marketing remark (556 chars)
Nice Four-Plex in Inwood Village and an excellent investment opportunity! (2) 1-bed units (750/sqft, (1) 2 - bed unit (900/sqft), (1) 3 -bed unit (1100/sqft). The complex is unique to the units that have fireplaces in all of the units and washer / dryer connections in all of the units as well. The one bedrooms are large bedrooms with a living and a dining area. Gated Community with 20 minutes of downtown Houston. Do NOT disturb tenants, please. NEVER FLOODED. These units are 100% occupied. See attachments for details on improvements and rent roll
-
2022-06-22status Pending 556-char remark
Show marketing remark (556 chars)
Nice Four-Plex in Inwood Village and an excellent investment opportunity! (2) 1-bed units (750/sqft, (1) 2 - bed unit (900/sqft), (1) 3 -bed unit (1100/sqft). The complex is unique to the units that have fireplaces in all of the units and washer / dryer connections in all of the units as well. The one bedrooms are large bedrooms with a living and a dining area. Gated Community with 20 minutes of downtown Houston. Do NOT disturb tenants, please. NEVER FLOODED. These units are 100% occupied. See attachments for details on improvements and rent roll
-
2022-06-15status Option Pending 556-char remark
Show marketing remark (556 chars)
Nice Four-Plex in Inwood Village and an excellent investment opportunity! (2) 1-bed units (750/sqft, (1) 2 - bed unit (900/sqft), (1) 3 -bed unit (1100/sqft). The complex is unique to the units that have fireplaces in all of the units and washer / dryer connections in all of the units as well. The one bedrooms are large bedrooms with a living and a dining area. Gated Community with 20 minutes of downtown Houston. Do NOT disturb tenants, please. NEVER FLOODED. These units are 100% occupied. See attachments for details on improvements and rent roll
-
2022-05-29$330,000 Active 556-char remark
Show marketing remark (556 chars)
Nice Four-Plex in Inwood Village and an excellent investment opportunity! (2) 1-bed units (750/sqft, (1) 2 - bed unit (900/sqft), (1) 3 -bed unit (1100/sqft). The complex is unique to the units that have fireplaces in all of the units and washer / dryer connections in all of the units as well. The one bedrooms are large bedrooms with a living and a dining area. Gated Community with 20 minutes of downtown Houston. Do NOT disturb tenants, please. NEVER FLOODED. These units are 100% occupied. See attachments for details on improvements and rent roll
-
2022-05-24price $800
-
2021-09-02soldstatus Sold
-
2021-08-23status Pending
-
2021-07-24status Option Pending
-
2021-07-20$549,000 Active
-
2020-10-07soldstatus Sold
-
2020-09-17status Pending
-
2020-07-03status Pending
-
2020-06-23status Option Pending
-
2020-06-21historical
-
2020-06-17$205,000 Active
-
2020-03-31soldstatus Sold
-
2020-03-04status Pending
-
2020-02-24status Option Pending
-
2020-02-22$179,000 Active
-
2017-04-22soldstatus Sold
-
2017-04-18status Pending
ⓘ Source: listings_history table (triggers on properties + properties_extension) + one-shot
backfill from property_details.listing_events for pre-trigger history.
Climate risk First Street
- Flood 4/10 Moderate FEMA zone X (unshaded) · 20% chance over 30 yrs
- Wildfire 1/10 Low
- Heat 9/10 Extreme 7 d/yr ≥109°F today · 24 d/yr by 30 yrs out
- Wind 9/10 Extreme 99% chance of damaging wind over 30 yrs
- Air quality 3/10 Moderate 3 unhealthy d/yr today · 4 by 30 yrs out
Nearby sold comps map
Loading sold comps map…
Walkable amenities ~0.75 mi
Loading nearby amenities…
Taxation est. · year 1
- Rental income
- $39,492
- − Mortgage interest
- −$19,886
- − Property taxes
- −$5,325
- − Insurance
- −$1,775
- − Repairs & maintenance
- −$3,159
- − Management
- −$3,159
- − Depreciation
- −$10,327
- Taxable loss
- −$4,140
- Est. tax savings @ 24.0%
- +$993
- After-tax cash flow
- $2,752/yr
For passive investors: Depreciation is non-cash, so a rental often shows a tax loss while cash-flowing — sheltering income. Rental losses are passive: they offset passive income freely, and up to $25,000/yr can offset ordinary (W-2) income if you actively participate and your MAGI is under $100k (phasing out to $0 by $150k); unused losses carry forward. On sale, claimed depreciation is recaptured at up to 25%, and gains may owe capital-gains tax (a 1031 exchange can defer both). Figures are a year-1 estimate at your 24.0% rate — not tax advice; consult a CPA.
Schools (NCES district)
- District
- Aldine ISD
- NCES district ID
- 4807710
- Math proficiency
- 16% ▼ -23.00%
- Reading proficiency
- 21% ▼ -11.00%
- Median HH income
- $37,081
- Composite
- 15.42/100
- National rank
- #9317
- State rank
- #790 of 826 in TX
Livability — Houston
- Score
- 74/100
- State rank
- #184
- US rank
- #4771
Category grades
Schools grade is shown separately in the Schools card above.
Census & demographics
- Census place
- Houston, TX
- County
- Harris County · 4,702,590 people
- City population
- 3,226,434
- Metro
- Houston-The Woodlands-Sugar Land, TX
- Population (ZIP)
- 57,047
- Household income
- $54,411
- Rent vs Own
- Severe rent burden
- 2294.0
Population outlook (Harris County) Hauer SSP2
- Today (2025)
- 5,571,493 people
- By 2030
- 6,089,821 · +9.3%
- By 2040
- 7,142,806 · +28.2%
- By 2050
- 8,185,864 · +46.9%
- By 2075
- 10,574,329 · +89.8%
- By 2100
- 12,109,958 · +117.4%
Race, ethnicity, and origin ACS 2023
- Neighborhood character
- Diverse neighborhood (Simpson 0.59)
- Race & ethnicity
- Hispanic / Latino 52% Black 37% Two or more races 18% White 6% Asian 4%
- Hispanic origin (detail)
- Mexican 36%
- Common ancestry
- Lithuanian 1%
- Foreign-born
- 25% · Canada, Vietnam, China
- Languages at home
- 49% English-only · Spanish 47% Vietnamese 3%
Political lean MEDSL · Harris
- 2024 margin
- Lean D (+5.5) · D 52.0% · R 46.4% · Other 1.6%
- 2008→2024 swing
- +3.9pp toward D · 2008: 1.6pp · 2024: 5.5pp
- All cycles
- 2024: D+5.5 2020: D+13.3 2016: D+12.4 2012: D+0.1 2008: D+1.6
Not yet ingested
- Civics
- —
Market trends
- HPI YoY
- ▼ -98.37%
- Current HPI
- 325.0499
- Rent YoY
- ▼ -1.01%
- Metro
- Houston-The Woodlands-Sugar Land, TX
- State GDP YoY
- ▲ 3.95%
- F500 in state
- 110
Industry mix (Fortune 500 HQ in TX)
| Industry | F500 HQs | Revenue |
|---|---|---|
| Energy | 16 | $1,198B |
|
||
| Technology | 5 | $198B |
|
||
| Engineering / Construction | 4 | $72B |
|
||
| Energy Services | 3 | $60B |
|
||
| Utilities | 3 | $41B |
|
||
| Healthcare | 2 | $330B |
|
||
Price history
-99.3% since first listed97 events — show timeline
- 2026-05-26 Listed for Rent $749 SHOWMOJO
- 2026-05-07 Rental Removed $749 SHOWMOJO
- 2026-03-25 Rental Removed $749 SHOWMOJO
- 2026-03-14 Listed for Rent $749 SHOWMOJO
- 2026-03-06 Listed for Rent $749 SHOWMOJO
- 2026-01-01 Rental Removed $1,000 SHOWMOJO
- 2025-12-25 Listed for Rent $1,000 SHOWMOJO
- 2025-09-05 Rental Removed $945 SHOWMOJO
- 2025-09-04 Listed for Rent $945 SHOWMOJO
- 2025-04-09 Rental Removed $1,600 RENTALBEAST
- 2025-04-09 Rental Removed $1,600 RENTALBEAST
- 2025-04-09 Listed for Rent $1,600 RENTALBEAST
- 2025-04-09 Listed for Rent $1,150 RENTALBEAST
- 2025-02-24 Rental Removed $900 RENTALBEAST
- 2025-02-19 Listed for Rent $900 RENTALBEAST
- 2025-02-06 Rental Removed $900 RENTALBEAST
- 2025-01-16 Listed for Rent $900 RENTALBEAST
- 2022-07-08 Sold (MLS) — HARMLS
- 2022-06-29 Pending — HARMLS
- 2022-06-26 Pending — HARMLS
- 2022-06-22 Pending — HARMLS
- 2022-06-15 Pending — HARMLS
- 2022-05-29 Listed $330,000 HARMLS
- 2022-05-24 Price Changed $800 RENT.
- 2021-09-02 Sold (MLS) — HARMLS
- 2021-08-23 Pending — HARMLS
- 2021-07-24 Pending — HARMLS
- 2021-07-20 Listed $549,000 HARMLS
- 2020-10-07 Sold (MLS) — HARMLS
- 2020-09-17 Pending — HARMLS
- 2020-07-03 Pending — HARMLS
- 2020-06-23 Pending — HARMLS
- 2020-06-21 Listing Removed — HARMLS
- 2020-06-17 Listed $205,000 HARMLS
- 2020-03-31 Sold (MLS) — HARMLS
- 2020-03-04 Pending — HARMLS
- 2020-02-24 Pending — HARMLS
- 2020-02-22 Listed $179,000 HARMLS
- 2017-04-22 Sold (MLS) — HARMLS
- 2017-04-18 Pending — HARMLS
- 2017-04-17 Pending — HARMLS
- 2017-03-12 Pending — HARMLS
- 2017-03-03 Pending — HARMLS
- 2017-02-01 Price Changed $169,500 HARMLS
- 2016-12-14 Sold (MLS) — HARMLS
- 2016-12-09 Pending — HARMLS
- 2016-11-08 Pending — HARMLS
- 2016-10-29 Pending — HARMLS
- 2016-10-07 Listed $160,000 HARMLS
- 2016-10-04 Listing Removed — HARMLS
- 2016-08-31 Sold (MLS) — HARMLS
- 2016-07-25 Listed $168,000 HARMLS
- 2016-07-24 Listing Removed — HARMLS
- 2016-05-20 Listing Removed — HARMLS
- 2016-05-20 Listed $62,400 HARMLS
- 2016-03-16 Listing Removed — HARMLS
- 2016-03-11 Price Changed $180,000 HARMLS
- 2016-03-10 Listed $175,000 HARMLS
- 2016-02-25 Price Changed $175,000 HARMLS
- 2016-02-12 Listed $190,000 HARMLS
- 2015-09-14 Listed $200,000 HARMLS
- 2015-03-13 Sold (MLS) — HARMLS
- 2015-03-03 Pending — HARMLS
- 2015-02-14 Pending — HARMLS
- 2015-02-06 Listing Removed — HARMLS
- 2015-02-06 Sold (MLS) — HARMLS
- 2015-02-06 Sold (MLS) — HARMLS
- 2015-02-06 Sold (MLS) — HARMLS
- 2015-02-05 Listing Removed — HARMLS
- 2015-02-02 Pending — HARMLS
- 2015-02-02 Pending — HARMLS
- 2015-02-02 Pending — HARMLS
- 2015-02-02 Pending — HARMLS
- 2015-01-16 Listed $165,000 HARMLS
- 2014-12-28 Relisted — HARMLS
- 2014-12-23 Pending — HARMLS
- 2014-12-11 Price Changed $175,000 HARMLS
- 2014-12-11 Price Changed $175,000 HARMLS
- 2014-12-11 Price Changed $175,000 HARMLS
- 2014-12-11 Price Changed $165,000 HARMLS
- 2014-12-11 Relisted — HARMLS
- 2014-12-11 Price Changed $165,000 HARMLS
- 2014-12-11 Relisted — HARMLS
- 2014-12-11 Relisted — HARMLS
- 2014-12-11 Price Changed $165,000 HARMLS
- 2014-12-10 Pending — HARMLS
- 2014-12-01 Sold (MLS) — HARMLS
- 2014-11-25 Pending — HARMLS
- 2014-11-20 Listed $150,000 HARMLS
- 2014-11-20 Listed $150,000 HARMLS
- 2014-10-23 Pending — HARMLS
- 2014-10-23 Pending — HARMLS
- 2014-10-23 Pending — HARMLS
- 2014-10-01 Listing Removed — HARMLS
- 2014-10-01 Sold (MLS) — HARMLS
- 2014-09-30 Pending — HARMLS
- 2014-09-24 Listed $135,000 HARMLS
Cash-flow waterfall
monthlySold comps — $/sqft
last 12 mo · ≤1 miLoading sold comps…