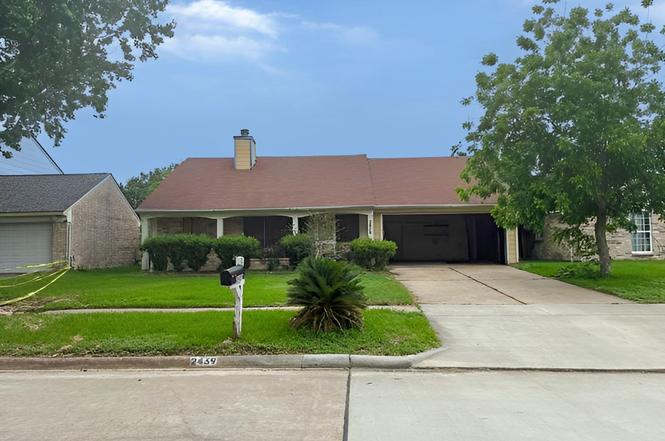
2439 Anthony Hay Ln · Houston, TX
Flood risk 4/10 · Minor
- FEMA flood zone
- X (unshaded)
- Chance of flooding over 30 yrs
- 0.2%
- Est. flood insurance / yr
- $507 – $1,088
Fire risk 2/10 · Minimal
- Est. fire insurance / yr
- $1,222 – $2,270
Heat risk 9/10 · Severe
- Hot days now (above 111°F)
- 7 days/yr
- Hot days in 30 yrs
- 23 days/yr
Wind risk 9/10 · Severe
- Chance of severe wind over 30 yrs
- 99.0%
Air-quality risk 2/10 · Minimal
- Unhealthy air days now
- 1 days/yr
- Unhealthy air days in 30 yrs
- 2 days/yr
Risk factors via First Street. Map © Google.
Why this score? — see what drove the B- grade
The composite is a weighted blend of 9 inputs, each scored 0–100. Each bar is that input's sub-score; the figure is the points it added to the 100-point composite (weight × sub-score).
- Cash flow +19.3/30.0
- ARV discount +15.0/15.0
- 1% rule +7.5/10.0
- DSCR +6.1/10.0
- Schools +5.7/10.0
- Appreciation +4.4/10.0
- Livability +3.7/5.0
- Condition / age +2.5/5.0
- Rent growth +1.8/5.0
$150,000
🖨 Deal sheet 📄 Offer letter ✓ Due diligence
Listing remarks
Charming 3 bedroom 2 bath residence located in the established Williamsburg Colony community. This home offers a functional floor plan with ample living spaces, spacious kitchen and a private backyard. Primary suite features en-suite bath. Access to neighborhood amenities include community pool, clubhouse, playground, parks and tennis courts. Conveniently located near major highways, shopping, dining and schools.
Key facts
- Clubhouse
- Community pool
- Private backyard
Tags
Property features AI
Finance
- HOA & community: Association managed by Crest Management Company; Monthly association fee of $33; Community amenities include clubhouse, park, pool, and tennis courts
Exterior
- Parking: Attached 2-car garage
- Utilities: Public water; Public sewer
- Home design: Residential property; Single-story entry (all main rooms listed on first floor)
- Construction: Brick construction; Composition roof; Built in 1983; Slab foundation
- Exterior features: Subdivision lot; Asphalt road access; Association pool
Interior
- Kitchen: Dishwasher; Electric oven; Electric range
- Bedrooms: Primary bedroom on first floor (12 x 16); Two additional bedrooms on first floor (each 10 x 12); One more bedroom on first floor (10 x 12)
- Bathrooms: Two full bathrooms
- Heating & cooling: Central heating (electric); Central air conditioning (electric)
- Interior features: Breakfast bar; Kitchen open to family room; Gas log fireplace (one)
Neighborhood map
What this means for you Summary
Snapshot
- This is a 3-bed/2.0-bath single-family listed at $150k.
Deal economics
- At list price, monthly cash flow is $166 ($2k/yr) — positive.
- The deal already cash-flows at list — no discount required.
- Meets the 1% rule at list price ($2k rent vs $150k).
- Cap rate 7.6% vs local median 3.2% in Houston — top-decile yield for the area; either an underpriced asset or a hidden risk that comps aren't pricing in. Stress-test before assuming the spread holds.
Location & tenants
- Location reads 74/100 on livability (#184 in TX, #4,771 nationally) — a middle-class / working-renter tenant base. Strengths: amenities A+, cost of living A+, housing A+; Watch: crime F.
- Katy ISD (suburban): math 61% / reading 63% proficiency, ranked #29 of 826 in TX (top 4%) — acceptable for families but not a draw, mixed tenant base, ~2y average lease.
- Zoned schools: Morton Ranch J H (math 37% / reading 42%, grade F, #660 of 1,662 statewide, top 41%, 1,184 students, 75% FRL); Morton Ranch H S (math 31% / reading 55%, grade F, #713 of 1,632 statewide, top 44%, 2,718 students, 72% FRL) — zoned schools average 74% FRL vs 27% district-wide (46 pts higher); higher-poverty schools than district average — tighter screening recommended.
- Zoned-school proficiency averages 41% at this address vs 62% district-wide (-21 pts) — the specific schools serving this property underperform the Katy ISD average; the district grade overstates school quality for this exact location.
- Market conditions: Rents soft (-2.9%/yr); 744 active listings in the ZIP; 40 comparable units currently listed for rent nearby; rentals leasing fast (median 11d on market — plan ~1-2 weeks tenant-placement turnaround); solid renter incomes; 29,883 units permitted in Harris County in 2024 (8,621 in 5+ unit buildings).
Forward outlook
- Local home prices are declining (-1.3%/yr); year-one equity from $1k of loan paydown is wiped out by about $2k of value loss. Plan a longer hold.
- Harris County population projected at +47% by 2050 — long-run rental-demand tailwind backs the buy-and-hold thesis.
Negotiation context
- Only 8 days on market — expect competitive offers; lowballing is unlikely to land.
- Current owner paid $60k; list at $150k implies a 150% gain — meaningful room to come down on a strong offer.
Risks & watch-outs
- Watch-outs: property tax is 3.4% of price.
- Climate carrying-cost: severe wind risk, 99% chance of damaging wind over 30y; extreme-heat days projected 7→23/yr by 2055 (HVAC capex compounding) — expect insurance premiums to compound above CPI over the hold.
Questions for the listing agent
- Property tax is high relative to price — has the assessment been appealed recently, and will the sale trigger a re-assessment?
- What does the HOA fee cover, when was the last increase, and are there any pending special assessments or reserve-fund shortfalls?
- Is there a deadline driving the sale (1031 exchange, divorce, estate, relocation)? That informs how much negotiation room exists.
- Schools are D-rated, which usually means shorter tenancies and higher turnover. Who's the typical renter profile here, and what's been the actual vacancy rate?
- Crime grade is F in this area — have there been break-ins, vandalism, or insurance claims at this property in the last 3 years? What carrier currently insures it and at what premium?
- What's the average days-on-market for RENTAL listings here right now (not sales)? A rising rental-DOM trend means longer vacancies and softer asking-rent achievability than the comps imply.
- What's the recent tenant-quality profile in this submarket — average credit score on applications, eviction rate, late-payment / NSF rate, and stable-employment percentage? A property-management company in the area should have these aggregated.
- How much new for-sale + rental construction is in the pipeline within 1–3 miles? Heavy new supply typically softens prices + rents 12–24 months out; constrained supply supports both.
Investment metrics
- 1% rule
- 1.25% ✓
- Cap rate
- 7.62%
- Cash-on-cash
- 4.74%
- DSCR
- 1.21
- GRM
- 6.7
CMA / ARV
- ARV (on-the-fly)
- $262,450
- Comps found
- 12
Show comp detail 12 sales within ~0.75 mi
| Address | Dist | Beds/Ba | Sqft | Sold | Price | $/sf | Match |
|---|---|---|---|---|---|---|---|
| 22810 John Rolfe Ln | 0.20mi | 3/2.0 | 1,447 (-0%) | 0mo | $275,000 | $190 | 90 |
| 22815 Stratford House Ln | 0.13mi | 3/2.0 | 1,490 (+3%) | 1mo | $249,000 | $167 | 89 |
| 22623 Elkana Deane Ln | 0.28mi | 3/2.0 | 1,408 (-3%) | 0mo | $260,000 | $185 | 82 |
| 22619 Blair Manor Ln | 0.27mi | 3/2.0 | 1,365 (-6%) | 1mo | $242,000 | $177 | 77 |
| 22551 Market Square Ln | 0.54mi | 3/2.0 | 1,429 (-1%) | 3mo | $239,900 | $168 | 70 |
| 22506 Elkana Deane Ln | 0.37mi | 3/2.0 | 1,344 (-7%) | 2mo | $242,000 | $180 | 68 |
| 2519 Northern Great White Ct | 0.49mi | 3/2.0 | 1,521 (+5%) | 2mo | $275,000 | $181 | 68 |
| 2430 Blue Reef Dr | 0.62mi | 3/2.0 | 1,507 (+4%) | 1mo | $275,000 | $182 | 64 |
| 2654 Anthony Hay Ln | 0.33mi | 3/2.0 | 1,292 (-11%) | 4mo | $249,900 | $193 | 63 |
| 22334 Guston Hall Ln | 0.59mi | 3/2.0 | 1,349 (-7%) | 2mo | $269,900 | $200 | 60 |
| 22606 Banter Point Ln | 0.67mi | 3/2.0 | 1,600 (+10%) | 0mo | $278,400 | $174 | 52 |
| 2406 Seahorse Bend Dr | 0.71mi | 3/2.0 | 1,605 (+11%) | 3mo | $280,000 | $174 | 46 |
Match score weights: distance 35% · size 25% · config 20% · recency 20%. Top-matched comps best support the ARV.
Projected returns pro-forma
-1.27% appreciation · 0.0% rent growth · sell at horizon
- IRR
- -4.5%
- Equity multiple
- 0.81×
- Total profit
- $-7,842
- Equity at exit
- $34,268
- IRR
- -1.0%
- Equity multiple
- 0.92×
- Total profit
- $-3,257
- Equity at exit
- $34,356
Cash invested: $42,000 (down + closing). Projections, not guarantees.
Landlord ↔ Tenant lean methodology
- Overall (STATE)
- 87 Strongly Landlord-Friendly
- State Texas
- 87 Strongly Landlord-Friendly · R+5
- County
- — inherits STATE
- City
- — inherits STATE
ZIP-level market 77449
- Home prices YoY
- -0.5%
- Rents YoY
- -2.9%
- Active inventory
- 744
- Price-to-rent
- 6.7×
Monthly cashflow live
- Estimated rent
- $1,871 high interval (Pro) →
- Mortgage (P&I)
- −$787
- Tax from tax record
- −$430 /mo · $5,166/yr
- Insurance
- −$62
- HOA
- −$33
- Vacancy / Maint / Mgmt
- −$393
- Net cashflow
- $166
Break-even live
UW: 25.0% down · 7.5% · 30yr · 1.5% tax · 5.0% vac · 8.0% maint · 8.0% mgmt
Financing live
Cash to close
- Down payment
- $37,500
- Closing costs
- $4,500
- Reserves months
- —
- Total cash needed
- —
Loan-product check · same deal, 3 products live
Conventional
25% down · 7.5% · 30yr
- Down + closing
- —
- Monthly P&I
- —
- Monthly cashflow
- —
- DSCR
- —
- Eligible?
- —
Personal DTI + credit; lowest rate.
DSCR
20% down · 8.5% · 30yr
- Down + closing
- —
- Monthly P&I
- —
- Monthly cashflow
- —
- DSCR
- —
- Eligible?
- —
No personal income docs; deal must DSCR.
Hard money
10% down · 12.0% · 12mo
- Down + closing
- —
- Monthly P&I
- —
- Monthly cashflow
- —
- DSCR
- —
- Eligible?
- —
Short-term bridge; refi at stabilization.
Rent comps 40 comps
| Address | Beds | Baths | Sqft | Rent | $/sqft | DOM | Units | Dist |
|---|---|---|---|---|---|---|---|---|
| 22822 Capitol Landing Ln Katy, TX | 3.0 | 2.0 | 1702 | $1,399 | $0.82 | 22d | 1 | 0.09mi |
| 22819 Carter Moir Ln Katy, TX | 3.0 | 2.0 | 1650 | $1,895 | $1.15 | 17d | 1 | 0.31mi |
| 23010 Franz Rd Unit 23047 Katy, TX | 2.0 | 2.0 | 1072 | $1,455 | $1.36 | 15d | 1 | 0.32mi |
| 23010 Franz Rd Unit 2112 Katy, TX | 2.0 | 2.0 | 1116 | $1,670 | $1.50 | 3d | 1 | 0.32mi |
| 23010 Franz Rd Unit 2162 Katy, TX | 2.0 | 2.0 | 1116 | $1,678 | $1.50 | 4d | 1 | 0.32mi |
| 23010 Franz Rd Unit 23067 Katy, TX | 2.0 | 2.0 | 1072 | $1,480 | $1.38 | 43d | 1 | 0.32mi |
| 23010 Franz Rd Unit 23033 Katy, TX | 2.0 | 2.0 | 1116 | $1,702 | $1.53 | 10d | 1 | 0.32mi |
| 22510 Leedstown Ln Katy, TX | 3.0 | 2.0 | 1282 | $1,649 | $1.29 | 5d | 1 | 0.39mi |
| 2753 W Grand Pkwy N Katy, TX | 2.0 | 2.0 | 1073 | $1,799 | $1.68 | 43d | 1 | 0.46mi |
| 2020 Grandway Dr Katy, TX | 1.0–2.0 | 1.0–2.0 | 954 | $2,013 | $2.11 | 2d | 46 | 0.51mi |
| 23223 First Park Dr Unit 23256 Katy, TX | 3.0 | 2.0 | 1403 | $2,283 | $1.63 | 43d | 1 | 0.54mi |
| 23223 First Park Dr Unit 23260 Katy, TX | 2.0 | 2.0 | 983 | $1,659 | $1.69 | 43d | 1 | 0.54mi |
| 23223 First Park Dr Unit 3187 Katy, TX | 3.0 | 2.0 | 1403 | $2,240 | $1.60 | 3d | 1 | 0.54mi |
| 23223 First Park Dr Unit 3174 Katy, TX | 3.0 | 2.0 | 1403 | $2,272 | $1.62 | 10d | 1 | 0.54mi |
| 23223 First Park Dr Unit 2174 Katy, TX | 2.0 | 2.0 | 983 | $1,669 | $1.70 | 10d | 1 | 0.54mi |
| 23223 First Park Dr Unit 424 Katy, TX | 2.0 | 2.0 | 983 | $1,634 | $1.66 | 5d | 1 | 0.54mi |
| 23223 First Park Dr Unit 2112 Katy, TX | 2.0 | 2.0 | 983 | $1,626 | $1.65 | 3d | 1 | 0.54mi |
| 22777 Franz Rd Unit 2112 Katy, TX | 2.0 | 2.0 | 990 | $1,379 | $1.39 | 3d | 1 | 0.55mi |
| 22777 Franz Rd Unit 22814 Katy, TX | 2.0 | 2.0 | 990 | $1,515 | $1.53 | 43d | 1 | 0.55mi |
| 22777 Franz Rd Unit 424 Katy, TX | 2.0 | 2.0 | 990 | $1,387 | $1.40 | 5d | 1 | 0.55mi |
| 22777 Franz Rd Unit 22814 Katy, TX | 2.0 | 2.0 | 990 | $1,411 | $1.43 | 10d | 1 | 0.55mi |
| 23050 Morton Ranch Rd Katy, TX | 1.0–3.0 | 1.0–2.0 | 1109 | $2,609 | $2.35 | 1d | 31 | 0.70mi |
| 3206 Peek Rd Katy, TX | 3.0 | 2.0 | 1535 | $2,279 | $1.48 | 43d | 1 | 0.83mi |
| 1724 Partnership Way Katy, TX | 3.0 | 1.0–3.5 | 1536 | $3,340 | $2.17 | 1d | 86 | 0.90mi |
| 1616 Partnership Way Katy, TX | 3.0 | 1.0–3.0 | 1283 | $2,995 | $2.33 | 5d | 47 | 0.93mi |
| 3200 Peek Rd Katy, TX | 3.0 | 1.0–2.0 | 1069 | $2,351 | $2.20 | 2d | 30 | 0.94mi |
| 1502 Partnership Way Unit 2174 Katy, TX | 2.0 | 2.0 | 1207 | $1,774 | $1.47 | 11d | 1 | 0.97mi |
| 1502 Partnership Way Unit 424 Katy, TX | 2.0 | 2.0 | 1207 | $1,739 | $1.44 | 5d | 1 | 0.97mi |
| 1502 Partnership Way Unit 2187 Katy, TX | 2.0 | 2.0 | 1207 | $1,731 | $1.43 | 3d | 1 | 0.97mi |
| 1502 Partnership Way Unit 1539 Katy, TX | 2.0 | 2.0 | 1092 | $1,714 | $1.57 | 43d | 1 | 0.97mi |
| 1502 Partnership Way Katy, TX | 2.0 | 2.0 | 1092 | $1,800 | $1.65 | 43d | 1 | 0.97mi |
| 1799 Earl of Dunmore St Katy, TX | 2.0 | 2.0 | 1068 | $1,670 | $1.56 | 11d | 1 | 1.19mi |
| 21622 Stonecross Terrace Ln Katy, TX | 3.0 | 2.0 | 1778 | $2,050 | $1.15 | 24d | 1 | 1.21mi |
| 22631 Colonial Pkwy Unit 424 Katy, TX | 2.0 | 2.0 | 1195 | $1,639 | $1.37 | 5d | 1 | 1.22mi |
| 22631 Colonial Pkwy Unit 2228 Katy, TX | 2.0 | 2.0 | 1195 | $1,631 | $1.36 | 3d | 1 | 1.22mi |
| 22631 Colonial Pkwy Unit 22668 Katy, TX | 2.0 | 2.0 | 1195 | $1,663 | $1.39 | 10d | 1 | 1.22mi |
| 22631 Colonial Pkwy Unit 22688 Katy, TX | 2.0 | 2.0 | 1074 | $1,339 | $1.25 | 12d | 1 | 1.22mi |
| 22631 Colonial Pkwy Unit 22668 Katy, TX | 2.0 | 2.0 | 1151 | $1,740 | $1.51 | 43d | 1 | 1.22mi |
| 2031 Wigmaker Dr Katy, TX | 3.0 | 2.0 | 1430 | $1,800 | $1.26 | 5d | 1 | 1.29mi |
| 22540 Merchants Way Katy, TX | 1.0–2.0 | 1.0–2.0 | 921 | $2,041 | $2.21 | 2d | 29 | 1.32mi |
HOA detail
- Monthly dues
- $33 · $396/yr
- Likely covers
- pool
Listing history 6 events
-
2026-06-18days on market $150,000 Active 8 DOM
-
2026-06-17days on market $150,000 Active 7 DOM
-
2026-06-16days on market $150,000 Active 6 DOM
-
2026-06-15days on market $150,000 Active 5 DOM
-
2026-06-13remarks 416-char remark
-
2026-06-13$150,000 Active 3 DOM
ⓘ Source: listings_history table (triggers on properties + properties_extension) + one-shot
backfill from property_details.listing_events for pre-trigger history.
Tax reassessment forecast TX · Resets to sale price
- Current annual tax
- $5,166 · $430/mo
- Projected year-2 tax
- $5,166 · $430/mo
- Expected delta
- $0/yr ($0/mo · 0.0%)
ⓘ Screening estimate from a state-policy table — verify with the county assessor before closing.
Climate risk First Street
- Flood 4/10 Moderate FEMA zone X (unshaded) · 20% chance over 30 yrs
- Wildfire 2/10 Low
- Heat 9/10 Extreme 7 d/yr ≥111°F today · 23 d/yr by 30 yrs out
- Wind 9/10 Extreme 99% chance of damaging wind over 30 yrs
- Air quality 2/10 Low 1 unhealthy d/yr today · 2 by 30 yrs out
Nearby sold comps map
Loading sold comps map…
Walkable amenities ~0.75 mi
Loading nearby amenities…
Taxation est. · year 1
- Rental income
- $22,458
- − Mortgage interest
- −$8,402
- − Property taxes
- −$5,166
- − Insurance
- −$750
- − Repairs & maintenance
- −$1,797
- − Management
- −$1,797
- − HOA
- −$396
- − Depreciation
- −$4,364
- Taxable loss
- −$213
- Est. tax savings @ 24.0%
- +$51
- After-tax cash flow
- $2,041/yr
For passive investors: Depreciation is non-cash, so a rental often shows a tax loss while cash-flowing — sheltering income. Rental losses are passive: they offset passive income freely, and up to $25,000/yr can offset ordinary (W-2) income if you actively participate and your MAGI is under $100k (phasing out to $0 by $150k); unused losses carry forward. On sale, claimed depreciation is recaptured at up to 25%, and gains may owe capital-gains tax (a 1031 exchange can defer both). Figures are a year-1 estimate at your 24.0% rate — not tax advice; consult a CPA.
Schools (NCES district)
- District
- Katy ISD
- NCES district ID
- 4825170
- Math proficiency
- 61% ▼ -7.00%
- Reading proficiency
- 63% ▼ -3.00%
- Median HH income
- $90,312
- Composite
- 56.59/100
- National rank
- #1146
- State rank
- #29 of 826 in TX
Livability — Houston
- Score
- 74/100
- State rank
- #184
- US rank
- #4771
Category grades
Schools grade is shown separately in the Schools card above.
Census & demographics
- County
- Harris County · 4,702,590 people
- City population
- 3,226,434
- Metro
- Houston-The Woodlands-Sugar Land, TX
- Population (ZIP)
- 130,028
- Household income
- $87,808
- Rent vs Own
- Severe rent burden
- 3088.0
Population outlook (Harris County) Hauer SSP2
- Today (2025)
- 5,571,493 people
- By 2030
- 6,089,821 · +9.3%
- By 2040
- 7,142,806 · +28.2%
- By 2050
- 8,185,864 · +46.9%
- By 2075
- 10,574,329 · +89.8%
- By 2100
- 12,109,958 · +117.4%
Race, ethnicity, and origin ACS 2023
- Neighborhood character
- Diverse neighborhood (Simpson 0.68)
- Race & ethnicity
- Hispanic / Latino 49% Two or more races 22% Black 20% White 19% Asian 6%
- Hispanic origin (detail)
- Mexican 26% Puerto Rican 1% Cuban 4%
- Common ancestry
- Lithuanian 1% Italian 1%
- Foreign-born
- 32% · Canada, Jamaica, Vietnam
- Languages at home
- 48% English-only · Spanish 40% Other Indo-European 3% Vietnamese 1%
Political lean MEDSL · Harris
- 2024 margin
- Lean D (+5.5) · D 52.0% · R 46.4% · Other 1.6%
- 2008→2024 swing
- +3.9pp toward D · 2008: 1.6pp · 2024: 5.5pp
- All cycles
- 2024: D+5.5 2020: D+13.3 2016: D+12.4 2012: D+0.1 2008: D+1.6
Not yet ingested
- Civics
- —
Market trends
- HPI YoY
- ▼ -1.27%
- Current HPI
- 254.6622
- Rent YoY
- ▼ -2.86%
- Metro
- Houston-The Woodlands-Sugar Land, TX
- State GDP YoY
- ▲ 3.95%
- F500 in state
- 110
Industry mix (Fortune 500 HQ in TX)
| Industry | F500 HQs | Revenue |
|---|---|---|
| Energy | 16 | $1,198B |
|
||
| Technology | 5 | $198B |
|
||
| Engineering / Construction | 4 | $72B |
|
||
| Energy Services | 3 | $60B |
|
||
| Utilities | 3 | $41B |
|
||
| Healthcare | 2 | $330B |
|
||
Price history
+150.4% since first listed2 events — show timeline
- 2026-06-10 Listed $150,000 HARMLS
- 1996-03-07 Sold (Public Records) $59,900 Public Records
Property tax history
+9.2%/yrLatest (2025): $5,166 · +3.0% YoY. Source: county tax records.
Cash-flow waterfall
monthlySold comps — $/sqft
last 12 mo · ≤1 miLoading sold comps…